Alerting Overview
Last Updated: September 13, 2026
Review baseline: Prometheus 3.14.0 and Alertmanager 0.34.0. Examples assume one cluster and deduplicated series. Verify actual jobs, labels, exporters and metric availability, then tune thresholds. Only local rule/routing checks were run; no cluster or notification channel was exercised.
Table of Contents
- The Role and Importance of Alerting
- Alert Lifecycle
- Alert Design Principles
- Alert Routing and Escalation
- On-Call Rotation
- Alerting Strategy for EKS Environments
- Solution Comparison
The Role and Importance of Alerting
Alerting's Position in the Three Pillars of Observability
Metrics, logs and traces are common observability signals; profiles and other signals also exist. A rule engine does not necessarily evaluate all three directly:
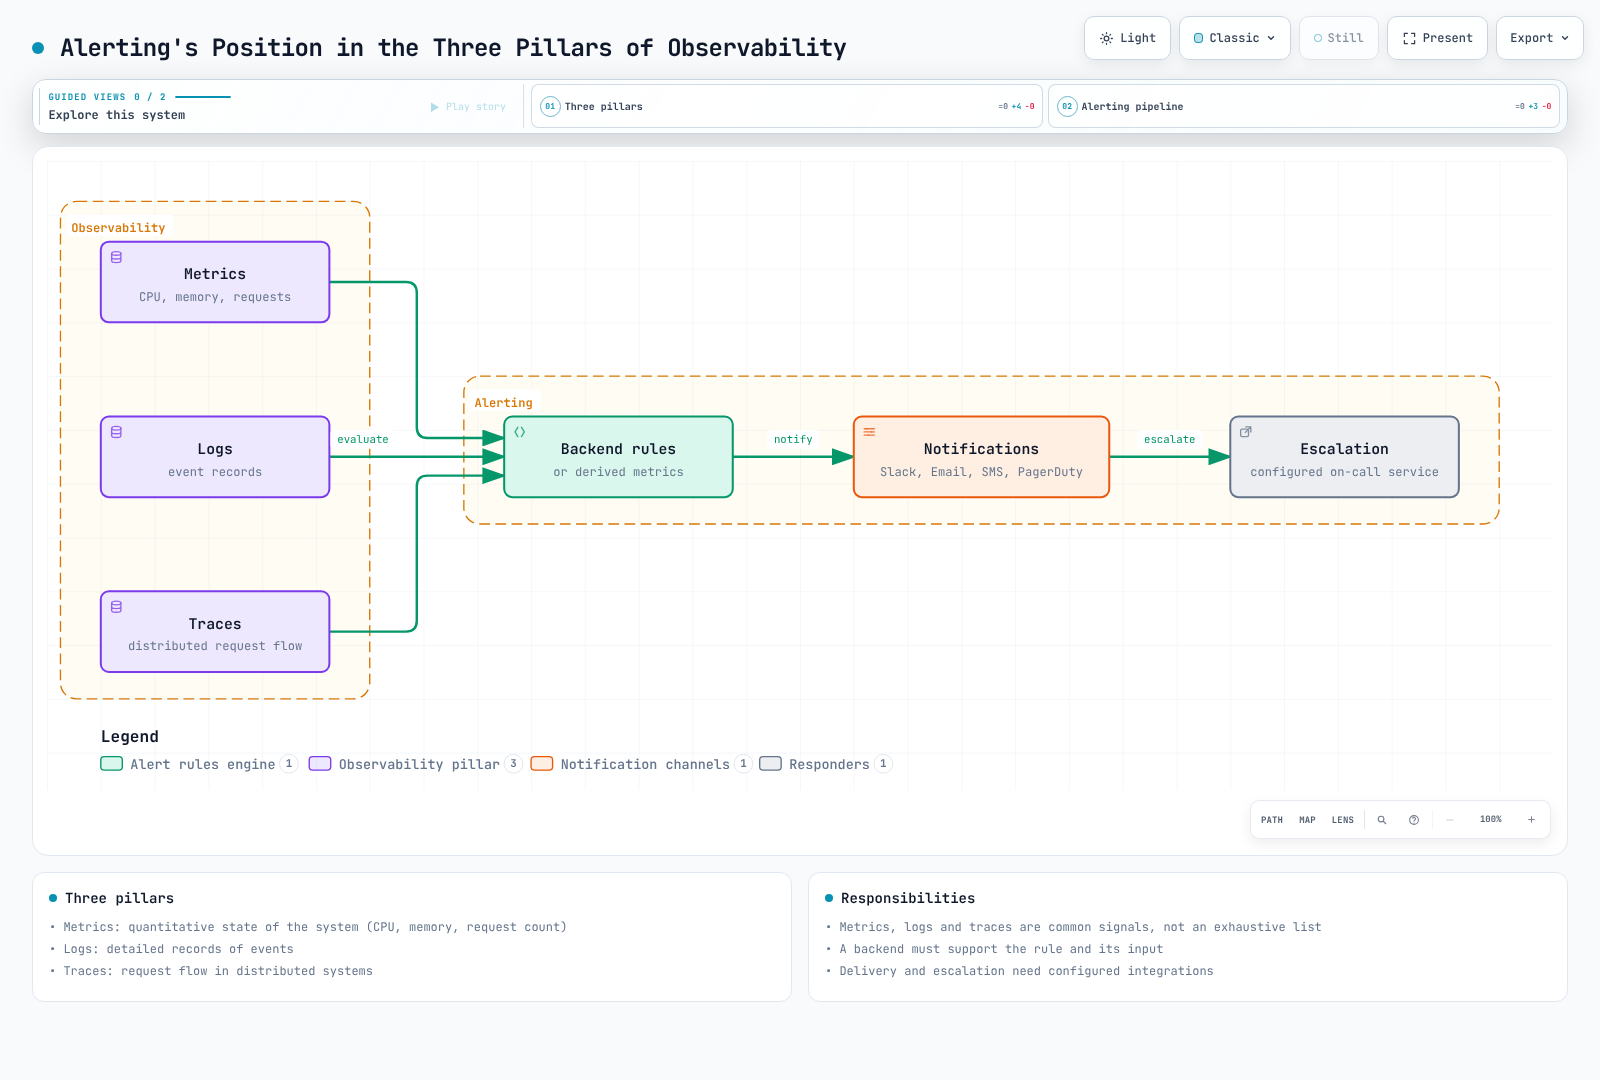
- Metrics: Quantitative state of the system (CPU, memory, request count, etc.)
- Logs: Detailed records of events
- Traces: Request flow in distributed systems
Prometheus rules evaluate metrics. Logs and traces feed alerts through backend-specific rules or derived metrics. Detection, notification and human acknowledgment are separate stages, and delivery success needs its own monitoring.
Why Alerting is Necessary
- Proactive Problem Response: Detect issues before users experience problems
- Minimize Downtime: Improve service availability through fast detection and response
- Cost Reduction: Reduce labor costs through automated monitoring
- SLA/SLO Compliance: Essential component for achieving service level objectives
- Incident Recording: Track and analyze problem occurrence history
Good Alerts vs Bad Alerts
| Aspect | Good Alerts | Bad Alerts |
|---|---|---|
| Actionability | Requires immediate action | Information only, no action needed |
| Clarity | Clear what the problem is | Vague and unclear |
| Urgency | Urgency matches severity | Everything is urgent |
| Frequency | Appropriate frequency | Too frequent or too rare |
| Duplication | Related alerts grouped | Dozens of alerts for same issue |
Alert Lifecycle
The diagram combines rule state and incident response. Prometheus uses inactive/pending/firing; acknowledgment and work-in-progress belong to an on-call tool. Closing an incident does not clear a firing rule. A disappearing time series can also deactivate a rule and must not be treated as proof of recovery:
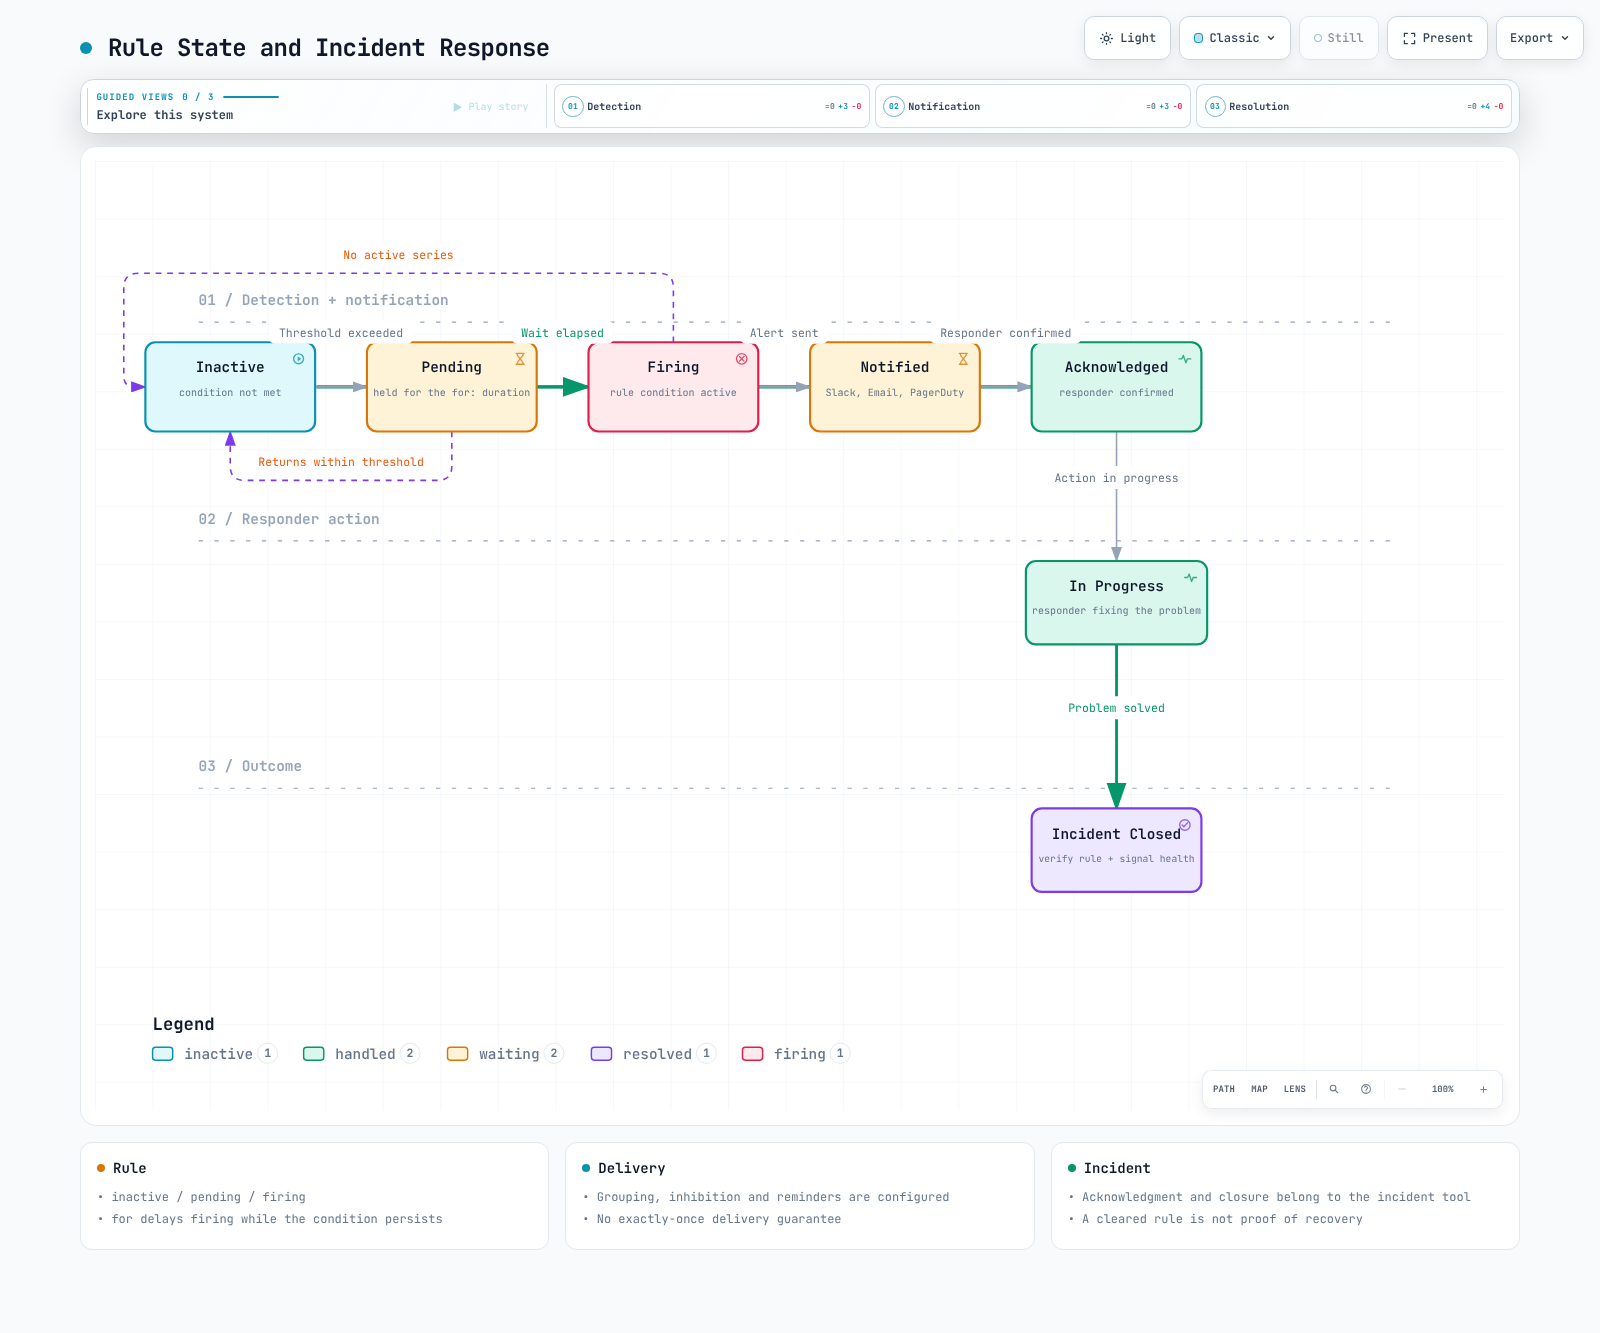
1. Detection
- Threshold-based: When a specific value exceeds a configured threshold
- Rate of change-based: When the rate of change is abnormal
- Anomaly detection: Machine learning-based abnormal pattern detection
- Log patterns: When specific log patterns occur
groups:
  - name: node-alerts
    rules:
      - alert: HighCPUUsage
        expr: 100 * (1 - avg by (cluster, instance) (rate(node_cpu_seconds_total{mode="idle"}[5m]))) > 80
        for: 5m
        labels:
          severity: warning
          team: sre
        annotations:
          summary: "High CPU usage detected"
          description: "CPU usage is above 80% for 5 minutes on {{ $labels.instance }}"
2. Notification
- Channel selection: Slack, Email, SMS, PagerDuty, etc.
- Routing: Deliver to appropriate receivers based on alert type
- Grouping: Bundle related alerts together
- Deduplication: Reduce duplicate notifications; repeat_interval reminders and retries remain possible, without an exactly-once guarantee
3. Escalation
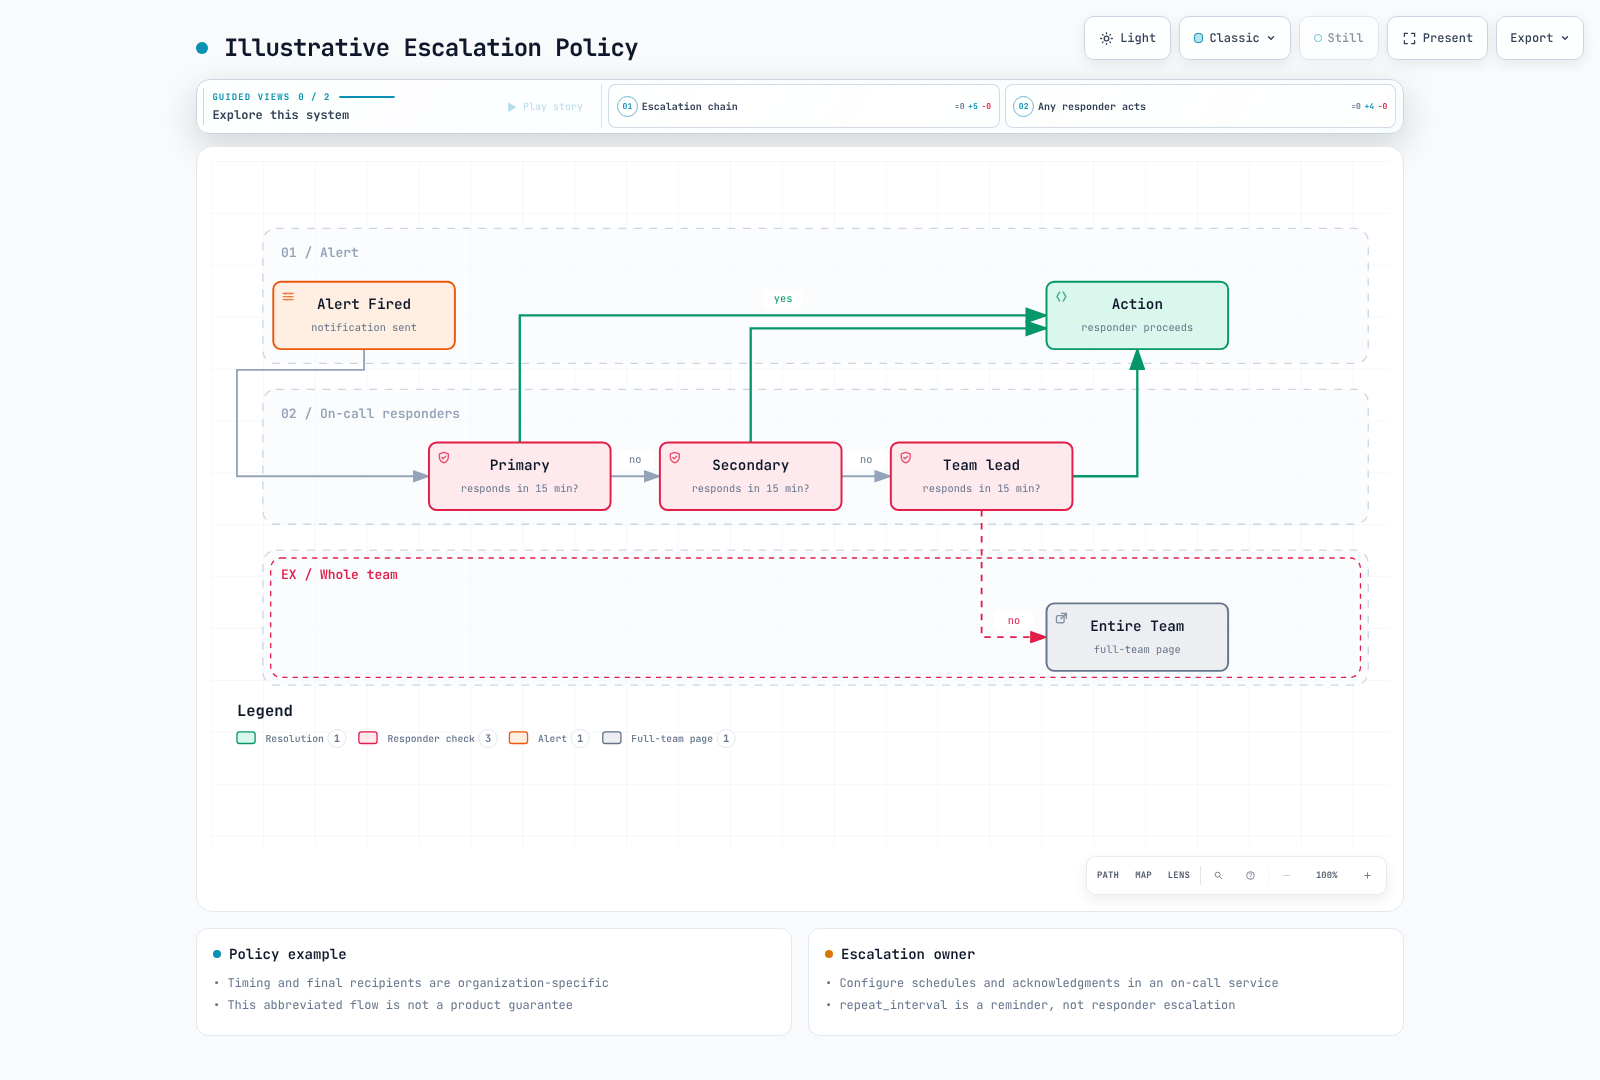
- Time-based: Escalate to next responder if no response within specified time
- Severity-based: Different escalation paths based on severity
- Automatic escalation: Configure it in the on-call service. Alertmanager repeat_interval neither checks acknowledgment nor rotates responders
4. Resolution
- Manual resolution: A responder closes the incident in the incident tool; rule state is checked separately
- Auto-resolution: Update incident state according to integration policy after checking rule and collection health
- Resolution notification: Send resolution notification when problem is fixed
Alert Design Principles
1. Actionable Alerts
Pages that interrupt a person need an immediate actionable response. Informational events and longer-term work can instead go to tickets or dashboards.
Bad example:
Alert: Database connection count increasedGood example:
Alert: Database connection pool exhausted
Action Required: Confirm user impact; inspect pool saturation and connection leaks using the runbook
Runbook: https://example.com/runbooks/replace-db-runbook
2. Preventing Alert Fatigue
Too many alerts can cause important alerts to be missed.
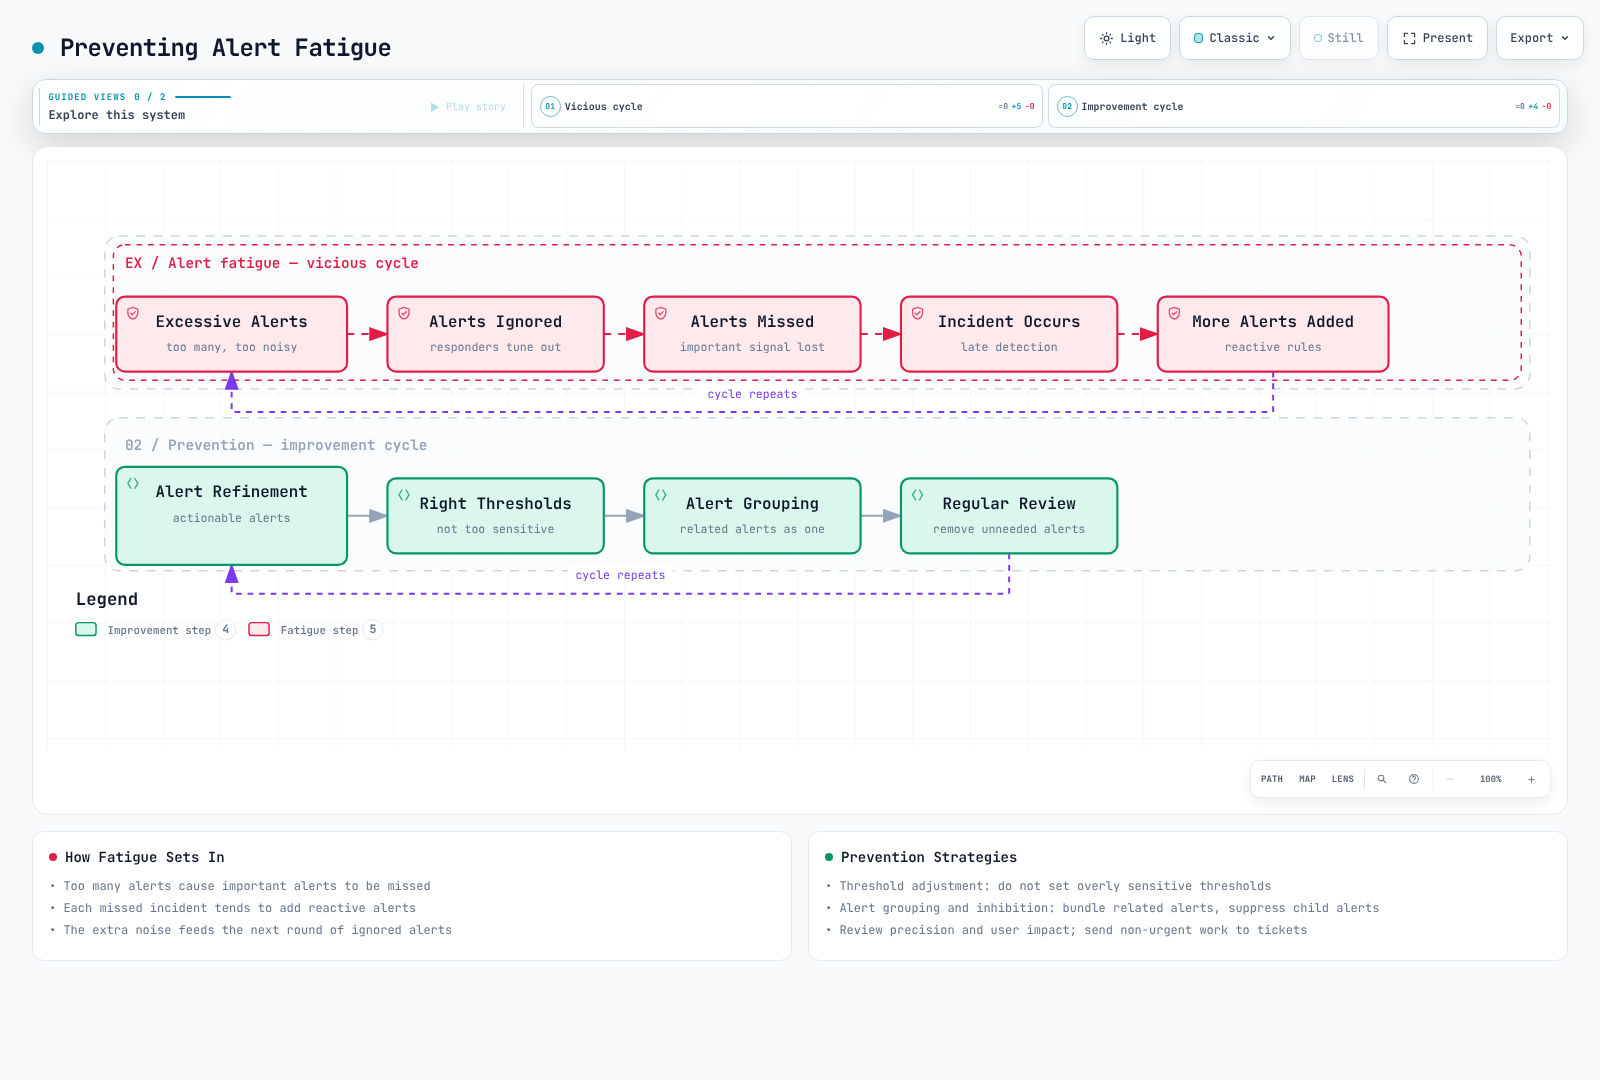
Alert fatigue prevention strategies:
- Threshold adjustment: Don't set too sensitive thresholds
- Alert grouping: Bundle related alerts into one
- Inhibition: Suppress child alerts when parent alert fires
- Regular review: Remove unnecessary alerts
- Gradual introduction: Start new alerts with low severity first
3. Severity Levels
These response times are illustrative organizational policy, not a product SLA or universal recommendation:
| Severity | Description | Response Time | Examples |
|---|---|---|---|
| Critical | Complete service outage | Immediate (within 5 min) | Full service down, data loss risk |
| High | Major function failure | Within 15 min | Payment system error, login failure |
| Warning | Potential problem | Within 1 hour | 80% disk usage, increased response latency |
| Info | Informational alert | Within business hours | Deployment complete, backup success |
groups:
  - name: disk-alerts
    rules:
      - alert: DiskSpaceCritical
        expr: |
          (100 * node_filesystem_avail_bytes{fstype!~"tmpfs|overlay|squashfs"}
            / node_filesystem_size_bytes{fstype!~"tmpfs|overlay|squashfs"} < 5)
          and node_filesystem_readonly == 0
          and node_filesystem_size_bytes > 0
        for: 5m
        labels:
          severity: critical
          team: sre
        annotations:
          summary: "Disk space critical"
      - alert: DiskSpaceWarning
        expr: |
          (100 * node_filesystem_avail_bytes{fstype!~"tmpfs|overlay|squashfs"}
            / node_filesystem_size_bytes{fstype!~"tmpfs|overlay|squashfs"} < 20)
          and node_filesystem_readonly == 0
          and node_filesystem_size_bytes > 0
        for: 10m
        labels:
          severity: warning
          team: sre
        annotations:
          summary: "Disk space low"
4. Alert Documentation
All alerts should include the following information:
- Description: What the alert means
- Impact: How this problem affects the service
- Action steps: Step-by-step guide for resolving the problem
- Runbook link: Detailed response procedure document
annotations:
  summary: "Investigate the affected operation"
  description: "Check the rule expression, its units, labels, and collection health."
  impact: "Document the affected user operation before paging."
  action: "Use the owning team's reviewed runbook; do not scale resources blindly."
  runbook_url: "https://example.com/runbooks/replace-with-reviewed-runbook"
Alert Routing and Escalation
Routing Strategy
Alerts should be delivered to appropriate receivers based on various criteria:
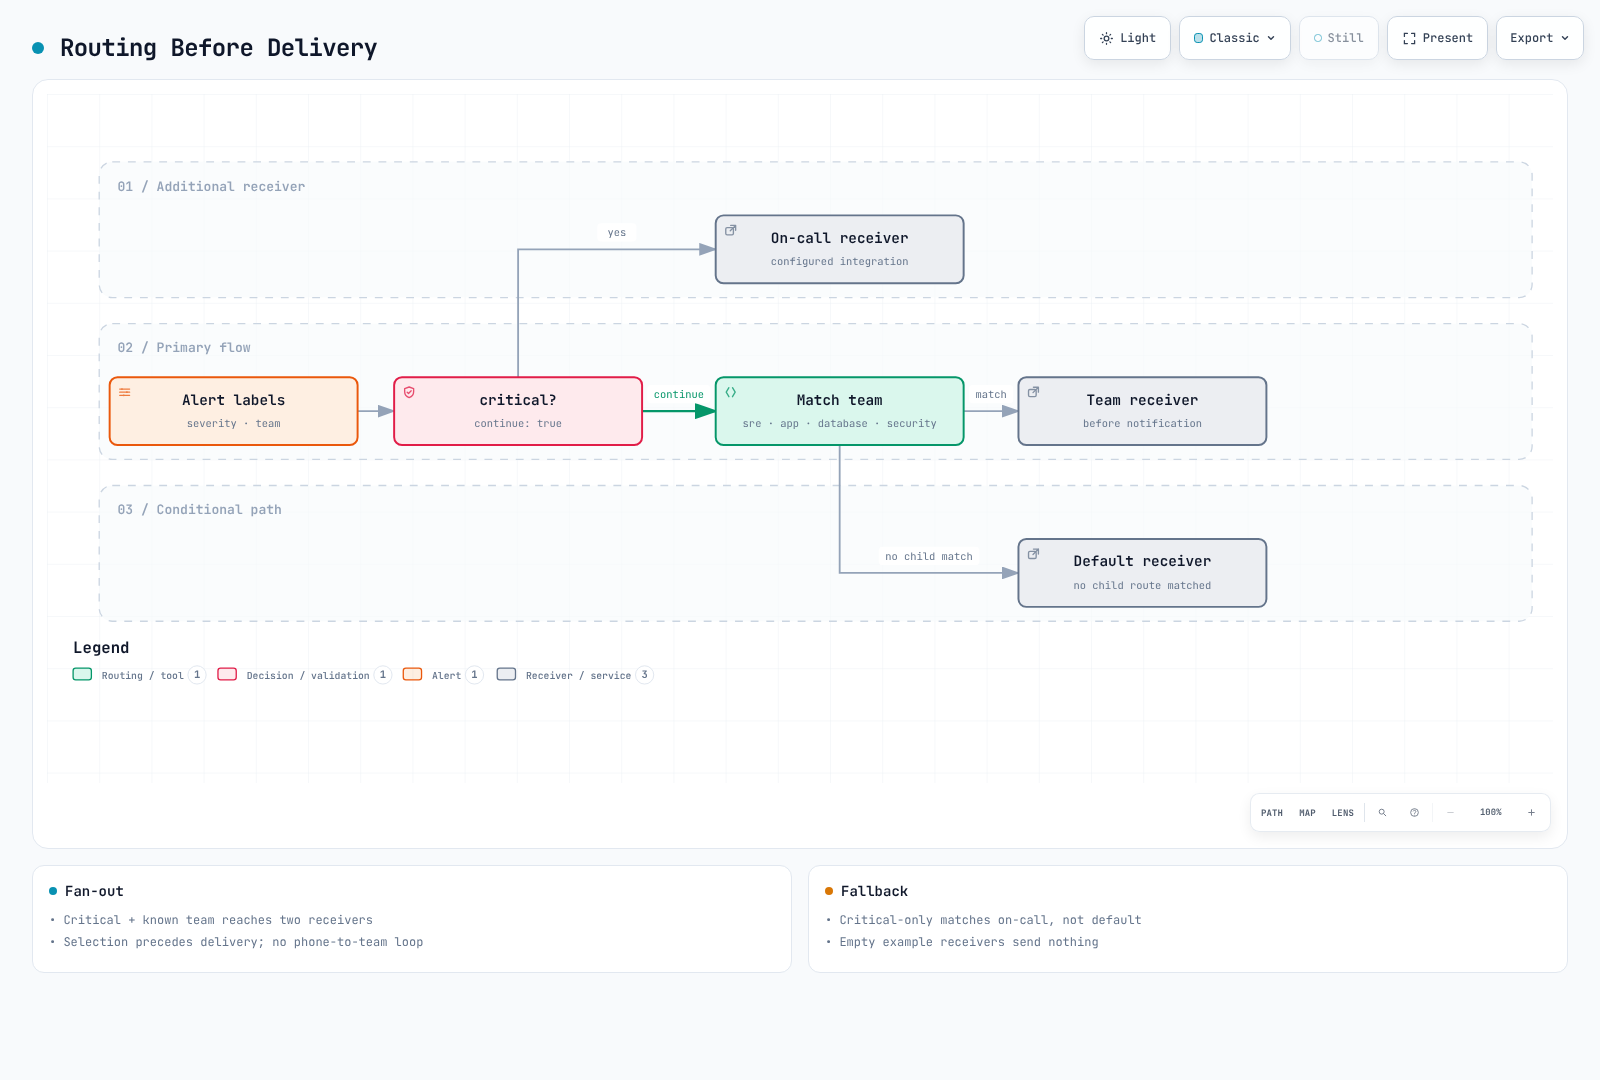
Routing Tree Design
This is a complete non-notifying routing-validation configuration. Empty receivers are intentional; configure reviewed integrations and Secret files before production use. Critical alerts fan out to the on-call receiver and matching team. Missing team labels fall back to default, except that a critical-only match does not also call default. Grouping delays mean there is no immediate-phone guarantee. Disk critical inhibits warning only for the same instance/device/mountpoint.
route:
  receiver: default-receiver
  group_by: [alertname, cluster, namespace, service]
  group_wait: 30s
  group_interval: 5m
  repeat_interval: 4h
  routes:
    - matchers: ['severity="critical"']
      receiver: critical-oncall
      continue: true
    - matchers: ['team="sre"']
      receiver: sre-team
    - matchers: ['team="app"']
      receiver: dev-team
    - matchers: ['team="database"']
      receiver: dba-team
    - matchers: ['team="security"']
      receiver: security-team
receivers:
  - name: default-receiver
  - name: critical-oncall
  - name: sre-team
  - name: dev-team
  - name: dba-team
  - name: security-team
inhibit_rules:
  - source_matchers: ['alertname="DiskSpaceCritical"', 'instance!=""', 'device!=""', 'mountpoint!=""']
    target_matchers: ['alertname="DiskSpaceWarning"', 'instance!=""', 'device!=""', 'mountpoint!=""']
    equal: [cluster, instance, device, mountpoint]
Escalation Policy
The following is illustrative. Configure time zones, acknowledgment windows, backups and re-page behavior in the on-call service and test them in a drill:
| Step | Time | Target | Channel |
|---|---|---|---|
| 1 | 0 min | Primary on-call | Slack, PagerDuty |
| 2 | 15 min | Secondary on-call | Slack, PagerDuty, SMS |
| 3 | 30 min | Team Lead | Slack, PagerDuty, Phone |
| 4 | 45 min | Engineering Manager | Phone |
| 5 | 60 min | CTO/VP Engineering | Phone |
On-Call Rotation
On-Call Concept
On-call refers to a designated responder responsible for system issues during a specified period.
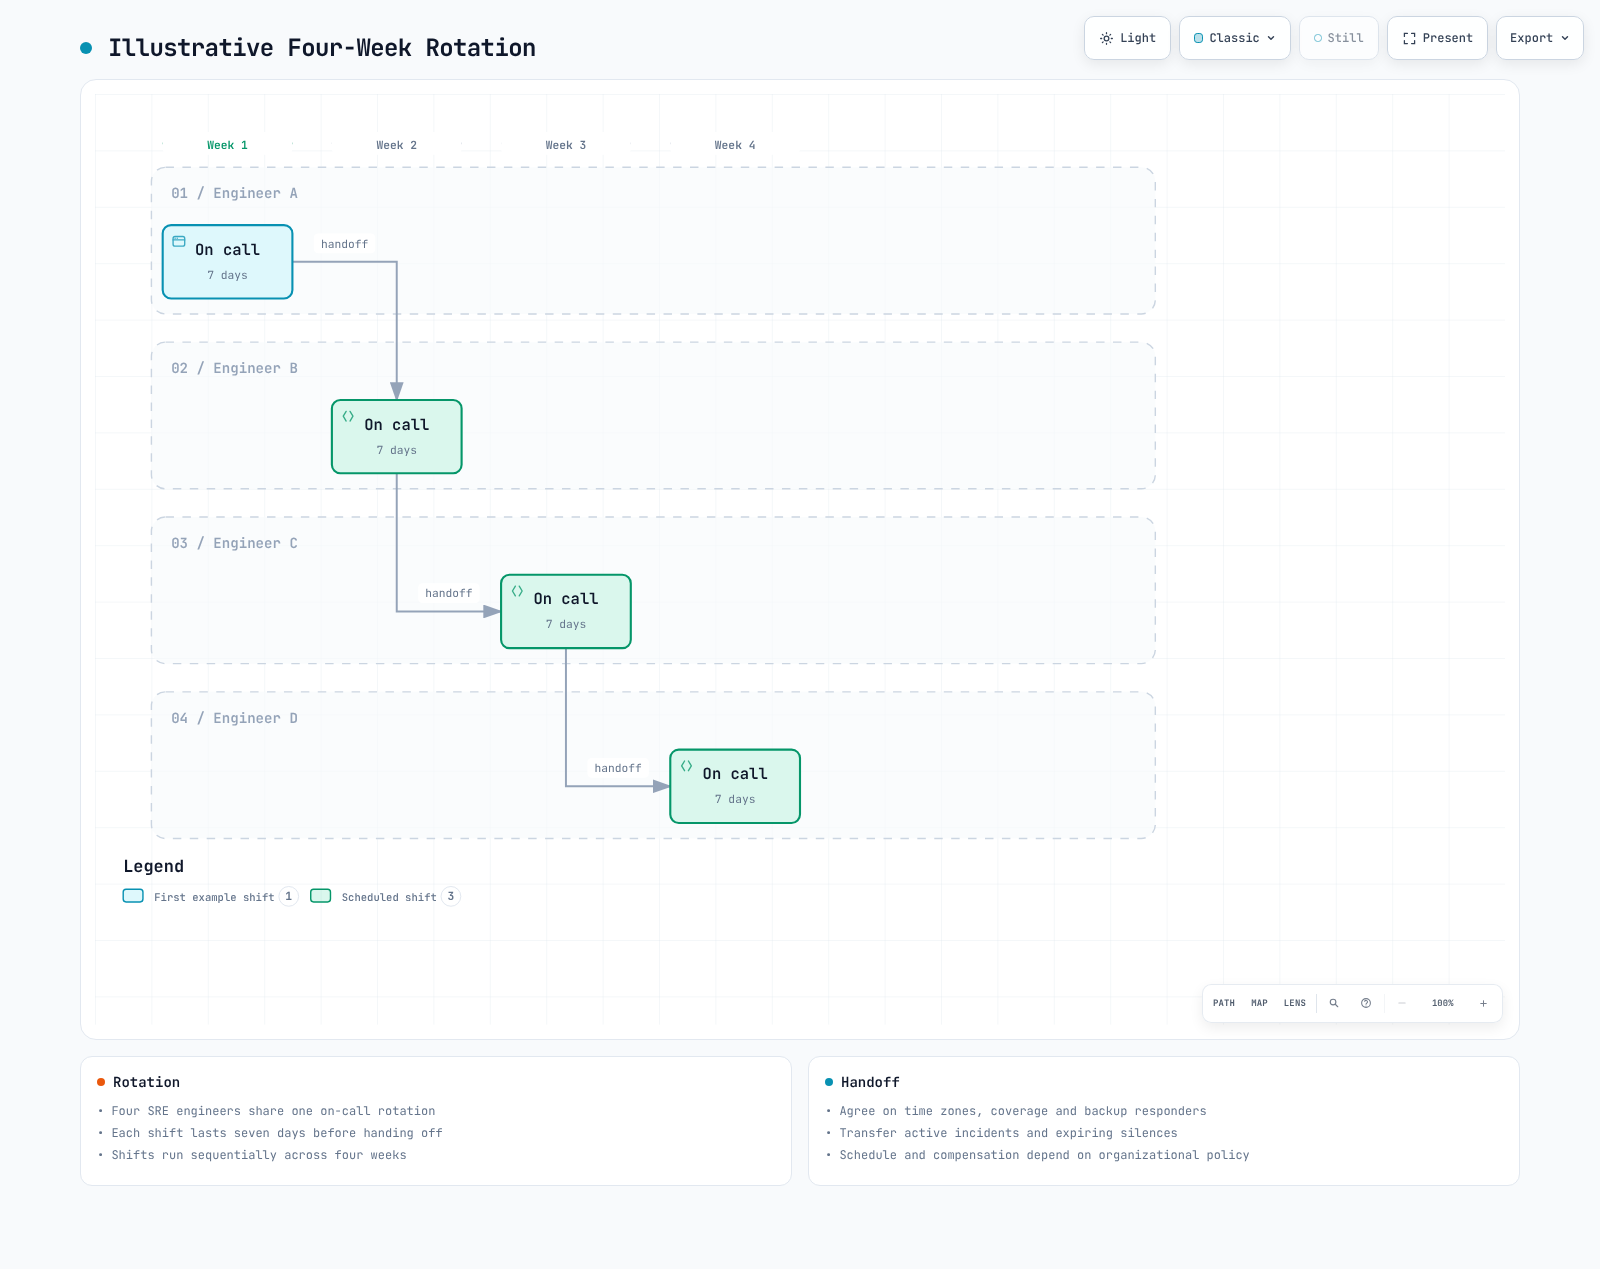
On-Call Best Practices
- Clear handoff schedule: Weekly or bi-weekly rotation
- Handoff process: Transfer ongoing issues during shift change
- Backup responder: Backup when primary is unavailable
- Appropriate compensation: On-call allowance or compensatory time off
- Burnout prevention: Appropriate rotation cycle
On-Call Tool Requirements
- Schedule management: Calendar integration, shift management
- Override: Temporary responder changes
- Escalation: Automatic escalation
- Mobile support: Receive alerts anytime, anywhere
- Reporting: On-call activity analysis
Alerting Strategy for EKS Environments
EKS-Specific Alerting Areas
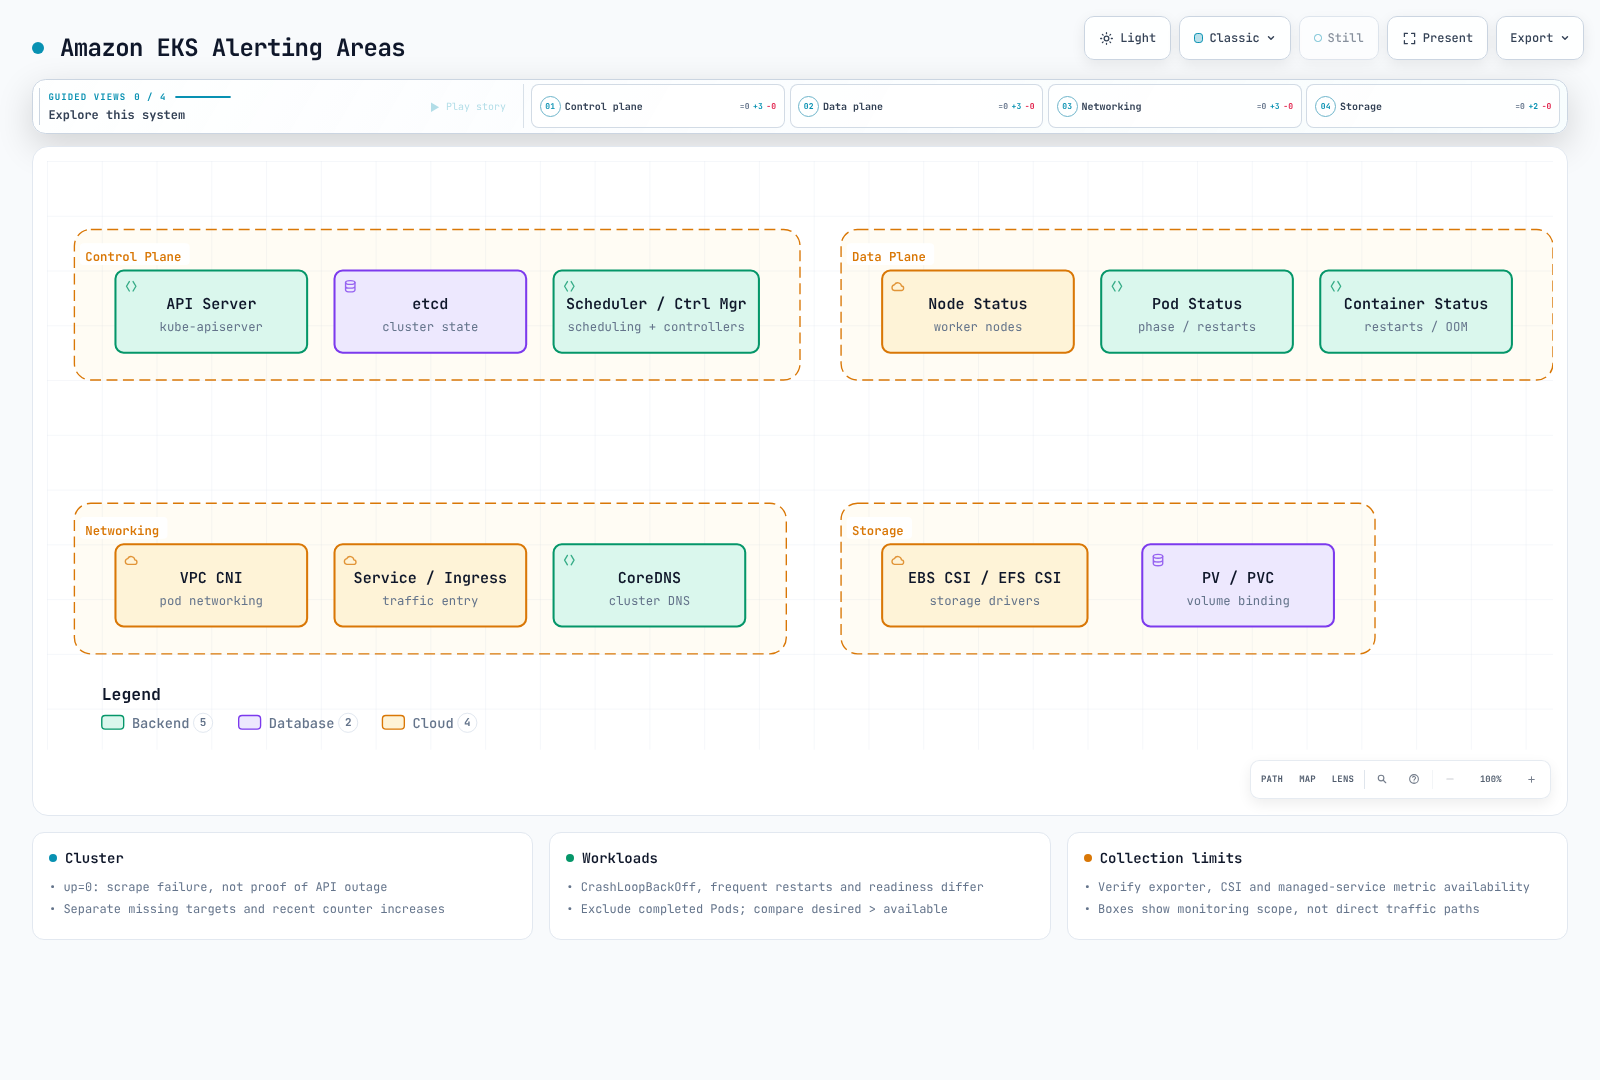
Alerting Strategy by Layer
1. Cluster-Level Alerts
Replace the job name with the deployed target. up=0 proves a scrape failure, not a complete API outage. The absent rule covers one collection scope; multi-cluster setups need expected-target inventory and cluster labels. Use increase for the cumulative Cluster Autoscaler error counter. A recent increase present for five minutes does not mean errors occurred continuously for five minutes. This rule does not apply unchanged to Karpenter or EKS Auto Mode.
groups:
  - name: eks-cluster
    rules:
      - alert: EKSAPIServerScrapeFailed
        expr: up{job="kubernetes-apiservers"} == 0
        for: 1m
        labels:
          severity: critical
          team: sre
        annotations:
          summary: "Prometheus cannot scrape the configured API server target"
      - alert: EKSAPIServerTargetMissing
        expr: absent(up{job="kubernetes-apiservers"})
        for: 5m
        labels:
          severity: warning
          team: sre
        annotations:
          summary: "No API server target series in this Prometheus"
      - alert: EKSNodeNotReady
        expr: kube_node_status_condition{condition="Ready",status="true"} == 0
        for: 5m
        labels:
          severity: critical
          team: sre
        annotations:
          summary: "Node {{ $labels.node }} is not ready"
      - alert: EKSClusterAutoscalerRecentErrors
        expr: increase(cluster_autoscaler_errors_total[10m]) > 0
        for: 5m
        labels:
          severity: warning
          team: sre
        annotations:
          summary: "Cluster Autoscaler recorded failed loops in the last 10 minutes"
2. Workload-Level Alerts
The CrashLoopBackOff series can disappear briefly between retries. This rule fires after a recent five-minute observation window remains populated for ten minutes. It detects recurring observations, not continuous current Waiting, and can remain active for up to five minutes after the last observation. Native rule tests distinguish a short transient, recurring retries and recovery.
groups:
  - name: eks-workloads
    rules:
      - alert: PodCrashLooping
        expr: max_over_time(kube_pod_container_status_waiting_reason{reason="CrashLoopBackOff"}[5m]) >= 1
        for: 10m
        labels:
          severity: warning
          team: app
        annotations:
          summary: "Pod {{ $labels.namespace }}/{{ $labels.pod }} repeatedly observed in CrashLoopBackOff"
      - alert: PodFrequentRestarts
        expr: increase(kube_pod_container_status_restarts_total[15m]) > 3
        for: 5m
        labels:
          severity: warning
          team: app
        annotations:
          summary: "Pod {{ $labels.namespace }}/{{ $labels.pod }} has frequent restarts"
      - alert: PodNotReady
        expr: |
          (kube_pod_status_ready{condition="true"} == 0)
          and on (namespace, pod, uid)
          (kube_pod_status_phase{phase=~"Pending|Running|Unknown"} == 1)
        for: 15m
        labels:
          severity: warning
          team: app
        annotations:
          summary: "Active pod {{ $labels.namespace }}/{{ $labels.pod }} is not ready"
      - alert: DeploymentReplicasMismatch
        expr: |
          kube_deployment_spec_replicas
            > on (namespace, deployment) kube_deployment_status_replicas_available
        for: 10m
        labels:
          severity: warning
          team: app
        annotations:
          summary: "Deployment {{ $labels.namespace }}/{{ $labels.deployment }} has fewer available replicas than desired"
3. Resource-Level Alerts
The CFS example measures throttled periods / total periods, not a fraction of elapsed time. Verify cAdvisor exports these metrics. Unlimited memory can appear as zero or a very large value; restrict the memory rule to containers with explicit limits. PVC statistics depend on the CSI driver and volume type. Zero denominators are excluded, but missing metrics do not prove health.
groups:
  - name: eks-resources
    rules:
      - alert: ContainerCPUThrottling
        expr: |
          (
            sum by (namespace, pod, container) (
              rate(container_cpu_cfs_throttled_periods_total{container!="",container!="POD"}[5m]))
            / sum by (namespace, pod, container) (
              rate(container_cpu_cfs_periods_total{container!="",container!="POD"}[5m]))
          ) > 0.25
          and sum by (namespace, pod, container) (
            rate(container_cpu_cfs_periods_total{container!="",container!="POD"}[5m])) > 0
        for: 5m
        labels:
          severity: warning
          team: app
        annotations:
          summary: "More than 25% of CFS periods throttled for {{ $labels.pod }}/{{ $labels.container }}"
      - alert: ContainerMemoryNearLimit
        expr: |
          (
            container_memory_working_set_bytes{container!="",container!="POD"}
            / container_spec_memory_limit_bytes{container!="",container!="POD"}
          ) > 0.9
          and container_spec_memory_limit_bytes{container!="",container!="POD"} > 0
        for: 5m
        labels:
          severity: warning
          team: app
        annotations:
          summary: "Container {{ $labels.pod }}/{{ $labels.container }} memory is near its reported limit"
      - alert: PVCAlmostFull
        expr: |
          (kubelet_volume_stats_used_bytes / kubelet_volume_stats_capacity_bytes > 0.85)
          and kubelet_volume_stats_capacity_bytes > 0
        for: 5m
        labels:
          severity: warning
          team: sre
        annotations:
          summary: "PVC {{ $labels.namespace }}/{{ $labels.persistentvolumeclaim }} is almost full"
AWS Service Integration Alerts
EKS 1.28+ supplies selected control-plane metrics in AWS/EKS; this does not expose every internal component for scraping. Enable control-plane logs separately to investigate authentication errors. Assess availability using collection health, API request failures and external probes:
| AWS Service | Monitoring Items | Alert Tool |
|---|---|---|
| EKS Control Plane | API Server availability, authentication errors | CloudWatch |
| EC2 (Nodes) | Instance status, system checks | CloudWatch |
| EBS | Volume status, IOPS usage | CloudWatch |
| EFS | Throughput, connection count | CloudWatch |
| ALB / NLB | ALB HTTP requests/errors/response time; NLB flows/TCP resets/target health | CloudWatch: use product-specific metrics |
| VPC / NAT Gateway | NAT metrics; accepted/rejected records in separately enabled Flow Logs | CloudWatch metrics/Logs; Flow Logs is not an alarm engine |
Solution Comparison
Major Alerting Solution Comparison Table
| Product | Role and operating constraints |
|---|---|
| Alertmanager | Open-source grouping, routing, inhibition and reminders; hosting and operation required. No on-call schedules or acknowledgment-based escalation |
| CloudWatch Alarms | Evaluates AWS metrics/supported queries, changes state and invokes configured actions; schedules are separate |
| Grafana OnCall OSS | Archived on 2026-03-24; not a default choice for new production deployment |
| Grafana Cloud IRM / PagerDuty | On-call/escalation candidates; verify current plans, channels, regions and contracts |
| Opsgenie | End of sale 2025-06-04; support and service end scheduled for 2027-04-05. Existing users need a migration plan |
Solution Selection Guide
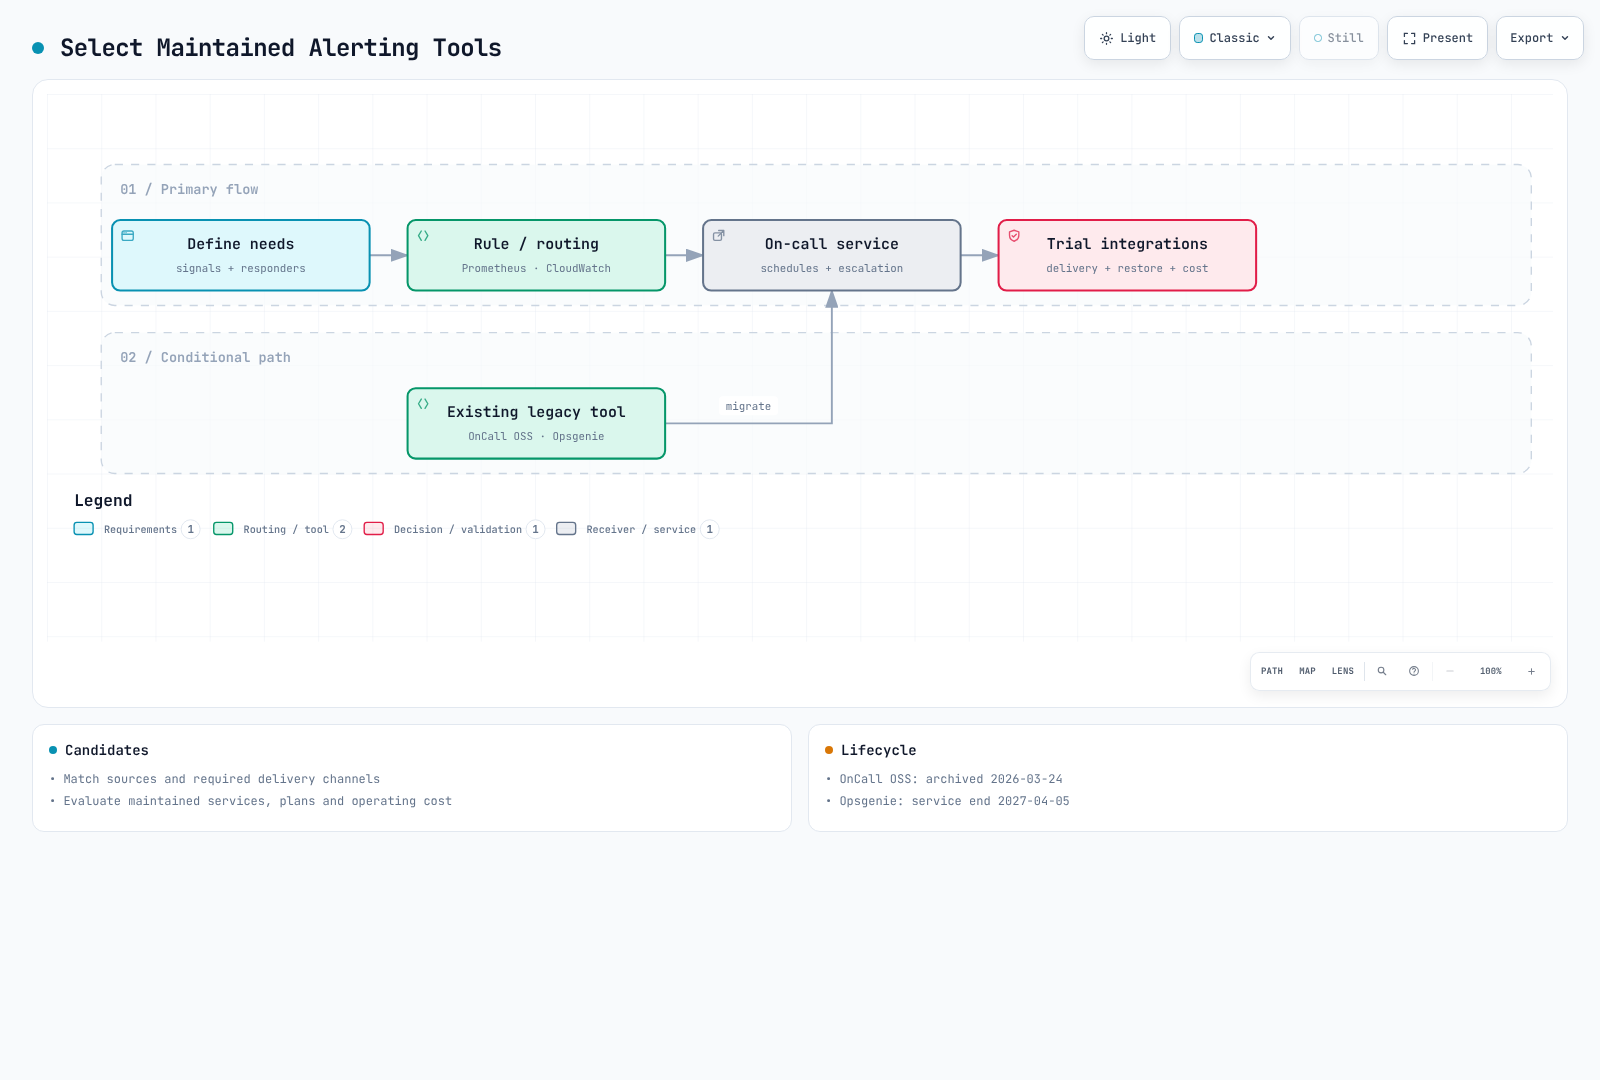
Recommended Solutions by Situation
- Prometheus-focused: use Alertmanager for grouping/routing and connect the required channels.
- AWS-metric-focused: evaluate CloudWatch Alarms with SNS or supported incident integrations.
- Around-the-clock response: choose a maintained on-call service based on staffing, backups, time zones, acknowledgment, escalation and cost.
- Existing Grafana OnCall OSS/Opsgenie: verify migration of features, history, schedules and integrations.
Hybrid Approach
Solutions can be combined. CloudWatch does not automatically send directly to Alertmanager. This example uses SNS/a supported integration to the on-call service; routing through Alertmanager requires a separately designed adapter, authentication and duplicate/resolution handling:
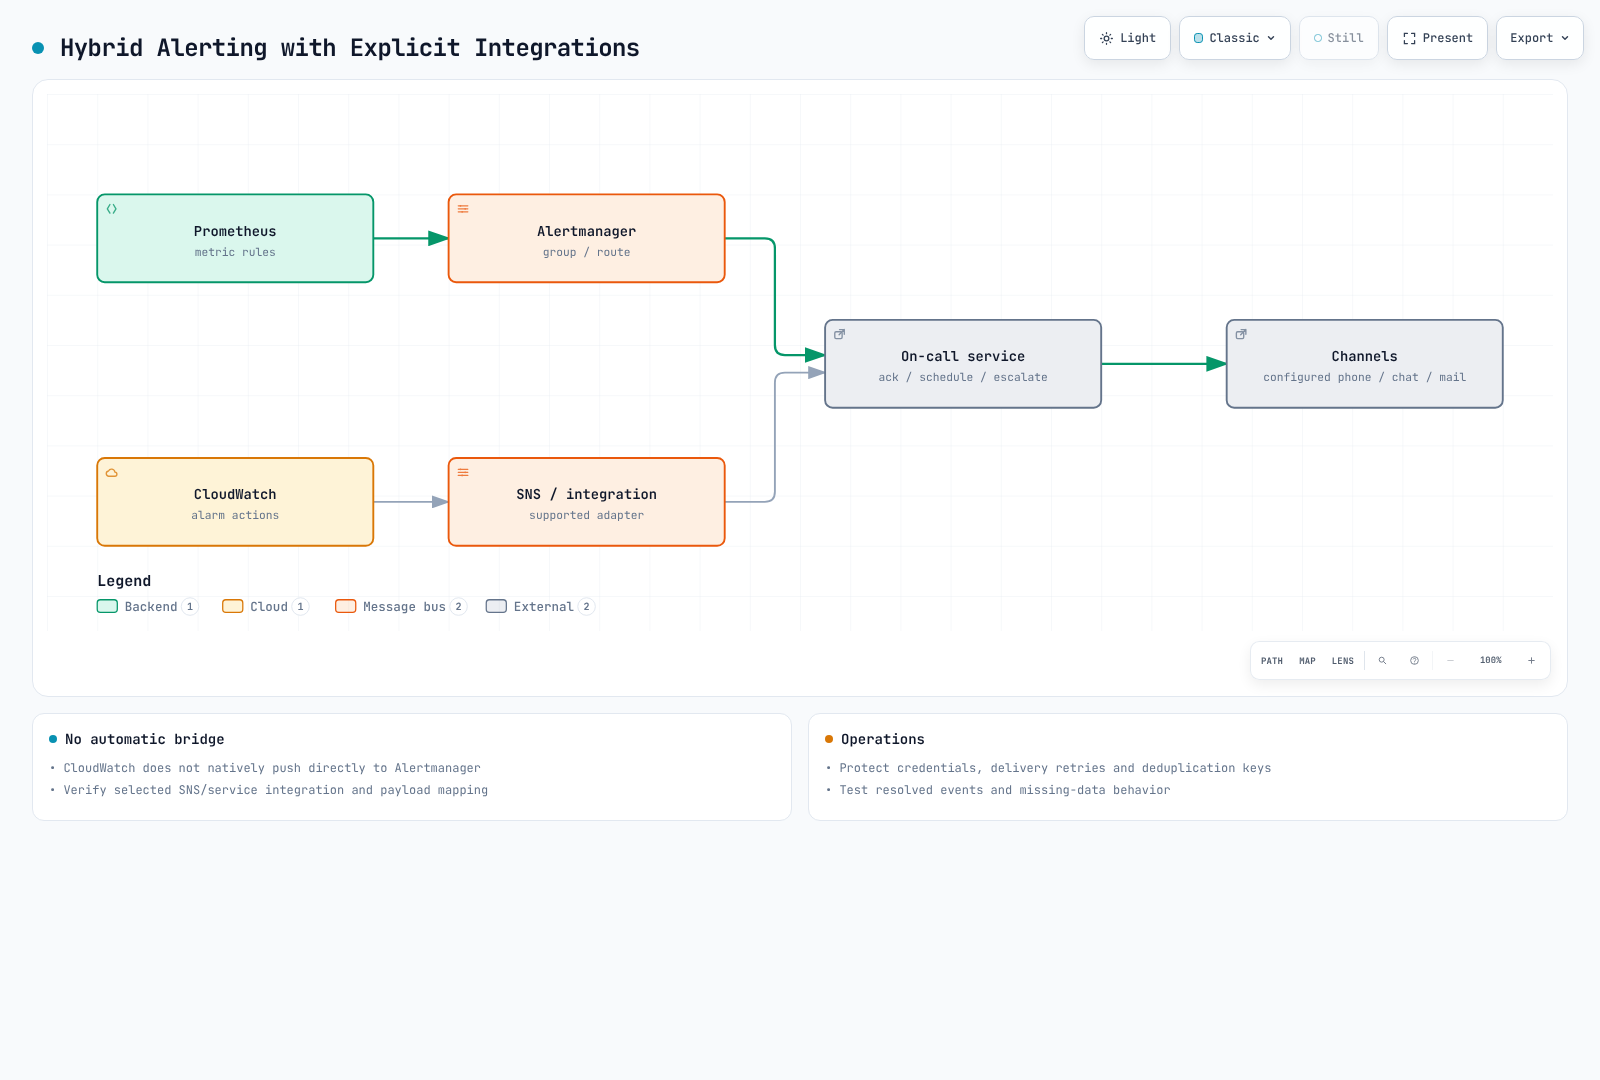
Example architecture:
- Prometheus + Alertmanager: Metric collection and primary alert processing
- CloudWatch: AWS service metric collection
- Maintained on-call service: On-call management and escalation
- Slack: Real-time alerts and collaboration
Next Steps
This section covered the basic concepts and strategies of alerting. For detailed configuration methods for each solution, refer to the following documents:
- Prometheus Alertmanager: Open source alert management
- CloudWatch Alarms: AWS native alerting
- Grafana OnCall: existing-installation review and migration considerations