Istio Distributed Tracing
Supported Versions: Istio 1.31 Last Updated: September 11, 2026
Validation scope: These lab configurations were checked against official references and offline validators, without deploying a cluster. Namespace, identity, storage, backend and load assumptions are stated with each example and must be verified for the target environment.
Distributed tracing tracks and visualizes request flows between microservices, enabling latency bottleneck identification, error root cause analysis, and understanding of service dependencies.
Table of Contents
- Distributed Tracing Overview
- OpenTelemetry Integration
- Jaeger Integration
- Zipkin Integration
- Context Propagation
- Sampling Strategies
- Trace Analysis
- Adding Custom Spans
- Performance Optimization
- Troubleshooting
Distributed Tracing Overview
W3C Trace Context
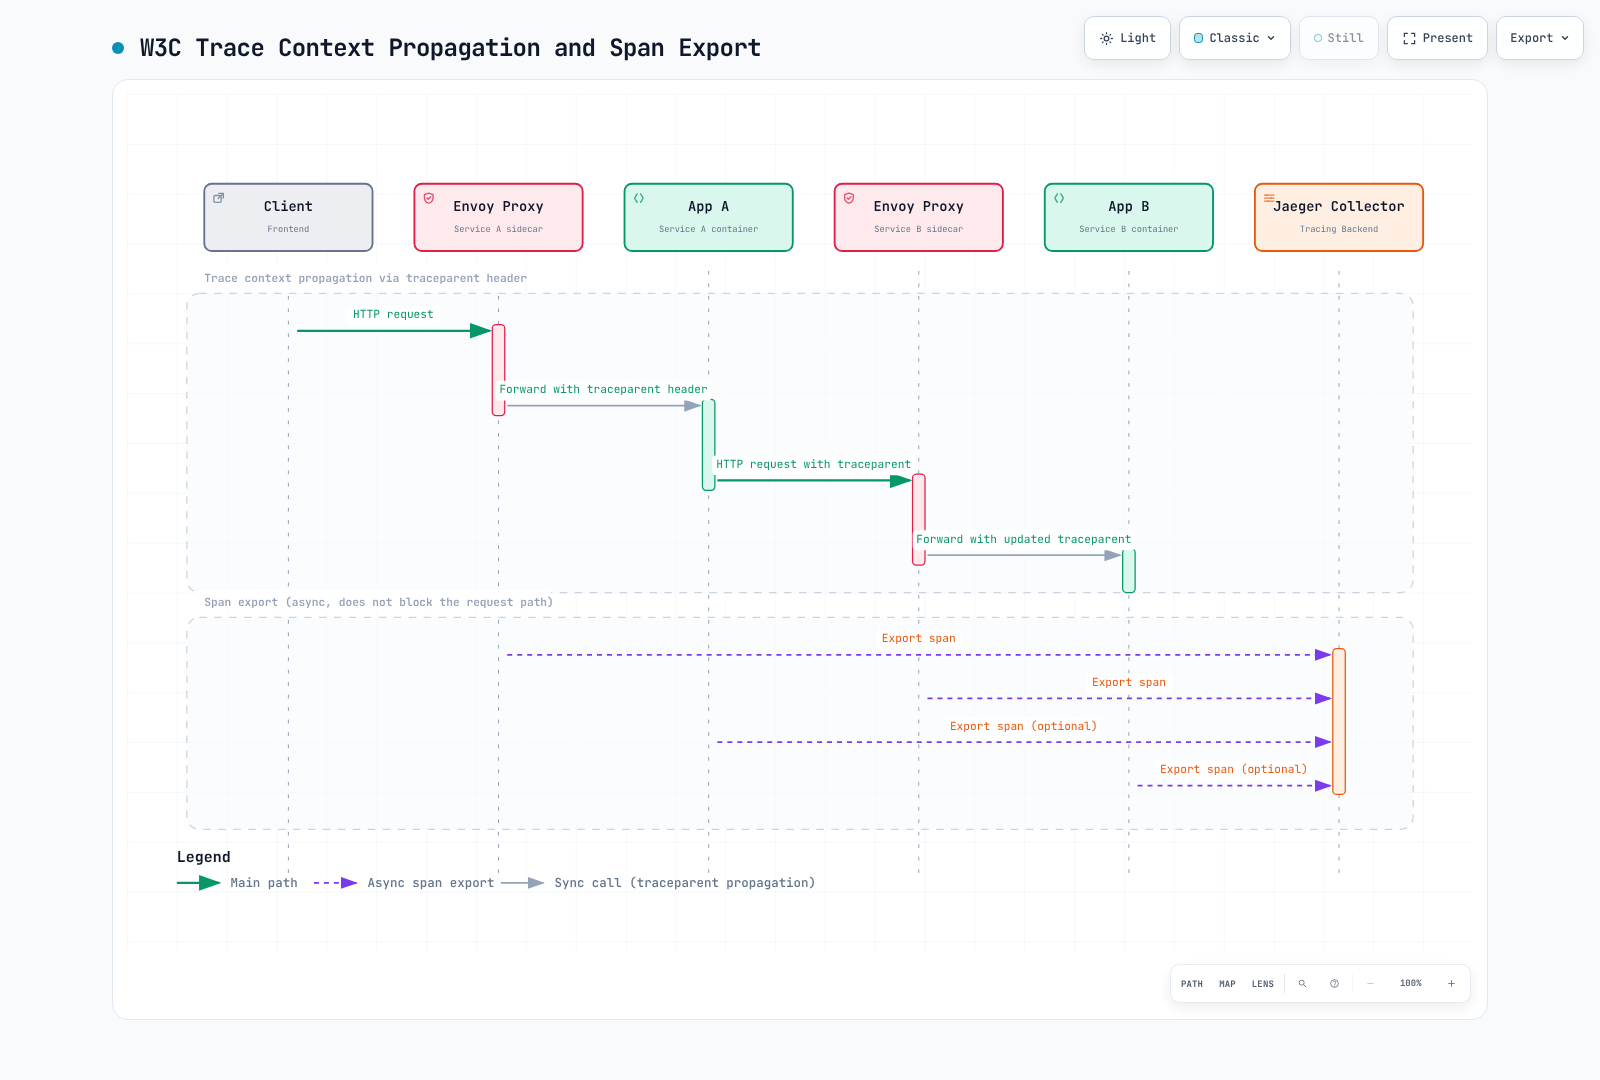
Istio supports W3C trace context with compatible tracing providers. Applications must still propagate context across their own requests; application spans in the diagram require an initialized SDK or agent. The examples cover sidecars/waypoints: ztunnel does not generate HTTP tracing spans.
Core Concepts
Trace
A collection of spans representing the complete path of a single request through the system
Span
A unit representing the start and end of a specific operation
- Span ID: Unique identifier
- Parent Span ID: Reference to parent span
- Trace ID: Identifier for the entire trace
- Operation Name: Name of the operation (e.g.,
HTTP GET /api/products) - Duration: Time taken for the operation
- Tags: Metadata (service name, HTTP status, etc.)
- Logs: Timestamped events
Baggage
Context key-value pairs propagated when the application/propagator supports baggage. Baggage is not automatically a span attribute and must not carry secrets.
OpenTelemetry Integration
OpenTelemetry supplies instrumentation, protocols and collectors; it is not a trace storage backend. This example sends OTLP to a collector, then to Jaeger. Zipkin and Tempo are alternative backends.
1. Installing OpenTelemetry Collector
Create namespace observability and deploy the Jaeger backend below before testing. This is a single-replica collector example with in-memory tail-sampling state. A plain Kubernetes Service across multiple tail samplers does not keep all spans of a trace together; production scaling needs trace-ID-based routing, capacity planning and late-span handling. Internal OTLP is plaintext in this lab: restrict network access or configure TLS/mTLS for deployment. The health extension and internal metrics listener are explicitly enabled.
apiVersion: v1
kind: ConfigMap
metadata:
  name: otel-collector-config
  namespace: observability
data:
  config.yaml: |
    extensions:
      health_check:
        endpoint: 0.0.0.0:13133
    receivers:
      otlp:
        protocols:
          grpc:
            endpoint: 0.0.0.0:4317
          http:
            endpoint: 0.0.0.0:4318
    processors:
      memory_limiter:
        check_interval: 1s
        limit_mib: 1024
      resource:
        attributes:
        - key: k8s.cluster.name
          value: production-k8s
          action: upsert
        - key: deployment.environment.name
          value: production
          action: upsert
      filter/health:
        error_mode: ignore
        trace_conditions:
        - span.name == "/health" or span.name == "/readiness" or span.name == "/liveness"
      tail_sampling:
        decision_wait: 30s
        num_traces: 50000
        policies:
        - name: errors
          type: status_code
          status_code:
            status_codes:
            - ERROR
        - name: slow
          type: latency
          latency:
            threshold_ms: 1000
        - name: baseline
          type: probabilistic
          probabilistic:
            sampling_percentage: 10
      batch:
        timeout: 10s
        send_batch_size: 1024
        send_batch_max_size: 2048
    exporters:
      otlp_grpc/jaeger:
        endpoint: jaeger-collector.observability.svc.cluster.local:4317
        tls:
          insecure: true
      debug:
        verbosity: basic
    service:
      extensions:
      - health_check
      pipelines:
        traces:
          receivers:
          - otlp
          processors:
          - memory_limiter
          - resource
          - filter/health
          - tail_sampling
          - batch
          exporters:
          - otlp_grpc/jaeger
          - debug
      telemetry:
        logs:
          level: info
        metrics:
          readers:
          - pull:
              exporter:
                prometheus:
                  host: 0.0.0.0
                  port: 8888
---
apiVersion: apps/v1
kind: Deployment
metadata:
  name: otel-collector
  namespace: observability
spec:
  replicas: 1
  selector:
    matchLabels:
      app: otel-collector
  template:
    metadata:
      labels:
        app: otel-collector
      annotations:
        sidecar.istio.io/inject: 'false'
    spec:
      containers:
      - name: otel-collector
        image: otel/opentelemetry-collector-contrib:0.160.0
        args:
        - --config=/etc/otel/config.yaml
        ports:
        - containerPort: 4317
          name: otlp-grpc
          protocol: TCP
        - containerPort: 4318
          name: otlp-http
          protocol: TCP
        - containerPort: 8888
          name: metrics
          protocol: TCP
        - containerPort: 13133
          name: health
        volumeMounts:
        - name: config
          mountPath: /etc/otel
        resources:
          requests:
            cpu: 500m
            memory: 1Gi
          limits:
            cpu: 2000m
            memory: 2Gi
        livenessProbe:
          httpGet:
            path: /
            port: 13133
        readinessProbe:
          httpGet:
            path: /
            port: 13133
      volumes:
      - name: config
        configMap:
          name: otel-collector-config
---
apiVersion: v1
kind: Service
metadata:
  name: otel-collector
  namespace: observability
  labels:
    app: otel-collector
spec:
  selector:
    app: otel-collector
  ports:
  - name: otlp-grpc
    port: 4317
    targetPort: 4317
  - name: otlp-http
    port: 4318
    targetPort: 4318
  - name: metrics
    port: 8888
    targetPort: 8888
  type: ClusterIP
The retired jaeger exporter is replaced by OTLP/gRPC and logging by debug. The filter matches exact observed span names; adjust it to the instrumentation, and account for the effect of dropping spans on trace completeness. Tail policies retain eligible traces that actually arrive; they cannot recover spans dropped upstream. Remove diagnostic exporting after verification.
2. Enabling OpenTelemetry in Istio
MeshConfig Configuration
Merge this provider into existing install settings using istioctl install -f; do not overwrite the entire istio ConfigMap. maxTagLength limits the path tag, not every span attribute.
apiVersion: install.istio.io/v1alpha1
kind: IstioOperator
spec:
  meshConfig:
    enableTracing: true
    extensionProviders:
    - name: otel-tracing
      opentelemetry:
        service: otel-collector.observability.svc.cluster.local
        port: 4317
        maxTagLength: 256
Enable Tracing with Telemetry API
apiVersion: telemetry.istio.io/v1
kind: Telemetry
metadata:
  name: otel-tracing
  namespace: istio-system
spec:
  tracing:
  - providers:
    - name: otel-tracing
    randomSamplingPercentage: 100.0
    customTags:
      cluster_id:
        literal:
          value: "production-cluster"
      environment:
        literal:
          value: "production"
Use one applicable selector-free Telemetry resource per namespace; merge tracing and logging settings instead of applying conflicting examples. Header tags are untrusted request metadata, not authenticated identity. Use only approved pseudonymous user correlation values. Environment tags read the proxy environment, not application environment variables.
3. Per-Namespace Tracing Configuration
apiVersion: telemetry.istio.io/v1
kind: Telemetry
metadata:
  name: namespace-tracing
  namespace: production
spec:
  tracing:
  - providers:
    - name: otel-tracing
    randomSamplingPercentage: 100.0
    customTags:
      namespace:
        literal:
          value: "production"
      team:
        literal:
          value: "backend-team"
      # Add request headers as tags
      user_id:
        header:
          name: x-user-id
          defaultValue: "unknown"
      request_id:
        header:
          name: x-request-id
      # Add environment variables as tags
      pod_name:
        environment:
          name: POD_NAME
          defaultValue: "unknown"
Jaeger Integration
Jaeger 2 Development Deployment
Jaeger 2 uses the jaegertracing/jaeger image with an explicit configuration file. The following memory-backed instance is for development; restarting it loses traces. Query and OTLP endpoints stay inside the cluster; use port-forwarding to reach the UI.
apiVersion: v1
kind: ConfigMap
metadata:
  name: jaeger-config
  namespace: observability
data:
  config.yaml: |
    extensions:
      jaeger_storage:
        backends:
          traces:
            memory:
              max_traces: 50000
      jaeger_query:
        storage:
          traces: traces
    receivers:
      otlp:
        protocols:
          grpc:
            endpoint: 0.0.0.0:4317
          http:
            endpoint: 0.0.0.0:4318
    processors:
      batch: {}
    exporters:
      jaeger_storage_exporter:
        trace_storage: traces
    service:
      extensions:
      - jaeger_storage
      - jaeger_query
      pipelines:
        traces:
          receivers:
          - otlp
          processors:
          - batch
          exporters:
          - jaeger_storage_exporter
---
apiVersion: apps/v1
kind: Deployment
metadata:
  name: jaeger
  namespace: observability
spec:
  replicas: 1
  selector:
    matchLabels:
      app: jaeger
  template:
    metadata:
      labels:
        app: jaeger
      annotations:
        sidecar.istio.io/inject: 'false'
    spec:
      containers:
      - name: jaeger
        image: jaegertracing/jaeger:2.20.0
        args:
        - --config=/etc/jaeger/config.yaml
        ports:
        - containerPort: 4317
          name: otlp-grpc
        - containerPort: 4318
          name: otlp-http
        - containerPort: 16686
          name: query-http
        volumeMounts:
        - name: config
          mountPath: /etc/jaeger
          readOnly: true
        resources:
          requests:
            cpu: 200m
            memory: 512Mi
          limits:
            cpu: 1000m
            memory: 2Gi
      volumes:
      - name: config
        configMap:
          name: jaeger-config
---
apiVersion: v1
kind: Service
metadata:
  name: jaeger-collector
  namespace: observability
spec:
  selector:
    app: jaeger
  ports:
  - name: otlp-grpc
    port: 4317
    targetPort: otlp-grpc
  - name: otlp-http
    port: 4318
    targetPort: otlp-http
---
apiVersion: v1
kind: Service
metadata:
  name: jaeger-query
  namespace: observability
spec:
  selector:
    app: jaeger
  ports:
  - name: query-http
    port: 16686
    targetPort: query-http
  type: ClusterIP
Production Storage and Scaling
For durable storage, use a supported, managed Elasticsearch/OpenSearch deployment and the matching Jaeger storage driver. Jaeger 2.20's published Elasticsearch matrix lists 7.x/8.x; do not infer support for a newer Elasticsearch major from its latest release. Existing ECK deployments also need their operator/cluster compatibility checked; EKS gp3 storage requires the EBS CSI driver and an actual StorageClass.
For Elasticsearch, replace the memory backend in jaeger-config with this fragment; preserve the receiver, exporter, query and pipeline settings using storage name traces. Create Secret jaeger-es-client with password for a restricted jaeger user and the public ca.crt matching the server certificate. Server hostname verification remains enabled.
extensions:
  jaeger_storage:
    backends:
      traces:
        elasticsearch:
          server_urls:
          - https://jaeger-es-es-http.observability.svc.cluster.local:9200
          auth:
            basic:
              username: jaeger
              password_file: /etc/jaeger/es/password
          tls:
            ca_file: /etc/jaeger/es/ca.crt
          indices:
            index_prefix: production
Merge the following Deployment fragment with the existing jaeger Deployment (preserve image, arguments, config mount and other fields). With shared durable storage, these combined collector/query instances are stateless and can run as replicas. Separate collector/query roles can be configured with the same Jaeger 2 binary when independent scaling is needed.
spec:
  replicas: 3
  template:
    spec:
      containers:
      - name: jaeger
        volumeMounts:
        - name: es-client
          mountPath: /etc/jaeger/es
          readOnly: true
      volumes:
      - name: es-client
        secret:
          secretName: jaeger-es-client
Configure storage initialization, index rotation/retention, backups and storage-side permissions using the Jaeger Elasticsearch guide and the released schema. The old 1.x environment-variable/image deployment is not a Jaeger 2 configuration. Review release notes before migrating existing stored traces.
Direct Istio → Jaeger OTLP Alternative
This bypasses the separate collector and therefore its tail-sampling policies. Use head sampling suitable for the workload. It is an alternative provider selection: merge into the existing installation and select only the intended provider in the applicable Telemetry resource.
apiVersion: install.istio.io/v1alpha1
kind: IstioOperator
spec:
  meshConfig:
    enableTracing: true
    extensionProviders:
    - name: jaeger
      opentelemetry:
        service: jaeger-collector.observability.svc.cluster.local
        port: 4317
maxTagLength: 256apiVersion: telemetry.istio.io/v1
kind: Telemetry
metadata:
name: jaeger-tracing
namespace: istio-system
spec:
tracing:
- providers:
- name: jaeger
randomSamplingPercentage: 1Zipkin Integration
Zipkin Development Deployment
This alternative uses Zipkin 3.6.1 with in-memory storage for testing; it loses data on restart. Production needs a supported persistent storage backend, authentication/TLS and configured network access. Select a backend using Zipkin's server configuration; do not point it at an undeployed elasticsearch:9200.
apiVersion: apps/v1
kind: Deployment
metadata:
  name: zipkin
  namespace: observability
spec:
  replicas: 1
  selector:
    matchLabels:
      app: zipkin
  template:
    metadata:
      labels:
        app: zipkin
      annotations:
        sidecar.istio.io/inject: 'false'
    spec:
      containers:
      - name: zipkin
        image: openzipkin/zipkin:3.6.1
        ports:
        - containerPort: 9411
          name: http
        env:
        - name: STORAGE_TYPE
          value: mem
        resources:
          requests:
            cpu: 200m
            memory: 512Mi
          limits:
            cpu: 1000m
            memory: 2Gi
---
apiVersion: v1
kind: Service
metadata:
  name: zipkin
  namespace: observability
spec:
  selector:
    app: zipkin
  ports:
  - name: http
    port: 9411
    targetPort: http
  type: ClusterIP
Configure the Istio Provider
The provider must exist before Telemetry can reference it. Merge this install input and use this Telemetry as an alternative to the collector/Jaeger selection.
apiVersion: install.istio.io/v1alpha1
kind: IstioOperator
spec:
  meshConfig:
    enableTracing: true
    extensionProviders:
    - name: zipkin
      zipkin:
        service: zipkin.observability.svc.cluster.local
        port: 9411
maxTagLength: 256apiVersion: telemetry.istio.io/v1
kind: Telemetry
metadata:
name: zipkin-tracing
namespace: istio-system
spec:
tracing:
- providers:
- name: zipkin
randomSamplingPercentage: 1Context Propagation
The key to distributed tracing is correctly propagating trace context between services.
Required HTTP Headers
Propagate the format configured for the proxy/backend; W3C and B3 are alternatives or explicitly configured multi-format propagation. Also forward x-request-id. B3 remains supported; a debug X-B3-Flags: 1 must not be enabled indiscriminately.
W3C Trace Context (Recommended)
traceparent: 00-0af7651916cd43dd8448eb211c80319c-b7ad6b7169203331-01
tracestate: congo=t61rcWkgMzE
B3 Headers
Single Header Format (Recommended):
b3: 80f198ee56343ba864fe8b2a57d3eff7-e457b5a2e4d86bd1-1-05e3ac9a4f6e3b90Multi Header Format:
X-B3-TraceId: 80f198ee56343ba864fe8b2a57d3eff7
X-B3-SpanId: e457b5a2e4d86bd1
X-B3-ParentSpanId: 05e3ac9a4f6e3b90
X-B3-Sampled: 1
Context Propagation by Application
The following examples assume an existing collector and service-b:8080/api/service-b endpoint. Install compatible API/SDK/exporter/instrumentation dependencies and initialize the SDK before handling requests. These lab endpoints use plaintext OTLP inside the cluster; configure trusted TLS/mTLS and network restrictions for the real deployment. SDK auto-instrumentation and manual propagation should not create duplicate client spans. Preserve x-request-id separately for Istio's request correlation.
Python (Flask + OpenTelemetry)
Install Flask, requests, opentelemetry-sdk, opentelemetry-exporter-otlp-proto-grpc, opentelemetry-instrumentation-flask, and opentelemetry-instrumentation-requests in the application environment. Flask/requests instrumentation manages extraction and injection; for manual propagation the API is opentelemetry.propagate.extract, not the original malformed import.
import atexit
import requests
from flask import Flask, request
from opentelemetry import trace
from opentelemetry.sdk.resources import Resource
from opentelemetry.sdk.trace import TracerProvider
from opentelemetry.sdk.trace.export import BatchSpanProcessor
from opentelemetry.exporter.otlp.proto.grpc.trace_exporter import OTLPSpanExporter
from opentelemetry.instrumentation.flask import FlaskInstrumentor
from opentelemetry.instrumentation.requests import RequestsInstrumentor
from opentelemetry.propagate import set_global_textmap
from opentelemetry.trace.propagation.tracecontext import TraceContextTextMapPropagator

provider = TracerProvider(resource=Resource.create({"service.name": "service-a"}))
provider.add_span_processor(BatchSpanProcessor(OTLPSpanExporter(
    endpoint="otel-collector.observability.svc.cluster.local:4317", insecure=True
)))
trace.set_tracer_provider(provider)
set_global_textmap(TraceContextTextMapPropagator())
atexit.register(provider.shutdown)
app = Flask(__name__)
FlaskInstrumentor().instrument_app(app)
RequestsInstrumentor().instrument()
tracer = trace.get_tracer(__name__)

@app.get("/api/service-a")
def service_a():
    # Flask instrumentation extracted the parent; requests instrumentation injects its child.
    with tracer.start_as_current_span("process-request"):
        headers = {}
        if request.headers.get("x-request-id"):
            headers["x-request-id"] = request.headers["x-request-id"]
        response = requests.get("http://service-b:8080/api/service-b",
                                headers=headers, timeout=3)
        response.raise_for_status()
        return response.text, response.status_code, {
            "Content-Type": response.headers.get("Content-Type", "text/plain")
        }

if __name__ == "__main__":
    app.run(host="0.0.0.0", port=8080)
The Flask development server is only for local testing; deploy with the application's production server and SDK shutdown lifecycle.
Go (Gin + OpenTelemetry)
Initialize a real tracer provider and W3C propagator. Use the context returned by Start for the downstream request, handle errors and close the response body. Add the imported modules to the application's go.mod; do not discard context/error return values.
package main

import (
	"context"
	"io"
	"log"
	"net/http"
	"time"

	"github.com/gin-gonic/gin"
	"go.opentelemetry.io/contrib/instrumentation/github.com/gin-gonic/gin/otelgin"
	"go.opentelemetry.io/contrib/instrumentation/net/http/otelhttp"
	"go.opentelemetry.io/otel"
	"go.opentelemetry.io/otel/attribute"
	"go.opentelemetry.io/otel/codes"
	"go.opentelemetry.io/otel/exporters/otlp/otlptrace/otlptracegrpc"
	"go.opentelemetry.io/otel/propagation"
	"go.opentelemetry.io/otel/sdk/resource"
	sdktrace "go.opentelemetry.io/otel/sdk/trace"
)

func main() {
	exporter, err := otlptracegrpc.New(context.Background(),
		otlptracegrpc.WithEndpoint("otel-collector.observability.svc.cluster.local:4317"),
		otlptracegrpc.WithInsecure())
	if err != nil {
		log.Fatal(err)
	}
	provider := sdktrace.NewTracerProvider(sdktrace.WithBatcher(exporter),
		sdktrace.WithResource(resource.NewSchemaless(attribute.String("service.name", "service-a"))))
	otel.SetTracerProvider(provider)
	otel.SetTextMapPropagator(propagation.TraceContext{})
	defer func() {
		ctx, cancel := context.WithTimeout(context.Background(), 5*time.Second)
		defer cancel()
		if err := provider.Shutdown(ctx); err != nil {
			log.Print(err)
		}
	}()
	client := &http.Client{Transport: otelhttp.NewTransport(http.DefaultTransport), Timeout: 3 * time.Second}
	router := gin.Default()
	router.Use(otelgin.Middleware("service-a"))
	router.GET("/api/service-a", func(c *gin.Context) {
		ctx, span := otel.Tracer("service-a").Start(c.Request.Context(), "process-request")
		defer span.End()
		req, err := http.NewRequestWithContext(ctx, http.MethodGet, "http://service-b:8080/api/service-b", nil)
		if err != nil {
			c.Status(http.StatusInternalServerError)
			return
		}
		if id := c.GetHeader("x-request-id"); id != "" {
			req.Header.Set("x-request-id", id)
		}
		resp, err := client.Do(req)
		if err != nil {
			span.RecordError(err)
			span.SetStatus(codes.Error, "downstream request failed")
			c.Status(http.StatusBadGateway)
			return
		}
		defer resp.Body.Close()
		// Bound this demonstration response to 1 MiB.
		body, err := io.ReadAll(io.LimitReader(resp.Body, (1<<20)+1))
		if err != nil || len(body) > 1<<20 {
			c.Status(http.StatusBadGateway)
			return
		}
		c.Data(resp.StatusCode, resp.Header.Get("Content-Type"), body)
	})
	if err := router.Run(":8080"); err != nil {
		log.Print(err)
	}
}
Java (Spring WebFlux + OpenTelemetry Java Agent)
Launch the Spring WebFlux application with a compatible OpenTelemetry Java agent and OTLP endpoint. The agent instruments the reactive server/client lifecycle and context propagation. A try (Scope ...) { return Mono... } finally { span.end(); } ends a span before subscription completes and is incorrect for asynchronous work. This controller relies on the agent's supported WebFlux/Reactor instrumentation:
OTEL_SERVICE_NAME=service-a \
OTEL_EXPORTER_OTLP_PROTOCOL=grpc \
OTEL_EXPORTER_OTLP_ENDPOINT=http://otel-collector.observability.svc.cluster.local:4317 \
java -javaagent:/opt/otel/opentelemetry-javaagent.jar -jar app.jarimport java.time.Duration;
import org.springframework.web.bind.annotation.GetMapping;
import org.springframework.web.bind.annotation.RequestHeader;
import org.springframework.web.bind.annotation.RestController;
import org.springframework.web.reactive.function.client.WebClient;
import reactor.core.publisher.Mono;
@RestController
public class ServiceAController {
private final WebClient webClient;
public ServiceAController(WebClient.Builder builder) {
this.webClient = builder.baseUrl("http://service-b:8080").build();
}
@GetMapping("/api/service-a")
public Mono<String> serviceA(@RequestHeader(value = "x-request-id", required = false) String requestId) {
return webClient.get().uri("/api/service-b")
.headers(headers -> { if (requestId != null) headers.set("x-request-id", requestId); })
.retrieve().bodyToMono(String.class)
.timeout(Duration.ofSeconds(3));
}
}Node.js (CommonJS Express + OpenTelemetry)
Install express, axios, @opentelemetry/api, @opentelemetry/sdk-node, @opentelemetry/auto-instrumentations-node, and @opentelemetry/exporter-trace-otlp-grpc. Load instrumentation before application imports; merely importing the API does not configure an SDK or exporter.
// instrumentation.cjs: load before Express, HTTP clients, or application modules.
const { NodeSDK } = require('@opentelemetry/sdk-node');
const { getNodeAutoInstrumentations } = require('@opentelemetry/auto-instrumentations-node');
const { OTLPTraceExporter } = require('@opentelemetry/exporter-trace-otlp-grpc');
const sdk = new NodeSDK({
  traceExporter: new OTLPTraceExporter(),
  instrumentations: [getNodeAutoInstrumentations()],
});
sdk.start();
process.once('SIGTERM', () => sdk.shutdown().finally(() => process.exit(0)));// app.cjs
const express = require('express');
const axios = require('axios');
const { trace, SpanStatusCode } = require('@opentelemetry/api');
const app = express();
const tracer = trace.getTracer('service-a');
app.get('/api/service-a', async (req, res) => {
await tracer.startActiveSpan('process-request', async (span) => {
try {
const headers = {};
if (req.headers['x-request-id']) headers['x-request-id'] = req.headers['x-request-id'];
const response = await axios.get('http://service-b:8080/api/service-b', {headers, timeout: 3000});
res.json({result: response.data});
} catch (error) {
span.recordException(error);
span.setStatus({code: SpanStatusCode.ERROR});
res.status(502).json({error: 'Downstream request failed'});
} finally {
span.end();
}
});
});
app.listen(8080);OTEL_SERVICE_NAME=service-a \
OTEL_EXPORTER_OTLP_ENDPOINT=http://otel-collector.observability.svc.cluster.local:4317 \
node --require ./instrumentation.cjs app.cjsTrace Context Verification
Verify that a test request produces spans with the same trace ID and the intended parent-child relationships in the backend. Inspect incoming and outgoing headers in a controlled application test. Default Envoy access logs do not include every trace header; enabling proxy debug logging does not enable access logs or guarantee header output. Configure the access-log format explicitly if headers are needed, and avoid logging credentials/baggage.
istioctl proxy-config listeners <pod-name> -n <namespace> -o json | \
  jq '.. | objects | select(has("tracing")) | .tracing'
istioctl proxy-config clusters <pod-name> -n <namespace> \
  --fqdn otel-collector.observability.svc.cluster.local
kubectl logs -n observability deployment/otel-collector --tail=100
Sampling Strategies
Sampling Levels
1. Head Sampling (Initial Sampling)
Head sampling decides early. The percentages below are alternatives; upstream sampling decisions and SDK samplers also affect which spans arrive. If the collector must evaluate every trace for errors/latency, send all eligible spans to it rather than discarding 90% before tail sampling.
Mesh-wide Level:
apiVersion: telemetry.istio.io/v1
kind: Telemetry
metadata:
  name: mesh-head-sampling
  namespace: istio-system
spec:
  tracing:
  - providers:
    - name: otel-tracing
    randomSamplingPercentage: 10.0
Namespace Level:
apiVersion: telemetry.istio.io/v1
kind: Telemetry
metadata:
  name: sampling-config
  namespace: production
spec:
  tracing:
  - providers:
    - name: otel-tracing
    randomSamplingPercentage: 25.0  # 25% sampling
Workload Level:
apiVersion: telemetry.istio.io/v1
kind: Telemetry
metadata:
  name: critical-service-tracing
  namespace: production
spec:
  selector:
    matchLabels:
      app: payment-service
  tracing:
  - providers:
    - name: otel-tracing
    randomSamplingPercentage: 100.0  # 100% sampling for critical services
2. Tail Sampling (Post-hoc Sampling)
Tail sampling decides from spans accumulated during its decision window, not from a guaranteed complete trace. Size the window and buffers for expected duration/volume, route a trace to the same collector, and account for late spans, restarts and overflow. Policies below retain matching traces that reach the collector. Merge this processor into the traces pipeline before the batch processor.
# OpenTelemetry Collector's tail_sampling processor
processors:
  tail_sampling:
    decision_wait: 10s  # Wait time for trace completion
    num_traces: 100000  # Number of traces to keep in memory
    expected_new_traces_per_sec: 1000
    policies:
      # Keep all traces with errors
      - name: errors
        type: status_code
        status_code:
          status_codes: [ERROR]

      # Keep all slow requests (> 1 second)
      - name: slow-traces
        type: latency
        latency:
          threshold_ms: 1000

      # 100% sampling for specific services
      - name: critical-services
        type: string_attribute
        string_attribute:
          key: service.name
          values:
          - payment-service
          - auth-service

      # Keep all HTTP 5xx errors
      - name: http-errors
        type: numeric_attribute
        numeric_attribute:
          key: http.response.status_code
          min_value: 500
          max_value: 599
      - name: legacy-http-errors
        type: numeric_attribute
        numeric_attribute:
          key: http.status_code
          min_value: 500
          max_value: 599

      # 5% sampling for the rest
      - name: probabilistic
        type: probabilistic
        probabilistic:
          sampling_percentage: 5
Rate-Limited Sampling
The rate-limiting policy is a span-rate token bucket, not a self-tuning error/latency sampler. This is an alternative policy list; adding it next to other keep policies does not impose a global cap on traces those policies retain. Bursts and complete-trace decisions affect short intervals.
processors:
  tail_sampling:
    policies:
      - name: rate-limited-sampling
        type: rate_limiting
        rate_limiting:
          spans_per_second: 1000  # Keep maximum 1000 spans per second
Sampling Strategy Guide
| Goal | Head input | Collector/storage decision |
|---|---|---|
| Small development test | 100% | Keep all, verify propagation |
| Bounded production volume | Measured percentage | Store received samples |
| Keep errors/slow traces | All eligible spans | Tail policies retain matching traces plus a baseline |
| Limit retained volume | All eligible spans for tail decisions | Explicit rate/composite policy and capacity limits |
These are design choices, not universal environment defaults. Low head sampling plus tail sampling cannot guarantee retaining all errors. Check actual span status and attribute names (http.response.status_code for current OpenTelemetry conventions, http.status_code for some proxy/legacy spans).
Trace Analysis
Searching Traces in Jaeger UI
# Access Jaeger UI
kubectl port-forward -n observability svc/jaeger-query 16686:16686

# Browser: http://localhost:16686
Search Options:
- Service: Service name
- Operation: Operation name (e.g.,
GET /api/products) - Tags: Tag filter (e.g.,
http.status_code=500) - Min Duration: Minimum latency
- Max Duration: Maximum latency
- Limit Results: Result count limit
Useful Trace Queries
1. Find Traces with Errors
Tags: error=trueOr
Tags: http.status_code=5002. Find Slow Requests
Min Duration: 1s3. Track Specific User Requests
Tags: user_id=123454. Analyze Specific API Endpoints
Operation: GET /api/products/{id}Jaeger UI API Diagnostics
After the port-forward above, these UI query endpoints help interactive diagnostics. They are internal UI APIs, not a stable application contract; use Jaeger’s documented query APIs for durable integrations.
# Query traces for a specific service
curl "http://localhost:16686/api/traces?service=productpage&limit=10"

# Query specific trace ID
curl "http://localhost:16686/api/traces/0af7651916cd43dd8448eb211c80319c"

# Query service list
curl "http://localhost:16686/api/services"

# Query operations for a specific service
curl "http://localhost:16686/api/services/productpage/operations"
Identifying Latency Bottlenecks
- Inspect the waterfall and exclusive time: Parent spans include child time; the longest parent alone does not locate the bottleneck.
- Check Critical Path: The path that most affects overall request time
- Parallel vs Sequential Execution: Check if tasks that could run in parallel are running sequentially
Grafana Tempo Integration
Tempo is an alternative trace backend. Its default HTTP query port is 3200; OTLP ingestion uses separate configured receivers such as 4317. Mount the following file into Grafana's provisioning/datasources directory (or configure the chart's datasource provisioning). A ConfigMap alone is not loaded automatically.
apiVersion: v1
kind: ConfigMap
metadata:
  name: grafana-datasources
  namespace: observability
data:
  tempo.yaml: |
    apiVersion: 1
    datasources:
    - name: Tempo
      uid: tempo
      type: tempo
      access: proxy
      url: http://tempo.observability.svc.cluster.local:3200
      jsonData:
        tracesToLogsV2:
          datasourceUid: loki
          tags:
          - key: service.name
            value: app
          filterByTraceID: false
          filterBySpanID: false
        tracesToMetrics:
          datasourceUid: prometheus
          tags:
          - key: service.name
            value: destination_canonical_service
          queries:
          - name: Request rate
            query: sum(rate(istio_requests_total{reporter="destination",$$__tags}[5m]))
        nodeGraph:
          enabled: true
The example requires existing datasource UIDs loki and prometheus. Align SDK service.name, Loki app, and Istio destination_canonical_service; if the actual values differ, change the mappings. Add namespace/cluster mappings when service names collide. Grafana provisioning turns $$__tags into the literal query variable $__tags. Enable trace-ID filtering only when logs contain the trace ID. A Tempo Service graph additionally requires generated service-graph/span metrics in Prometheus; ordinary Istio request metrics alone do not provide those series.
Adding Custom Spans
Add custom spans in application code for more detailed tracing.
Python Example
This function belongs in an initialized application; check_inventory, process_payment and PaymentError are application-defined callbacks/types.
from opentelemetry import trace
from opentelemetry.trace import Status, StatusCode

tracer = trace.get_tracer(__name__)

def process_order(order_id):
    with tracer.start_as_current_span("process-order") as span:
        span.set_attribute("order.id", order_id)
        span.set_attribute("order.amount", 99.99)

        # Check inventory
        with tracer.start_as_current_span("check-inventory") as inventory_span:
            inventory = check_inventory(order_id)
            inventory_span.set_attribute("inventory.available", inventory)

        # Process payment
        with tracer.start_as_current_span("process-payment", record_exception=False,
                                          set_status_on_exception=False) as payment_span:
            try:
                payment_result = process_payment(order_id)
                payment_span.set_attribute("payment.status", "success")
            except PaymentError as e:
                payment_span.set_status(Status(StatusCode.ERROR))
                payment_span.record_exception(e)
                raise

        # Record event
        span.add_event("Order processed successfully", {
            "order.id": order_id
        })

        return {"status": "success"}
Go Example
This function is an application fragment; checkInventory and processPayment are application functions. Both child spans use the parent process context, so payment is not accidentally parented by an already-ended inventory span.
import (
    "context"
    "go.opentelemetry.io/otel"
    "go.opentelemetry.io/otel/attribute"
    "go.opentelemetry.io/otel/codes"
)

func processOrder(ctx context.Context, orderID string) error {
    tracer := otel.Tracer("order-service")

    ctx, span := tracer.Start(ctx, "process-order")
    defer span.End()

    span.SetAttributes(
        attribute.String("order.id", orderID),
        attribute.Float64("order.amount", 99.99),
    )

    // Check inventory
    inventoryCtx, inventorySpan := tracer.Start(ctx, "check-inventory")
    inventory, err := checkInventory(inventoryCtx, orderID)
    if err != nil {
        inventorySpan.RecordError(err)
        inventorySpan.SetStatus(codes.Error, err.Error())
        inventorySpan.End()
        return err
    }
    inventorySpan.SetAttributes(attribute.Bool("inventory.available", inventory))
    inventorySpan.End()

    // Process payment
    paymentCtx, paymentSpan := tracer.Start(ctx, "process-payment")
    err = processPayment(paymentCtx, orderID)
    if err != nil {
        paymentSpan.RecordError(err)
        paymentSpan.SetStatus(codes.Error, err.Error())
        paymentSpan.End()
        return err
    }
    paymentSpan.SetAttributes(attribute.String("payment.status", "success"))
    paymentSpan.End()

    // Record event
    span.AddEvent("Order processed successfully")

    return nil
}
Performance Optimization
Trace Data Size Optimization
Use the provider maxTagLength and Telemetry custom tags already shown. Limit attributes/events at the SDK/collector where appropriate; truncating a path does not redact secrets in a URL or tag. Store only required attributes and use route templates instead of raw identifiers where possible.
Collector Performance Tuning
processors:
  batch:
    timeout: 10s
    send_batch_size: 1024
    send_batch_max_size: 2048

  memory_limiter:
    check_interval: 1s
    limit_mib: 1024
    spike_limit_mib: 256
Storage Optimization
For the persistent Jaeger deployment, configure a retention policy for the actual production index prefix and chosen rotation mode. Size shards/replicas for measured ingest and query load. Use Jaeger's version-compatible index initialization and Elasticsearch ILM (or the storage backend's lifecycle mechanism), and verify backups and query lookback before expiring data. Seven days is an example retention decision, not a universal default.
The old standalone Curator recipe did not match the configured index prefix and omitted storage credentials/TLS and rotation prerequisites. Follow the Jaeger 2.20 storage lifecycle procedure and released schema; do not run broad index deletion commands as a tracing diagnostic.
Troubleshooting
Missing Traces
Check the effective HTTP connection-manager tracing configuration and the provider cluster, then distinguish reception, export and backend storage. A .bootstrap.tracing check alone misses dynamically configured tracing. Use these read-only checks:
istioctl proxy-config listeners <pod-name> -n <namespace> -o json | \
  jq '.. | objects | select(has("tracing")) | .tracing'
istioctl proxy-config clusters <pod-name> -n <namespace> \
  --fqdn otel-collector.observability.svc.cluster.local
kubectl logs -n observability deployment/otel-collector --tail=100
kubectl logs -n observability deployment/jaeger --tail=100
# Keep this running; use a second terminal for the curl command below.
kubectl port-forward -n observability svc/otel-collector 8888:8888curl -fsS http://localhost:8888/metrics | \
rg 'otelcol_(receiver_accepted|exporter_sent|exporter_send_failed)_spans'Accepted spans do not prove export or durable storage. Inspect exporter errors, backend connectivity/authentication and stored trace IDs. Tail sampling and memory storage intentionally reduce retained data. Metric suffixes can vary with the collector telemetry configuration.
Broken Context Propagation
Use a fresh test trace ID for each independent request and inspect application/server spans in the backend. The application must inject the active child context when making a new outbound call. Check that W3C/B3 formats match the configured provider and SDK propagators, and that instrumentation starts before the HTTP libraries are loaded. Proxy log level changes do not enable access logging; configure a Telemetry access-log provider explicitly when needed.
Unexpected Sampling
kubectl get telemetry -A
kubectl describe telemetry <name> -n <namespace>
istioctl analyze -n <namespace>
istioctl proxy-config listeners <pod-name> -n <namespace> -o json | \
  jq '.. | objects | select(has("tracing")) | .tracing'
Review root/namespace/workload policy inheritance, upstream sampled flags, SDK sampler and collector policy together. A collector cannot reconstruct a trace discarded by head sampling.