Linkerd Observability
Last Updated: September 11, 2026 · Linkerd edge-26.9.1 / charts 2026.9.1 · Prometheus Operator examples checked against 0.93.1
Linkerd exposes proxy and protocol metrics; Viz adds Prometheus, metrics-api, tap, tap-injector and the web dashboard. The current Viz chart does not install Grafana. Distributed tracing additionally needs a configured collector/backend, trace context and sampling; it is not enabled by installing a metrics dashboard.
The examples assume the installation guide, existing meshed web/api workloads and actual traffic in my-app. Configure the correct namespace, workload/Service names, ports and identities for your installation. An opaque TCP database does not automatically produce HTTP success/latency measurements.
Metric Meaning
| Metric | Meaning |
|---|---|
| response_total | Final response classifications, including error/end-of-stream handling |
| request_total | Observed requests; not a count of successful business operations |
| response_latency_ms_bucket | Time-to-first-byte histogram in milliseconds |
| tcp_open_connections | Currently open transport connections |
| tcp_open_total | Cumulative connections opened, not currently active connections |
The familiar service metrics are success rate, request rate and latency. Add capacity/saturation, application and Kubernetes metrics as needed. HTTP's default proxy classification treats server errors as failures; an HTTP 400 can count as success. gRPC status and configured response policies can change classification. This is not automatically a business-success SLI.
Latency is not the entire response-stream duration. The released proxy records it at the first available response-body frame, with a fallback on body drop, independently of final response classification. Histogram and response-counter observations can therefore become available at different times. Do not apply success/failure classification labels to a histogram that does not expose them.
CLI statistics and live inspection
linkerd viz stat deploy -n my-app
linkerd viz stat deploy/web -n my-app --to deploy/api
linkerd viz stat deploy/api -n my-app --from deploy/web
linkerd viz stat pods -n my-app
linkerd viz stat namespaces
linkerd viz stat deploy -n my-app --time-window 10m -o wide
linkerd viz stat deploy -n my-app -o json
The table includes MESHED, SUCCESS, RPS, latency percentiles and TCP_CONN. Wide output adds transport byte rates; it is not a proxy-version inventory. Pod/deployment views and Service views have different observation points: Service statistics use outbound client metrics and omit unmeshed callers. Keep that distinction when comparing totals.
linkerd viz top deploy/web -n my-app --hide-sources=false
linkerd viz tap deploy/web -n my-app --method GET --path /api
linkerd viz tap deploy/web -n my-app --to deploy/api --max-rps 20
linkerd viz tap deploy/web -n my-app -o json
linkerd viz edges deploy -n my-app
linkerd viz edges pods -n my-app
top summarizes tapped live traffic. --hide-sources=false displays the source column, not HTTP headers. tap --path is a path-prefix filter; --max-rps limits the tapped request rate, not the total number of application requests. Current tap has neither --from nor --show-headers. Tap the source workload with --to or use supported statistics filters.
Tap is a sampled/limited observation stream, not packet capture or a complete audit. Restrict access to its API because paths and request metadata can be sensitive. Edges show observed connections; an empty view is not proof of no traffic or universal encryption.
Viz Dashboard and Storage
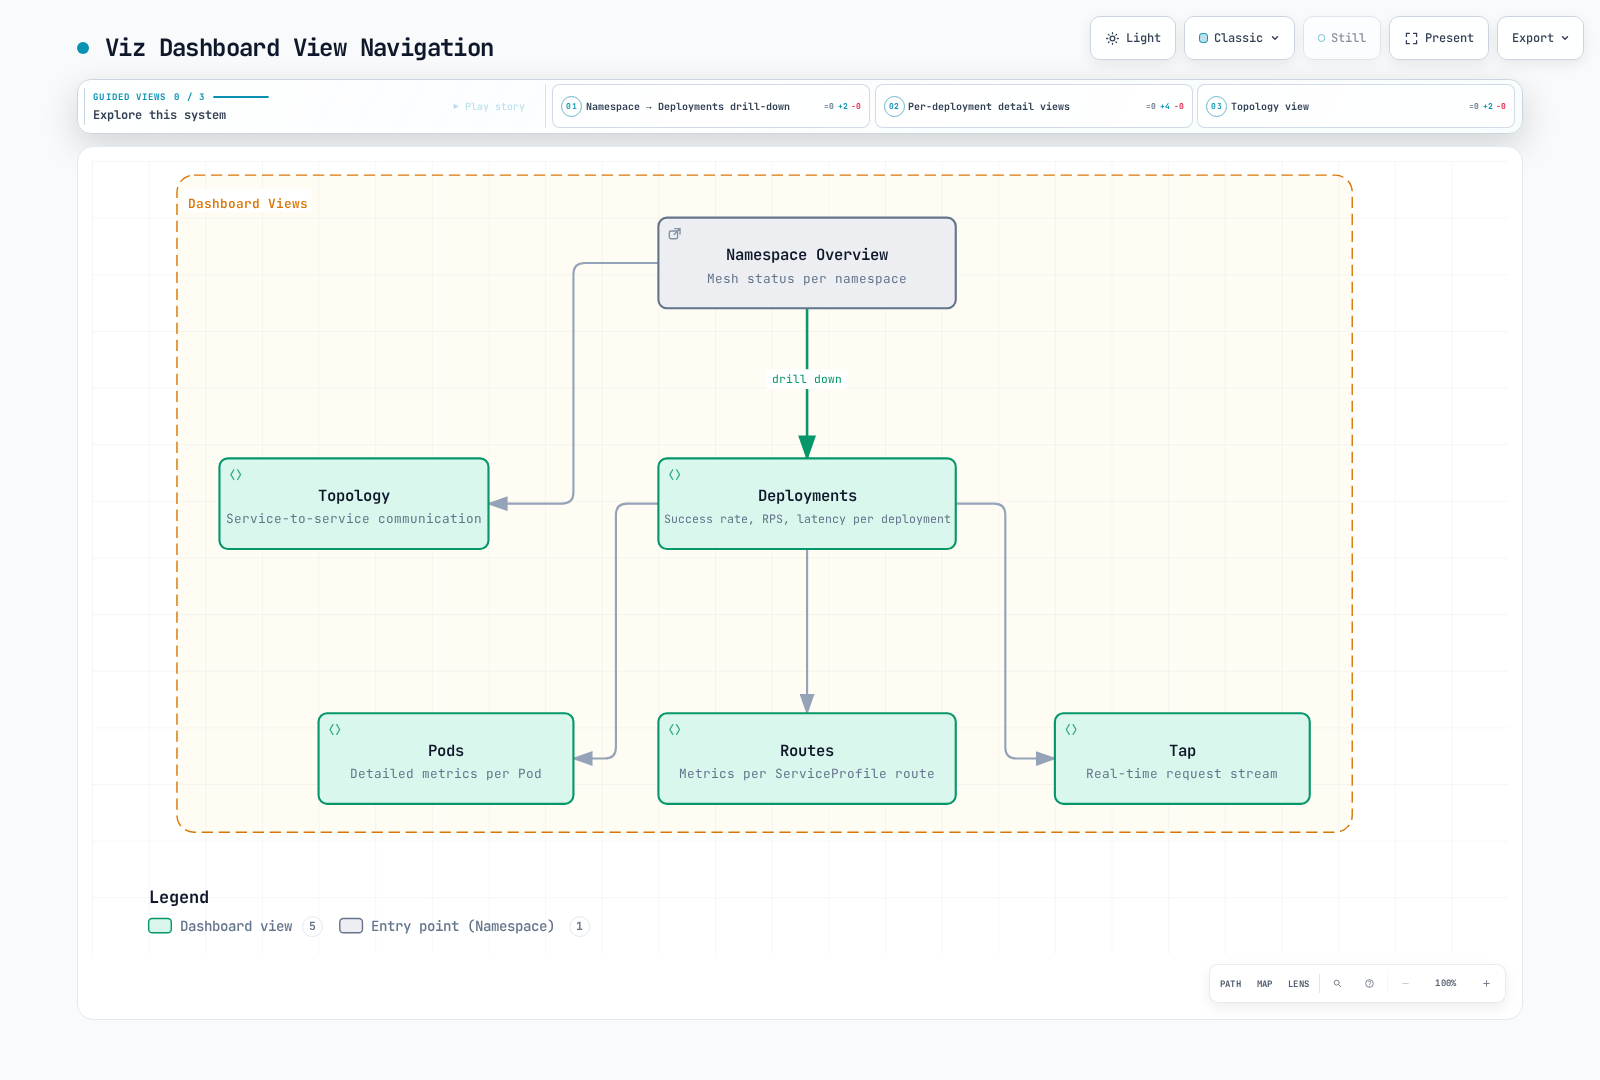
linkerd viz dashboard --address 127.0.0.1 --port 8084 --show urlOpen the displayed local URL. Keep this local access path bound to loopback; an externally published dashboard needs its own authentication and access design. A bind address or Host-header check is not user authentication.
The default bundled Prometheus retains six hours and uses transient storage. The selected chart pins its own Prometheus image; do not silently substitute a new major version. Persistence is configurable as described in the installation guide, and long-term/HA storage is a separate design.
kubectl -n linkerd-viz port-forward --address 127.0.0.1 svc/prometheus 9090:9090
# In another terminal:
curl --fail --get --data-urlencode 'query=up{job="linkerd-proxy"}' \
  http://127.0.0.1:9090/api/v1/query
External Prometheus
Choose direct scraping, federation or an appropriate remote-write pipeline deliberately. Collecting the same series through several paths without deduplication can double count results.
Direct scrape configuration
Merge this under the existing Prometheus configuration. It follows the selected Viz chart's jobs/label mapping, with explicit namespace/Pod labels added to controller targets:
scrape_configs:
- job_name: linkerd-controller
  kubernetes_sd_configs:
  - role: pod
    namespaces:
      names:
      - linkerd
      - linkerd-viz
  relabel_configs:
  - source_labels:
    - __meta_kubernetes_pod_container_port_name
    action: keep
    regex: .*admin$
  - source_labels:
    - __meta_kubernetes_pod_container_port_name
    action: drop
    regex: linkerd-admin
  - source_labels:
    - __meta_kubernetes_pod_container_name
    action: replace
    target_label: component
  - source_labels:
    - __meta_kubernetes_namespace
    target_label: namespace
  - source_labels:
    - __meta_kubernetes_pod_name
    target_label: pod
- job_name: linkerd-proxy
  kubernetes_sd_configs:
  - role: pod
  relabel_configs:
  - source_labels:
    - __meta_kubernetes_pod_phase
    regex: (Pending|Running)
    action: keep
  - source_labels:
    - __meta_kubernetes_pod_container_name
    - __meta_kubernetes_pod_container_port_name
    - __meta_kubernetes_pod_label_linkerd_io_control_plane_ns
    action: keep
    regex: ^linkerd-proxy;linkerd-admin;linkerd$
  - source_labels:
    - __meta_kubernetes_namespace
    action: replace
    target_label: namespace
  - source_labels:
    - __meta_kubernetes_pod_name
    action: replace
    target_label: pod
  - source_labels:
    - __meta_kubernetes_pod_label_linkerd_io_proxy_job
    action: replace
    target_label: k8s_job
  - action: labeldrop
    regex: __meta_kubernetes_pod_label_linkerd_io_proxy_job
  - action: labelmap
    regex: __meta_kubernetes_pod_label_linkerd_io_proxy_(.+)
  - action: labeldrop
    regex: __meta_kubernetes_pod_label_linkerd_io_proxy_(.+)
  - action: labelmap
    regex: __meta_kubernetes_pod_label_linkerd_io_(.+)
  - action: labelmap
    regex: __meta_kubernetes_pod_label_(.+)
    replacement: __tmp_pod_label_$1
  - action: labelmap
    regex: __tmp_pod_label_linkerd_io_(.+)
    replacement: __tmp_pod_label_$1
  - action: labeldrop
    regex: __tmp_pod_label_linkerd_io_(.+)
  - action: labelmap
    regex: __tmp_pod_label_(.+)
The old admin-http controller-port filter missed current ports such as dest-admin and ident-admin. The proxy filter retains the named linkerd-proxy/linkerd-admin target for the intended control plane. Kubernetes Pod discovery includes init containers, so do not drop targets solely because __meta_kubernetes_pod_container_init is true: the default native sidecar lives there.
These labels support the shown workload queries. Preserve the labels required by any additional Viz queries and dashboards; review mapped application labels for cardinality and sensitive data. Configure Kubernetes discovery RBAC, API access and reachability to metrics ports. A valid YAML file does not prove successful discovery or scraping.
Prometheus Operator alternatives
The Prometheus resource must select both these monitors and their namespace. The example metadata assumes its selector accepts release: monitoring; adapt that label to the actual installation.
apiVersion: monitoring.coreos.com/v1
kind: PodMonitor
metadata:
  name: linkerd-proxies
  namespace: monitoring
  labels:
    release: monitoring
spec:
  namespaceSelector:
    any: true
  selector:
    matchLabels:
      linkerd.io/control-plane-ns: linkerd
  podMetricsEndpoints:
  - port: linkerd-admin
    path: /metrics
    interval: 10s
    relabelings:
    - sourceLabels:
      - __meta_kubernetes_pod_phase
      regex: (Pending|Running)
      action: keep
    - sourceLabels:
      - __meta_kubernetes_pod_container_name
      - __meta_kubernetes_pod_container_port_name
      - __meta_kubernetes_pod_label_linkerd_io_control_plane_ns
      action: keep
      regex: ^linkerd-proxy;linkerd-admin;linkerd$
    - sourceLabels:
      - __meta_kubernetes_namespace
      action: replace
      targetLabel: namespace
    - sourceLabels:
      - __meta_kubernetes_pod_name
      action: replace
      targetLabel: pod
    - sourceLabels:
      - __meta_kubernetes_pod_label_linkerd_io_proxy_job
      action: replace
      targetLabel: k8s_job
    - action: labeldrop
      regex: __meta_kubernetes_pod_label_linkerd_io_proxy_job
    - action: labelmap
      regex: __meta_kubernetes_pod_label_linkerd_io_proxy_(.+)
    - action: labeldrop
      regex: __meta_kubernetes_pod_label_linkerd_io_proxy_(.+)
    - action: labelmap
      regex: __meta_kubernetes_pod_label_linkerd_io_(.+)
    - action: labelmap
      regex: __meta_kubernetes_pod_label_(.+)
      replacement: __tmp_pod_label_$1
    - action: labelmap
      regex: __tmp_pod_label_linkerd_io_(.+)
      replacement: __tmp_pod_label_$1
    - action: labeldrop
      regex: __tmp_pod_label_linkerd_io_(.+)
    - action: labelmap
      regex: __tmp_pod_label_(.+)
    - targetLabel: job
      replacement: linkerd-proxy
---
apiVersion: monitoring.coreos.com/v1
kind: PodMonitor
metadata:
  name: linkerd-destination
  namespace: monitoring
  labels:
    release: monitoring
spec:
  namespaceSelector:
    matchNames:
    - linkerd
  selector:
    matchLabels:
      linkerd.io/control-plane-component: destination
  podMetricsEndpoints:
  - port: dest-admin
    path: /metrics
    interval: 10s
    relabelings:
    - sourceLabels:
      - __meta_kubernetes_pod_container_name
      targetLabel: component
    - targetLabel: job
      replacement: linkerd-controller
  - port: spval-admin
    path: /metrics
    interval: 10s
    relabelings:
    - sourceLabels:
      - __meta_kubernetes_pod_container_name
      targetLabel: component
    - targetLabel: job
      replacement: linkerd-controller
  - port: policy-admin
    path: /metrics
    interval: 10s
    relabelings:
    - sourceLabels:
      - __meta_kubernetes_pod_container_name
      targetLabel: component
    - targetLabel: job
      replacement: linkerd-controller
The second PodMonitor covers the three metrics endpoints in the destination Deployment. It is not every controller. For other components, use their actual declared ports:
| Component | Named metrics port |
|---|---|
| Identity | ident-admin |
| Proxy injector | injector-admin |
| Viz components | admin |
The destination Service does not expose an admin-http Service port, so a ServiceMonitor selecting that nonexistent port discovers no such endpoint. Use PodMonitors for declared container ports or deliberately provision an appropriate Service. Do not configure duplicate raw scrapes and PodMonitors for the same targets.
Federation is another option. For the selected Viz chart, Prometheus's Service port is named admin, and the endpoint is /federate. Preserve exported labels, select the intended jobs and authorize the calling meshed ServiceAccount against Viz's prometheus-admin Server. A generic upstream example naming admin-http does not match this chart.
Let Viz query an existing Prometheus
For a separately configured and reachable Prometheus retaining the required Linkerd data:
prometheus:
  enabled: false
prometheusUrl: http://prometheus.monitoring.svc.cluster.local:9090
Merge these values into the selected Viz release's complete configuration. Verify query API behavior, scrape labels, retention, authentication and authorization before disabling its local Prometheus. This URL does not install Prometheus or grant access.
Queries with Explicit Scope
These queries select inbound API observations once. Adapt namespace/deployment and add cluster scope for a shared backend.
Success ratio:
((sum(rate(response_total{namespace="my-app",deployment="api",direction="inbound",classification="success"}[5m])) or vector(0)) / sum(rate(response_total{namespace="my-app",deployment="api",direction="inbound"}[5m])))
and on() (sum(rate(response_total{namespace="my-app",deployment="api",direction="inbound"}[5m])) > 0)
The numerator falls back to zero when all observed responses failed and no success series exists. The positive-total condition leaves missing/idle traffic without a success result; it does not display missing data as 100%.
Request rate:
sum(rate(request_total{namespace="my-app",deployment="api",direction="inbound"}[5m]))Time-to-first-byte percentiles, in milliseconds:
histogram_quantile(0.5, sum by (le) (rate(response_latency_ms_bucket{namespace="my-app",deployment="api",direction="inbound"}[5m])))

histogram_quantile(0.95, sum by (le) (rate(response_latency_ms_bucket{namespace="my-app",deployment="api",direction="inbound"}[5m])))

histogram_quantile(0.99, sum by (le) (rate(response_latency_ms_bucket{namespace="my-app",deployment="api",direction="inbound"}[5m])))
Inbound source-side active TCP connections:
sum(tcp_open_connections{namespace="my-app",deployment="api",direction="inbound",peer="src"})peer="src" avoids including the proxy's separate local application connection in that count. For opened connections per second, apply rate to tcp_open_total with the same intended observation scope.
There is no generic retry="true" label on request_total. For ServiceProfiles, inspect route_actual_request_total, route_request_total and route_retryable_total with matching scope and window. Retryable responses are not the same as retries actually sent; the no-budget series is a subset. Current policy metrics and application attempt evidence need their own interpretation. See traffic management.
Grafana
Grafana has been a separate installation since Linkerd 2.12. There is no bundled svc/grafana to port-forward in a default current Viz installation, and grafana.enabled:false does not configure the supported integration.
Use an existing Grafana with a Prometheus datasource containing the required metrics. For a meshed Grafana running as ServiceAccount grafana in namespace monitoring, this permits access to the existing Viz Prometheus:
apiVersion: policy.linkerd.io/v1alpha1
kind: AuthorizationPolicy
metadata:
  name: prometheus-admin-grafana
  namespace: linkerd-viz
spec:
  targetRef:
    group: policy.linkerd.io
    kind: Server
    name: prometheus-admin
  requiredAuthenticationRefs:
  - kind: ServiceAccount
    name: grafana
    namespace: monitoring
If Grafana uses a different identity or an external Prometheus, configure the appropriate access there. A ServiceAccount grant requires the caller to actually present that mesh identity.
To link Viz to an externally accessible Grafana:
grafana:
  externalUrl: https://grafana.example.com/
The supported alternatives are grafana.externalUrl for a browser-facing full URL and grafana.url for the in-cluster reverse-proxy integration. The latter also requires Grafana's root/subpath configuration. grafana.uidPrefix distinguishes imported dashboard UIDs; it is not a tenant-authorization control.
The released dashboard collection includes health, top-line, namespace/workload, Service, route, authority and multicluster views. Authority means HTTP host/:authority, not authorization permissions. Import dashboards from a reviewed release and verify their datasource, labels, units and UID links.
Small dashboard example
This classic dashboard JSON includes a datasource import input, constant namespace/deployment variables and panel units. Select your datasource and adjust the constants on import. Queries and JSON were checked; no Grafana-server import was executed.
{
  "__inputs": [
    {
      "name": "DS_PROMETHEUS",
      "label": "Prometheus",
      "type": "datasource",
      "pluginId": "prometheus",
      "pluginName": "Prometheus"
    }
  ],
  "id": null,
  "uid": "linkerd-api-overview",
  "title": "Linkerd API Overview",
  "schemaVersion": 39,
  "version": 1,
  "time": {
    "from": "now-1h",
    "to": "now"
  },
  "templating": {
    "list": [
      {
        "name": "namespace",
        "type": "constant",
        "query": "my-app",
        "current": {
          "text": "my-app",
          "value": "my-app"
        }
      },
      {
        "name": "deployment",
        "type": "constant",
        "query": "api",
        "current": {
          "text": "api",
          "value": "api"
        }
      }
    ]
  },
  "panels": [
    {
      "id": 1,
      "title": "Proxy-classified Success Rate",
      "type": "gauge",
      "datasource": {
        "type": "prometheus",
        "uid": "${DS_PROMETHEUS}"
      },
      "gridPos": {
        "x": 0,
        "y": 0,
        "w": 8,
        "h": 8
      },
      "fieldConfig": {
        "defaults": {
          "unit": "percent"
        },
        "overrides": []
      },
      "targets": [
        {
          "refId": "A",
          "datasource": {
            "type": "prometheus",
            "uid": "${DS_PROMETHEUS}"
          },
          "expr": "100 * (((sum(rate(response_total{namespace=\"$namespace\",deployment=\"$deployment\",direction=\"inbound\",classification=\"success\"}[5m])) or vector(0)) / sum(rate(response_total{namespace=\"$namespace\",deployment=\"$deployment\",direction=\"inbound\"}[5m])))\nand on() (sum(rate(response_total{namespace=\"$namespace\",deployment=\"$deployment\",direction=\"inbound\"}[5m])) > 0))",
          "legendFormat": "success"
        }
      ]
    },
    {
      "id": 2,
      "title": "Request Rate",
      "type": "timeseries",
      "datasource": {
        "type": "prometheus",
        "uid": "${DS_PROMETHEUS}"
      },
      "gridPos": {
        "x": 8,
        "y": 0,
        "w": 8,
        "h": 8
      },
      "fieldConfig": {
        "defaults": {
          "unit": "reqps"
        },
        "overrides": []
      },
      "targets": [
        {
          "refId": "A",
          "datasource": {
            "type": "prometheus",
            "uid": "${DS_PROMETHEUS}"
          },
          "expr": "sum(rate(request_total{namespace=\"$namespace\",deployment=\"$deployment\",direction=\"inbound\"}[5m]))",
          "legendFormat": "requests/s"
        }
      ]
    },
    {
      "id": 3,
      "title": "Time to First Byte",
      "type": "timeseries",
      "datasource": {
        "type": "prometheus",
        "uid": "${DS_PROMETHEUS}"
      },
      "gridPos": {
        "x": 16,
        "y": 0,
        "w": 8,
        "h": 8
      },
      "fieldConfig": {
        "defaults": {
          "unit": "ms"
        },
        "overrides": []
      },
      "targets": [
        {
          "refId": "A",
          "datasource": {
            "type": "prometheus",
            "uid": "${DS_PROMETHEUS}"
          },
          "expr": "histogram_quantile(0.5, sum by (le) (rate(response_latency_ms_bucket{namespace=\"$namespace\",deployment=\"$deployment\",direction=\"inbound\"}[5m])))",
          "legendFormat": "p50"
        },
        {
          "refId": "B",
          "datasource": {
            "type": "prometheus",
            "uid": "${DS_PROMETHEUS}"
          },
          "expr": "histogram_quantile(0.95, sum by (le) (rate(response_latency_ms_bucket{namespace=\"$namespace\",deployment=\"$deployment\",direction=\"inbound\"}[5m])))",
          "legendFormat": "p95"
        },
        {
          "refId": "C",
          "datasource": {
            "type": "prometheus",
            "uid": "${DS_PROMETHEUS}"
          },
          "expr": "histogram_quantile(0.99, sum by (le) (rate(response_latency_ms_bucket{namespace=\"$namespace\",deployment=\"$deployment\",direction=\"inbound\"}[5m])))",
          "legendFormat": "p99"
        }
      ]
    }
  ]
}
Distributed Tracing
The Linkerd-Jaeger extension was removed in Linkerd 2.19. Current tracing uses a separately managed OpenTelemetry-compatible collector/backend; the old linkerd jaeger commands, extension webhook address and arbitrary linkerd-jaeger-config ConfigMap do not set it up.
For an existing meshed OTLP/gRPC collector at port 4317, running as ServiceAccount collector in namespace tracing, merge these values into the complete Linkerd configuration:
proxy:
  tracing:
    enabled: true
    collector:
      endpoint: collector.tracing.svc.cluster.local:4317
      meshIdentity:
        serviceAccountName: collector
        namespace: tracing
The selected chart requires the collector endpoint and both meshIdentity fields, and derives the expected collector DNS identity from them. Merely running an OTLP receiver outside the mesh does not satisfy this configuration. Verify its Service port, receiving pipeline, network/authorization access, storage and sampled spans. Update workloads through the installation's owner so their proxies receive the tracing configuration.
Linkerd participates in W3C trace context and B3 traces; when both appear, W3C takes precedence. x-request-id is a correlation ID, not a required trace-context format. An ingress/application or test generator must establish context and sampling, and applications must propagate context across their own calls.
Application propagation examples
Prefer an appropriate OpenTelemetry library for validated extraction, child-span creation, sampling and export. These small GET adapters only pass W3C context through; they do not create application spans, validate user identity or provide a general reverse proxy. Configure the backend URL from trusted deployment settings.
Python (Flask 3.1.3 / Requests 2.32.5 used for the local check):
from flask import Flask, Response, request
import requests

app = Flask(__name__)
BACKEND_URL = "http://backend-service/api/backend"  # Trusted configuration.
MAX_RESPONSE_BYTES = 1024 * 1024
app.config["DOWNSTREAM_TIMEOUT"] = (2, 5)  # Connect/read inactivity, not total time.


@app.get("/api/data")
def get_data():
    headers = {}
    if request.headers.get("traceparent"):
        for name in ("traceparent", "tracestate"):
            if request.headers.get(name):
                headers[name] = request.headers[name]
    try:
        with requests.get(
            BACKEND_URL,
            headers=headers,
            timeout=app.config["DOWNSTREAM_TIMEOUT"],
            allow_redirects=False,
            stream=True,
        ) as upstream:
            # This small API adapter does not follow or relay redirects.
            if 300 <= upstream.status_code < 400:
                return Response("Unexpected upstream redirect\n", status=502)
            body = bytearray()
            for chunk in upstream.iter_content(chunk_size=16384):
                body.extend(chunk)
                if len(body) > MAX_RESPONSE_BYTES:
                    return Response("Upstream response too large\n", status=502)
            return Response(
                bytes(body),
                status=upstream.status_code,
                content_type=upstream.headers.get(
                    "Content-Type", "application/octet-stream"
                ),
            )
    except requests.Timeout:
        return Response("Upstream timeout\n", status=504)
    except requests.RequestException:
        return Response("Upstream request failed\n", status=502)
The connect/read timeout bounds connection waiting and read inactivity, not total end-to-end duration. A continuously trickling response or caller cancellation requires an application/server deadline design beyond this synchronous example. The response buffer is capped and redirects are rejected explicitly.
Go handler for an existing HTTP server:
package main

import (
	"errors"
	"io"
	"net"
	"net/http"
	"time"
)

var backendURL = "http://backend-service/api/backend" // Trusted configuration.
var downstreamClient = &http.Client{
	Timeout: 5 * time.Second,
	CheckRedirect: func(req *http.Request, via []*http.Request) error {
		return http.ErrUseLastResponse
	},
}

const maxResponseBytes = 1024 * 1024

func handler(w http.ResponseWriter, r *http.Request) {
	if r.Method != http.MethodGet {
		w.Header().Set("Allow", http.MethodGet)
		http.Error(w, "Method not allowed", http.StatusMethodNotAllowed)
		return
	}
	req, err := http.NewRequestWithContext(r.Context(), http.MethodGet, backendURL, nil)
	if err != nil {
		http.Error(w, "Invalid backend configuration", http.StatusInternalServerError)
		return
	}
	if r.Header.Get("traceparent") != "" {
		for _, name := range []string{"traceparent", "tracestate"} {
			if value := r.Header.Get(name); value != "" {
				req.Header.Set(name, value)
			}
		}
	}
	resp, err := downstreamClient.Do(req)
	if err != nil {
		status := http.StatusBadGateway
		var networkError net.Error
		if errors.As(err, &networkError) && networkError.Timeout() {
			status = http.StatusGatewayTimeout
		}
		http.Error(w, "Upstream request failed", status)
		return
	}
	defer resp.Body.Close()
	if resp.StatusCode >= 300 && resp.StatusCode < 400 {
		http.Error(w, "Unexpected upstream redirect", http.StatusBadGateway)
		return
	}
	body, err := io.ReadAll(io.LimitReader(resp.Body, maxResponseBytes+1))
	if err != nil || len(body) > maxResponseBytes {
		http.Error(w, "Invalid or oversized upstream response", http.StatusBadGateway)
		return
	}
	contentType := resp.Header.Get("Content-Type")
	if contentType == "" {
		contentType = "application/octet-stream"
	}
	w.Header().Set("Content-Type", contentType)
	w.WriteHeader(resp.StatusCode)
	_, _ = w.Write(body)
}
This propagates request cancellation, bounds the client call, checks errors before using a response and forwards the backend status/body. Both examples intentionally reject redirects and oversized responses. Local tests exercise these paths; they do not demonstrate production tracing, ingestion, sampling or load behavior.
Confirm a known sampled trace reaches the backend with the expected proxy/application spans. A trace dashboard opening successfully does not prove context propagation, correct sampling or complete traces.
Diagnostic and Access Logs
Proxy diagnostic log level/format and HTTP access logging are separate settings. Save this merge patch for an existing meshed Deployment as proxy-logging-patch.yaml; it is not a standalone Deployment manifest:
spec:
  template:
    metadata:
      labels:
        mesh-required: 'true'
      annotations:
        config.linkerd.io/access-log: json
        config.linkerd.io/proxy-log-format: json
config.linkerd.io/proxy-log-level: warn,linkerd=info# This changes the existing workload's Pod template and triggers its rollout.
kubectl -n my-app patch deployment/api --type merge --patch-file proxy-logging-patch.yaml
kubectl -n my-app rollout status deployment/api --timeout=5m
kubectl -n my-app logs deployment/api -c linkerd-proxy --tail=100config.linkerd.io/access-log:json enables HTTP access records. proxy-log-format:json only changes diagnostic formatting. Avoid indiscriminate debug/trace or header logging; scope diagnostic collection and data handling to the investigation. These settings do not make opaque TCP traffic an HTTP request log.
The mesh-required:true Pod label marks the workload as intentionally requiring a healthy proxy for the alert below; it does not perform injection. Enrollment still follows the installation/namespace policy.
ServiceProfile and Policy Route Metrics
ServiceProfiles remain supported for compatibility. Adding one can supersede current outbound HTTPRoute reliability settings for that Service; do not add a conflicting profile solely to make a dashboard look populated.
For a separate legacy-metrics exercise against an existing api-service, this profile adds route names without enabling retries:
apiVersion: linkerd.io/v1alpha2
kind: ServiceProfile
metadata:
  name: api-service.my-app.svc.cluster.local
  namespace: my-app
spec:
  routes:
  - name: GET /api/users
    condition:
      all:
      - method: GET
      - pathRegex: ^/api/users$
    isRetryable: false
  - name: POST /api/orders
    condition:
      all:
      - method: POST
      - pathRegex: ^/api/orders$
    isRetryable: false
  - name: GET /health
    condition:
      all:
      - method: GET
      - pathRegex: ^/health$
    isRetryable: false
Explicit all conditions make method/path matching clear. Profile routes, HTTPRoute policy metrics and arbitrary application paths are different views:
linkerd viz routes service/api-service -n my-app
linkerd viz routes deploy/web -n my-app --to svc/api-service --time-window 10m
linkerd viz stat httproute/api-inbound -n my-app
linkerd viz authz deploy/api -n my-app
The HTTPRoute example assumes an existing Server-attached inbound route. viz routes is the ServiceProfile view; it is not a universal list of every Gateway API route.
For outbound calls from web, preserve both destination and route labels when aggregating:
(sum by (dst, rt_route) (rate(route_response_total{namespace="my-app",deployment="web",direction="outbound",classification="success"}[5m]))
 or on(dst, rt_route) (0 * sum by (dst, rt_route) (rate(route_response_total{namespace="my-app",deployment="web",direction="outbound"}[5m])))) / sum by (dst, rt_route) (rate(route_response_total{namespace="my-app",deployment="web",direction="outbound"}[5m]))
and on(dst, rt_route) (sum by (dst, rt_route) (rate(route_response_total{namespace="my-app",deployment="web",direction="outbound"}[5m])) > 0)histogram_quantile(0.99, sum by (le, dst, rt_route) (rate(route_response_latency_ms_bucket{namespace="my-app",deployment="web",direction="outbound"}[5m])))sum by (dst, rt_route) (rate(route_request_total{namespace="my-app",deployment="web",direction="outbound"}[5m]))The aligned zero numerator preserves an all-failure route instead of dropping it. Grouping only by route name could combine unrelated Services with the same route label.
Alerts and Investigation
The following PrometheusRule assumes its selector labels are accepted, the shown Linkerd jobs are scraped, and kube-state-metrics exposes Pod labels plus both regular/init-container running metrics. Enable the mesh-required Pod label in its metric-labels allowlist; otherwise the intended-Pod selector has no data.
apiVersion: monitoring.coreos.com/v1
kind: PrometheusRule
metadata:
  name: linkerd-alerts
  namespace: monitoring
  labels:
    release: monitoring
spec:
  groups:
  - name: linkerd
    rules:
    - alert: LinkerdAPIHighErrorRate
      expr: |-
        (((sum(rate(response_total{namespace="my-app",deployment="api",direction="inbound",classification="failure"}[5m])) or vector(0)) / sum(rate(response_total{namespace="my-app",deployment="api",direction="inbound"}[5m])))
        and on() (sum(rate(response_total{namespace="my-app",deployment="api",direction="inbound"}[5m])) > 0)) > 0.05
      for: 5m
      labels:
        severity: warning
      annotations:
        summary: API proxy-classified response error ratio exceeds 5%
    - alert: LinkerdAPIHighTTFB
      expr: histogram_quantile(0.99, sum by (le) (rate(response_latency_ms_bucket{namespace="my-app",deployment="api",direction="inbound"}[5m])))
        > 1000
      for: 5m
      labels:
        severity: warning
      annotations:
        summary: API p99 time-to-first-byte exceeds 1000ms
    - alert: LinkerdExpectedProxyNotRunning
      expr: |-
        max by (namespace, pod) (
          (kube_pod_status_phase{namespace="my-app",phase="Running"} == 1)
          and on(namespace, pod) kube_pod_labels{namespace="my-app",label_mesh_required="true"}
        )
        unless on(namespace, pod) max by (namespace, pod) (
          (kube_pod_container_status_running{namespace="my-app",container="linkerd-proxy"} == 1)
          or (kube_pod_init_container_status_running{namespace="my-app",container="linkerd-proxy"} == 1)
        )
      for: 10m
      labels:
        severity: warning
      annotations:
        summary: Expected proxy is not running for {{ $labels.namespace }}/{{ $labels.pod }}
    - alert: LinkerdScrapeTargetDown
      expr: up{job=~"linkerd-proxy|linkerd-controller"} == 0
      for: 5m
      labels:
        severity: warning
      annotations:
        summary: A discovered Linkerd metrics target cannot be scraped
The proxy alert checks expected running Pods without a running proxy, not merely injection presence. It handles both regular and native init sidecars and ignores Pods not marked as requiring the mesh. A missing kube-state-metrics scrape can still remove the expected inventory; monitor collection health separately.
The latency threshold is 1000ms of TTFB, not total request duration. Classification-based error thresholds must match your SLI. up == 0 detects failing discovered targets, not every target absent from discovery.
Start an investigation by validating scrape health and the selected traffic scope. Then compare workload/Service statistics, inspect relevant routes, use bounded Tap/log observations, and check identity/policy when indicated. Diagnose and fix the cause, then reproduce the request and verify recovery. A sequence of diagnostic commands alone does not resolve an incident.