VictoriaMetrics
Review baseline: VictoriaMetrics 1.151.0 · stack chart 0.92.1 Last Updated: September 12, 2026
Table of Contents
- Introduction
- Architecture Options
- Single-Node Mode
- Cluster Mode
- vmagent
- vmalert
- MetricsQL
- Helm Installation
- Long-term Storage Configuration
- Downsampling
- Performance Optimization
- Best Practices
- Troubleshooting
Introduction
VictoriaMetrics stores and queries time series, with separate tools for collection (vmagent) and rule evaluation (vmalert). It accepts Prometheus remote write and provides Prometheus-compatible query endpoints. MetricsQL intentionally differs from PromQL, so migrations must compare real queries and data rather than assume identical results or support for every Prometheus API.
This chapter reviews VictoriaMetrics 1.151.0 and victoria-metrics-k8s-stack 0.92.1. Native tests use a tiny local dataset; manifests and charts are inspected/rendered. No live EKS deployment, cloud backup, load test, or failure-recovery test is claimed.
Comparison and Measurement
| Dimension | What to compare |
|---|---|
| Deployment | Prometheus combines scraping, local TSDB and rules; VictoriaMetrics single-node storage/query and its optional agents can be deployed separately. Cluster mode splits insert/storage/select. |
| Compression and speed | Measure the same dataset, ingestion rate, churn, query range, cache state and hardware. There is no workload-independent 7× compression, 20× speed, or 70% saving guarantee. |
| Cardinality | Active series, churn, labels, query fan-out, RAM and disk determine capacity. Neither product has a universal 10M-versus-100M series boundary. |
| Retention | Prometheus's default retention is not its maximum. VictoriaMetrics retention is configurable but still consumes finite storage. |
| Query language | MetricsQL supports many familiar PromQL expressions, with documented differences in rate/increase, NaN, scalar and metric-name behavior. |
| Tenants and access | Cluster tenant IDs separate data namespaces. They do not authenticate callers; restrict access and use a reviewed authentication/authorization gateway such as vmauth. |
| Downsampling | Distinguish Enterprise storage downsampling, ingestion-time stream aggregation and recording additional derived series. |
Published benchmarks should keep their actual software versions, dataset and date. Unattributed comparison numbers are not a sizing basis.
Architecture Options
| Requirement | Design decision |
|---|---|
| A workload fits one server and operational simplicity matters | Evaluate single-node mode first with measured capacity and recovery objectives. |
| Read/write/storage must scale separately or one-server limits are reached | Evaluate cluster mode and account for query fan-out, replication cost and operational complexity. |
| Survive failures | Design independent failure domains, redundant ingestion, query routing, durable storage and tested restoration. Two processes or a replicated disk alone do not establish service HA. |
| A known ingestion volume | Convert to samples/second, active series, churn, retention and query load; 100M samples/day is not a product mode-selection threshold. |
Two independent single-node instances require deliberate write replication and query/failover handling. Do not point multiple vmsingle processes at one data directory as an HA shortcut.
Single-Node Mode
A single storage/query process simplifies operations, but does not implement every collector, alerting and HA function. Capacity depends on the measured workload.
The raw manifests and Helm profile later are alternative deployments, not a sequence to apply together. They assume namespace monitoring, Linux EC2 workers and an existing gp3 StorageClass/compatible EBS CSI setup with appropriate permissions and volume binding. EKS Auto Mode storage uses its own provisioner; do not assume the same class/driver on Auto Mode, Fargate, Windows or Hybrid Nodes. Resource numbers are illustrative. Restrict Pod endpoints to trusted clients; ClusterIP is not authentication.
StatefulSet Deployment
apiVersion: apps/v1
kind: StatefulSet
metadata:
  name: vmsingle
  namespace: monitoring
spec:
  serviceName: vmsingle
  replicas: 1
  selector:
    matchLabels:
      app: vmsingle
  template:
    metadata:
      labels:
        app: vmsingle
    spec:
      containers:
      - name: vmsingle
        image: victoriametrics/victoria-metrics:v1.151.0
        args:
        - --storageDataPath=/storage
        - --httpListenAddr=:8428
        - --retentionPeriod=1y
        - --search.latencyOffset=30s
        - --search.maxUniqueTimeseries=1000000
        - --search.maxSamplesPerQuery=1000000000
        - --memory.allowedPercent=60
        ports:
        - containerPort: 8428
          name: http
        resources:
          requests:
            cpu: 500m
            memory: 2Gi
          limits:
            cpu: 2000m
            memory: 8Gi
        volumeMounts:
        - name: storage
          mountPath: /storage
        livenessProbe:
          httpGet:
            path: /health
            port: 8428
          initialDelaySeconds: 30
          periodSeconds: 30
        readinessProbe:
          httpGet:
            path: /health
            port: 8428
          initialDelaySeconds: 5
          periodSeconds: 15
      securityContext:
        fsGroup: 65534
        runAsNonRoot: true
        runAsUser: 65534
  volumeClaimTemplates:
  - metadata:
      name: storage
    spec:
      accessModes:
      - ReadWriteOnce
      storageClassName: gp3
      resources:
        requests:
          storage: 100Gi
---
apiVersion: v1
kind: Service
metadata:
  name: vmsingle
  namespace: monitoring
spec:
  selector:
    app: vmsingle
  ports:
  - port: 8428
    targetPort: 8428
    name: http
  type: ClusterIP
Key Endpoints
| Endpoint | Description |
|---|---|
/api/v1/write | Prometheus Remote Write |
/api/v1/query | Instant query |
/api/v1/query_range | Range query |
/api/v1/series | Series metadata |
/api/v1/labels | Label list |
/api/v1/label/{name}/values | Label value list |
/vmui | Built-in UI |
/metrics | Self metrics |
Cluster Mode
Scalable cluster configuration for large-scale environments.
Architecture
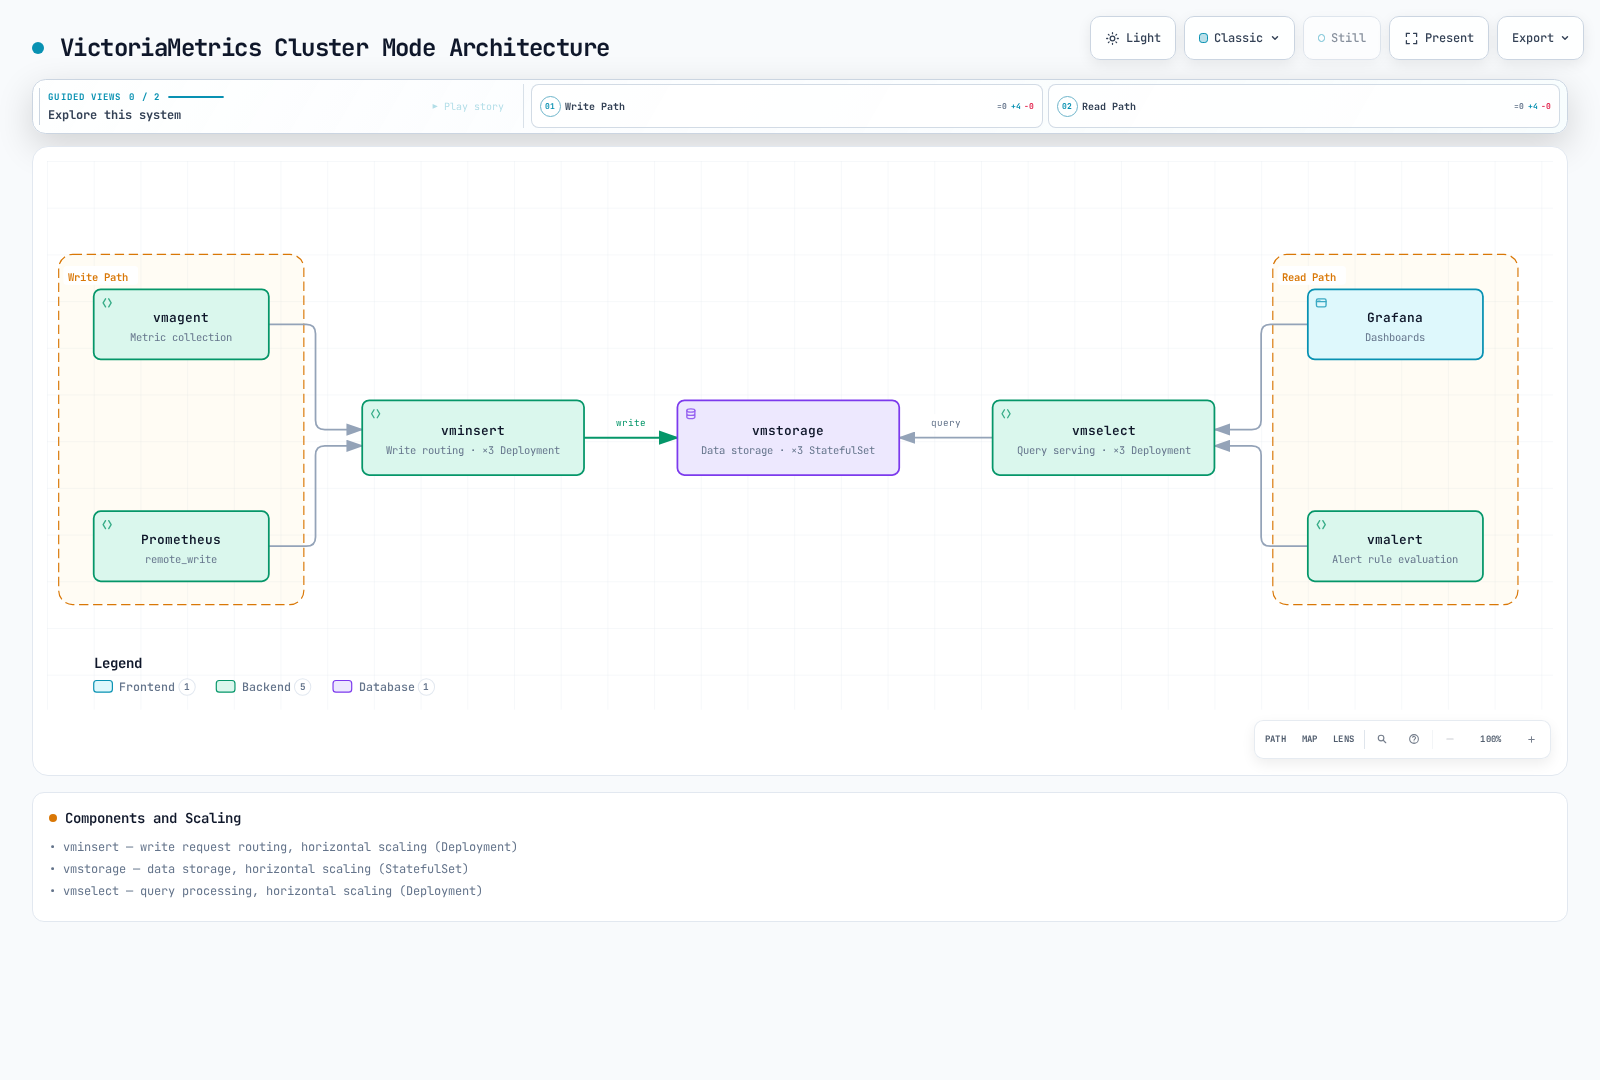
Components
| Component | Role | Scaling Method |
|---|---|---|
| vminsert | Write request routing | Horizontal scaling (Deployment) |
| vmstorage | Data storage | Horizontal scaling (StatefulSet) |
| vmselect | Query processing | Horizontal scaling (Deployment) |
The arrows show requests, not responses. The three replicas in this raw example are a topology choice, not a universal minimum or availability guarantee. Each storage member has a separate PVC; hard node anti-affinity requires at least three eligible Kubernetes nodes.
vminsert -replicationFactor=2 requests two copies. Configure vmselect consistently only if all relevant data was actually written with that replication factor; increasing the flag does not backfill old data. vmselect can return partial responses when storage is unavailable. -search.denyPartialResponse rejects responses classified as partial; a claimed replication factor still affects that classification. Degraded writes, older unreplicated data and multiple failures require separate verification.
The 1ms dedup setting handles replicated copies with the same timestamps and must agree between vmstorage and vmselect. HA scrapers at different times need a deliberate interval and identical identifying labels; a 30s interval retains one sample per discrete window and can discard legitimate higher-resolution samples. This is not a compression switch. Adding vmstorage redistributes new writes, not all historical data.
vmstorage Deployment
apiVersion: apps/v1
kind: StatefulSet
metadata:
  name: vmstorage
  namespace: monitoring
spec:
  serviceName: vmstorage
  replicas: 3
  selector:
    matchLabels:
      app: vmstorage
  template:
    metadata:
      labels:
        app: vmstorage
    spec:
      containers:
      - name: vmstorage
        image: victoriametrics/vmstorage:v1.151.0-cluster
        args:
        - --storageDataPath=/storage
        - --httpListenAddr=:8482
        - --vminsertAddr=:8400
        - --vmselectAddr=:8401
        - --retentionPeriod=1y
        - --dedup.minScrapeInterval=1ms
        ports:
        - containerPort: 8482
          name: http
        - containerPort: 8400
          name: vminsert
        - containerPort: 8401
          name: vmselect
        resources:
          requests:
            cpu: 500m
            memory: 2Gi
          limits:
            cpu: 2000m
            memory: 8Gi
        volumeMounts:
        - name: storage
          mountPath: /storage
        livenessProbe:
          httpGet:
            path: /health
            port: 8482
          initialDelaySeconds: 30
          periodSeconds: 30
      affinity:
        podAntiAffinity:
          requiredDuringSchedulingIgnoredDuringExecution:
          - labelSelector:
              matchLabels:
                app: vmstorage
            topologyKey: kubernetes.io/hostname
  volumeClaimTemplates:
  - metadata:
      name: storage
    spec:
      accessModes:
      - ReadWriteOnce
      storageClassName: gp3
      resources:
        requests:
          storage: 100Gi
---
apiVersion: v1
kind: Service
metadata:
  name: vmstorage
  namespace: monitoring
spec:
  selector:
    app: vmstorage
  clusterIP: None
  ports:
  - port: 8482
    name: http
  - port: 8400
    name: vminsert
  - port: 8401
    name: vmselect
vminsert Deployment
apiVersion: apps/v1
kind: Deployment
metadata:
  name: vminsert
  namespace: monitoring
spec:
  replicas: 3
  selector:
    matchLabels:
      app: vminsert
  template:
    metadata:
      labels:
        app: vminsert
    spec:
      containers:
      - name: vminsert
        image: victoriametrics/vminsert:v1.151.0-cluster
        args:
          - "--httpListenAddr=:8480"
          - "--storageNode=vmstorage-0.vmstorage:8400"
          - "--storageNode=vmstorage-1.vmstorage:8400"
          - "--storageNode=vmstorage-2.vmstorage:8400"
          - "--replicationFactor=2"
        ports:
        - containerPort: 8480
          name: http
        resources:
          requests:
            cpu: 200m
            memory: 256Mi
          limits:
            cpu: 1000m
            memory: 1Gi
        livenessProbe:
          httpGet:
            path: /health
            port: 8480
          initialDelaySeconds: 10
          periodSeconds: 30
---
apiVersion: v1
kind: Service
metadata:
  name: vminsert
  namespace: monitoring
spec:
  selector:
    app: vminsert
  ports:
  - port: 8480
    targetPort: 8480
    name: http
  type: ClusterIP
vmselect Deployment
apiVersion: apps/v1
kind: Deployment
metadata:
  name: vmselect
  namespace: monitoring
spec:
  replicas: 3
  selector:
    matchLabels:
      app: vmselect
  template:
    metadata:
      labels:
        app: vmselect
    spec:
      containers:
      - name: vmselect
        image: victoriametrics/vmselect:v1.151.0-cluster
        args:
        - --httpListenAddr=:8481
        - --storageNode=vmstorage-0.vmstorage:8401
        - --storageNode=vmstorage-1.vmstorage:8401
        - --storageNode=vmstorage-2.vmstorage:8401
        - --search.maxUniqueTimeseries=1000000
        - --search.maxSamplesPerQuery=1000000000
        - --replicationFactor=2
        - --dedup.minScrapeInterval=1ms
        - --search.denyPartialResponse
        ports:
        - containerPort: 8481
          name: http
        resources:
          requests:
            cpu: 200m
            memory: 512Mi
          limits:
            cpu: 1000m
            memory: 2Gi
        livenessProbe:
          httpGet:
            path: /health
            port: 8481
          initialDelaySeconds: 10
          periodSeconds: 30
---
apiVersion: v1
kind: Service
metadata:
  name: vmselect
  namespace: monitoring
spec:
  selector:
    app: vmselect
  ports:
  - port: 8481
    targetPort: 8481
    name: http
  type: ClusterIP
vmagent
vmagent is a lightweight agent for metric collection and forwarding.
Key Features
- Compatible with Prometheus scrape configuration
- Supports multiple Remote Write targets
- Data buffering and retransmission
- Low resource usage
- Label rewriting and filtering
Deployment
apiVersion: apps/v1
kind: Deployment
metadata:
  name: vmagent
  namespace: monitoring
spec:
  replicas: 1
  selector:
    matchLabels:
      app: vmagent
  template:
    metadata:
      labels:
        app: vmagent
    spec:
      serviceAccountName: vmagent
      containers:
      - name: vmagent
        image: victoriametrics/vmagent:v1.151.0
        args:
        - --promscrape.config=/etc/vmagent/prometheus.yml
        - --remoteWrite.url=http://vminsert:8480/insert/0/prometheus/api/v1/write
        - --remoteWrite.tmpDataPath=/tmp/vmagent-remotewrite-data
        - --remoteWrite.maxDiskUsagePerURL=1GB
        ports:
        - containerPort: 8429
          name: http
        resources:
          requests:
            cpu: 100m
            memory: 256Mi
          limits:
            cpu: 500m
            memory: 1Gi
        volumeMounts:
        - name: config
          mountPath: /etc/vmagent
        - name: tmpdata
          mountPath: /tmp/vmagent-remotewrite-data
      volumes:
      - name: config
        configMap:
          name: vmagent-config
      - name: tmpdata
        emptyDir:
          sizeLimit: 2Gi
---
apiVersion: v1
kind: ConfigMap
metadata:
  name: vmagent-config
  namespace: monitoring
data:
  prometheus.yml: "global:\n  scrape_interval: 30s\n  scrape_timeout: 10s\nscrape_configs:\n- job_name: kubernetes-pods\n  kubernetes_sd_configs:\n  - role: pod\n    namespaces:\n      names:\n      - example-app\n  relabel_configs:\n  - source_labels:\n    - __meta_kubernetes_pod_phase\n    action: keep\n    regex: Running\n  - source_labels:\n    - __meta_kubernetes_pod_container_port_protocol\n    action: keep\n    regex: TCP\n  - source_labels:\n    - __meta_kubernetes_pod_container_port_name\n    action: keep\n    regex: metrics\n  - source_labels:\n    - __meta_kubernetes_pod_annotation_prometheus_io_scrape\n    action: keep\n    regex: 'true'\n  - source_labels:\n    - __meta_kubernetes_pod_annotation_prometheus_io_path\n    action: replace\n    regex: (/.*)\n    target_label: __metrics_path__\n  - source_labels:\n    - __meta_kubernetes_namespace\n    target_label: namespace\n  - source_labels:\n    - __meta_kubernetes_pod_name\n    target_label: pod\n"
---
apiVersion: v1
kind: ServiceAccount
metadata:
  name: vmagent
  namespace: monitoring
---
apiVersion: rbac.authorization.k8s.io/v1
kind: Role
metadata:
  name: vmagent-pod-discovery
  namespace: example-app
rules:
- apiGroups:
  - ''
  resources:
  - pods
  verbs:
  - get
  - list
  - watch
---
apiVersion: rbac.authorization.k8s.io/v1
kind: RoleBinding
metadata:
  name: vmagent-pod-discovery
  namespace: example-app
roleRef:
  apiGroup: rbac.authorization.k8s.io
  kind: Role
  name: vmagent-pod-discovery
subjects:
- kind: ServiceAccount
  name: vmagent
  namespace: monitoring
This minimal agent scrapes only Running Pods in the existing example-app namespace with a TCP port named metrics and prometheus.io/scrape: "true". Discovery supplies the IPv4/IPv6 address; no colon-splitting rewrite is used. Its namespace Role only lists Pods. Node/kubelet scraping needs separate scoped RBAC and validated serving certificates; do not disable TLS checks or grant nodes/proxy just to make a sample work.
The optional prometheus.io/path annotation is used when it starts with /; otherwise the scrape path stays /metrics.
The demo queue is an emptyDir: it survives container restart in the same Pod, not Pod deletion/replacement. Reaching remoteWrite.maxDiskUsagePerURL drops the oldest queued data. For durable buffering use a reviewed persistent volume/StatefulSet or operator configuration, size each URL queue and monitor retries, drops and free space. A queue is not a backup or lossless-delivery guarantee.
vmagent Sharding
Every member needs the same discovery/relabel configuration and a distinct stable ordinal from 0 to membersCount-1. A StatefulSet name ending in that ordinal, such as vmagent-0, is also accepted. A Deployment's random Pod name is not a stable shard number. The one-replica manifest above intentionally has no sharding flags. The following is an argument reference, not a second deployable workload. Scrape replication and storage replication are different; duplicate scrape streams require compatible deduplication.
args:
  - "--promscrape.cluster.membersCount=3"    # Total number of vmagents
  - "--promscrape.cluster.memberNum=0"       # Current instance number (0, 1, 2)
  - "--promscrape.cluster.replicationFactor=2"  # How many instances scrape each target
vmalert
vmalert is a component that evaluates alerting rules and generates alerts.
Deployment
apiVersion: apps/v1
kind: Deployment
metadata:
  name: vmalert
  namespace: monitoring
spec:
  replicas: 1
  selector:
    matchLabels:
      app: vmalert
  template:
    metadata:
      labels:
        app: vmalert
    spec:
      containers:
      - name: vmalert
        image: victoriametrics/vmalert:v1.151.0
        args:
        - --datasource.url=http://vmselect:8481/select/0/prometheus
        - --remoteRead.url=http://vmselect:8481/select/0/prometheus
        - --remoteWrite.url=http://vminsert:8480/insert/0/prometheus
        - --notifier.url=http://alertmanager:9093
        - --rule=/etc/vmalert/rules/*.yaml
        - --evaluationInterval=30s
        - --external.url=http://vmalert:8880
        - --external.label=cluster=production
        ports:
        - containerPort: 8880
          name: http
        resources:
          requests:
            cpu: 100m
            memory: 128Mi
          limits:
            cpu: 500m
            memory: 512Mi
        volumeMounts:
        - name: rules
          mountPath: /etc/vmalert/rules
        livenessProbe:
          httpGet:
            path: /health
            port: 8880
          initialDelaySeconds: 10
          periodSeconds: 30
      volumes:
      - name: rules
        configMap:
          name: vmalert-rules
---
apiVersion: v1
kind: ConfigMap
metadata:
  name: vmalert-rules
  namespace: monitoring
data:
  kubernetes.yaml: "groups:\n- name: kubernetes\n  interval: 30s\n  rules:\n  - alert: NodeMemoryHigh\n    expr: '(node_memory_MemTotal_bytes - node_memory_MemAvailable_bytes)\n\n      / node_memory_MemTotal_bytes * 100 > 90\n\n      '\n    for: 5m\n    labels:\n      severity: warning\n    annotations:\n      summary: High memory usage on {{ $labels.instance }}\n      description: Memory usage is {{ printf \"%.2f\" $value }}%\n  - alert: PodRestartsHigh\n    expr: increase(kube_pod_container_status_restarts_total[1h]) > 5\n    for: 10m\n    labels:\n      severity: warning\n    annotations:\n      summary: 'Frequent restarts: {{ $labels.namespace }}/{{ $labels.pod }}'\n      description: Pod has restarted {{ $value }} times in the last hour\n- name: recording-rules\n  interval: 30s\n  rules:\n  - record: instance:node_cpu_utilization:ratio_rate5m\n    expr: 1 - avg by (instance) (rate(node_cpu_seconds_total{mode=\"idle\"}[5m]))\n  - record: instance:node_memory_utilization:ratio\n    expr:\
    \ '1 - node_memory_MemAvailable_bytes / node_memory_MemTotal_bytes\n\n      '\n"
The rules assume node-exporter and kube-state-metrics are already scraped; the minimal application-Pod discovery above does not install them. A restart count is not proof of CrashLoopBackOff, so the alert is named PodRestartsHigh. CPU recording uses a counter rate and stores a ratio, not a raw cumulative counter average.
datasource.url and remoteRead.url use the query API base; remoteWrite.url uses the write base to persist recording/alert-state series. The flag named remoteRead is not a claim that every Prometheus Remote Read protocol is implemented. Alertmanager must exist and be reachable; notification routing is separate. For evaluator HA review external labels, notification deduplication and restoration of alert state.
MetricsQL
MetricsQL supports familiar PromQL syntax but has intentional semantic differences: rate/increase can consider the raw sample before the lookbehind window and do not use Prometheus's extrapolation in the same way; NaN points are removed; scalar/instant-vector and metric-name handling can differ. Compare dashboards, alert expressions and recording rules with known input data when migrating. Do not infer full Prometheus API compatibility from query-language compatibility.
PromQL-style Queries
rate(http_requests_total[5m])
sum by (service) (rate(http_requests_total[5m]))
histogram_quantile(0.95, sum by (service, le) (rate(http_request_duration_seconds_bucket[5m])))
Aggregate histogram rates by the desired identity and le, then calculate the quantile. A quantile of separately calculated quantiles is not a global request quantile.
MetricsQL Extensions
The following function examples use audit_gauge as a small synthetic gauge, not an automatically available exporter metric.
rate(http_requests_total)
keep_last_value(up)
missing_metric default 0
label_set(up, "env", "demo")
label_del(up, "instance")
label_copy(up, "instance", "node")
label_move(up, "instance", "node")
label_join(up, "dst", "-", "job", "instance")
label_transform(up, "job", "api", "frontend")
union(up{job="api"}, up{job="web"})
lag(audit_gauge[2m])
lifetime(audit_gauge[2m])
scrape_interval(audit_gauge[2m])
range_avg(audit_gauge)
range_max(audit_gauge)
range_min(audit_gauge)
range_sum(audit_gauge)
range_first(audit_gauge)
range_last(audit_gauge)
rollup(audit_gauge[2m])
rollup_rate(http_requests_total[5m])
rollup_delta(audit_gauge[2m])
zscore_over_time(audit_gauge[2m])| Function or operator | Actual meaning and boundary |
|---|---|
rate(metric) | Omitting the window derives it from query step and observed scrape interval. Use an explicit window for reproducible rules. |
keep_last_value(q) | Fills gaps in evaluated points with an earlier value. It can hide missing scrapes; do not use it to make an availability alert look healthy. |
q1 default q2 | Fills missing points from the corresponding right-hand expression. It does not prove that missing data means zero, create the intended service labels in every case, or make zero-traffic ratios meaningful. |
label_set/copy/move/join/transform | Modify labels of the query result. They do not rewrite stored history. The regex example changes a job label and does not split IPv6 addresses. |
label_del | Removes identifying labels; check for colliding output series and use an explicit aggregation when combining identities. |
union | Combines query results; it is not numeric addition. |
lag(metric[2m]) | Seconds between the most recent raw sample in that window and the evaluation timestamp; not the interval between two samples. |
lifetime(metric[2m]) | Seconds between first and last raw samples inside that window, not the series's entire stored lifetime. |
scrape_interval(metric[2m]) | Estimates spacing from raw samples in that window; it does not read scrape configuration. |
range_avg/max/min/sum/first/last(q) | Operate across the evaluated points of each result series in the selected query range. Step/resolution affects those points; they are not aggregations over all stored history. |
rollup, rollup_rate, rollup_delta | Return multiple rollup variants (for example min/max/avg); account for the added rollup label and metric type. |
zscore_over_time | Statistical z-score for a gauge's window, not a calibrated anomaly probability or a value constrained to 0–1. anomaly_score is not a supported 1.151.0 function. |
Error Rates, Missing Data and Histograms
First remove the status dimension consistently. The numerator falls back to zero only for services with a denominator series, and the denominator filters out zero traffic:
(sum by (service) (rate(http_requests_total{status=~"5.."}[5m])) or 0 * sum by (service) (rate(http_requests_total[5m]))) / (sum by (service) (rate(http_requests_total[5m])) > 0)This fixture groups by service. If cluster or namespace is part of the service identity, include those labels consistently in every numerator and denominator aggregation.
The native fixture gives healthy/no-5xx = 0, all-5xx = 1, and 10% failures = 0.1. Zero-traffic and absent services yield no value; monitor traffic and missing telemetry separately. Dividing status-labelled series without aggregation can match the 5xx numerator only to the same 5xx denominator, producing 1 instead of the true service error rate. Appending default 0 is not a substitute for these cases.
histogram_share(0.5, sum by (service, le) (rate(http_request_duration_seconds_bucket[5m])))
count(up)
count by (job) (up)
histogram_share above estimates the share of requests at or below 500 ms during the recent window. Raw cumulative buckets instead describe accumulation since counter resets. count(up) counts selected up series, not the database's total cardinality. Use scoped TSDB/cardinality diagnostics for that purpose.
Helm Installation
The operator-based victoria-metrics-k8s-stack 0.92.1 uses vmsingle, vmcluster, vmagent and vmalert at the root. Values for the separate victoria-metrics-single or victoria-metrics-cluster charts do not configure this stack. Helm can accept unused keys, so inspect the rendered custom resources.
The pinned archive contains operator chart 0.67.3 / operator 0.74.1 and configures VictoriaMetrics 1.151.0. Its Kubernetes >=1.25.0-0 chart guard is not a complete product/EKS support matrix. --kube-version 1.35.0 below is a rendering input, not an API-server test. Check your supported EKS version, CSI provisioner and existing operator/CRD ownership before installation.
helm repo add vm https://victoriametrics.github.io/helm-charts/
helm repo update vm
helm pull vm/victoria-metrics-k8s-stack --version 0.92.1 --untar --untardir ./vendor
helm template vm-demo ./vendor/victoria-metrics-k8s-stack \
  --namespace monitoring --kube-version 1.35.0 --include-crds \
  -f values-single.yaml > rendered.yaml
values-single.yaml
This starter profile enables the store and a one-replica agent that selects release-labelled VMServiceScrape objects. It deliberately leaves unrelated collectors, default rules, Grafana and notification services disabled until their targets, permissions and credentials are configured. It is not a complete cluster-monitoring or production-HA profile. gp3 must exist with compatible storage provisioning; resource sizes are examples.
fullnameOverride: vm-demo
victoria-metrics-operator:
  crds:
    cleanup:
      enabled: false
  operator:
    disable_prometheus_converter: true
grafana:
  enabled: false
defaultDashboards:
  enabled: false
defaultRules:
  enabled: false
alertmanager:
  enabled: false
vmalert:
  enabled: false
vmsingle:
  enabled: true
  spec:
    retentionPeriod: 90d
    storage:
      storageClassName: gp3
      accessModes:
      - ReadWriteOnce
      resources:
        requests:
          storage: 100Gi
    resources:
      requests:
        cpu: 500m
        memory: 2Gi
      limits:
        cpu: '2'
        memory: 8Gi
vmcluster:
  enabled: false
vmagent:
  enabled: true
  spec:
    replicaCount: 1
    selectAllByDefault: false
    serviceScrapeSelector:
      matchLabels:
        app.kubernetes.io/instance: vm-demo
    resources:
      requests:
        cpu: 100m
        memory: 256Mi
      limits:
        cpu: 500m
        memory: 1Gi
prometheus-node-exporter:
  enabled: false
kube-state-metrics:
  enabled: false
kubelet:
  enabled: false
kubeApiServer:
  enabled: false
kubeControllerManager:
  enabled: false
kubeDns:
  enabled: false
coreDns:
  enabled: false
kubeEtcd:
  enabled: false
kubeScheduler:
  enabled: false
kubeProxy:
  enabled: false
serviceScrapeSelector selects VMServiceScrape metadata. The scrape resource then selects Services/endpoints; it is not a selector for application Pods directly. Keep namespace selection and agent RBAC consistent. For node/kubelet/control-plane metrics on EKS, enable only the endpoints available for the chosen platform and validate TLS. Managed control-plane endpoints, Auto Mode, Fargate and Windows do not all expose the same targets.
Use one owner for operator/CRDs. The profile disables the chart's CRD cleanup hook and Prometheus-resource conversion; it does not make arbitrary deletion of CRDs safe. If reusing a separately managed operator, configure the chart for that ownership instead of installing a competing controller. Review CRD upgrades separately from Helm release upgrades.
After reviewing the context, rendered objects, permissions and existing resources, installation uses the same pin and values:
helm upgrade --install vm-demo vm/victoria-metrics-k8s-stack \
  --version 0.92.1 --namespace monitoring --create-namespace \
  -f values-single.yaml
Cluster Overlay
For a new, separate cluster-mode deployment, layer this over the starter profile. Do not flip an existing single-node release to cluster mode as a data migration: disabling its CR can remove the running store, while its PVC/history is not copied into the cluster automatically.
vmsingle:
  enabled: false
vmcluster:
  enabled: true
  spec:
    retentionPeriod: 90d
    replicationFactor: 2
    vmstorage:
      replicaCount: 3
      extraArgs:
        dedup.minScrapeInterval: 1ms
      storage:
        volumeClaimTemplate:
          spec:
            storageClassName: gp3
            accessModes:
            - ReadWriteOnce
            resources:
              requests:
                storage: 100Gi
      resources:
        requests:
          cpu: 500m
          memory: 2Gi
        limits:
          cpu: '2'
          memory: 8Gi
    vmselect:
      replicaCount: 2
      extraArgs:
        dedup.minScrapeInterval: 1ms
        search.denyPartialResponse: 'true'
      resources:
        requests:
          cpu: 200m
          memory: 512Mi
        limits:
          cpu: '1'
          memory: 2Gi
      storage:
        volumeClaimTemplate:
          spec:
            storageClassName: gp3
            accessModes:
            - ReadWriteOnce
            resources:
              requests:
                storage: 2Gi
    vminsert:
      replicaCount: 2
      resources:
        requests:
          cpu: 200m
          memory: 256Mi
        limits:
          cpu: '1'
          memory: 1Gi
Render with -f values-single.yaml -f values-cluster.yaml. The native check confirmed a VMCluster, replication factor 2, three storage replicas, matching 1ms dedup settings and the cluster tenant-0 write URL. Operator reconciliation, PVC binding, failure-domain placement and actual availability still require a live test. Three storage members meet the 2*N-1 count needed to retain N=2 copies while one member is unavailable, provided the other prerequisites hold.
Grafana can use the Prometheus datasource pointed at the single-node base or http://vmselect:8481/select/0/prometheus for the raw cluster. Configure authentication, persistence and datasource access before enabling the optional Grafana chart. Configure vmalert rules, Alertmanager routing/receivers and exporter targets together; merely enabling replicas does not establish alert delivery.
Long-term Storage Configuration
Retention and Disk Capacity
Choose one retention argument, not several duplicate args mappings or competing flags:
args:
  - "--retentionPeriod=90d"
In 1.151.0 the default is one month (31 days) and the minimum is one day. A bare number is in months; an explicit unit makes intent clear. Retention does not cap storage bytes, and lowering it does not promise immediate space reclamation. There is no supported storage.maxDiskSpace flag in the reviewed binary. storage.minFreeDiskSpaceBytes stops accepting new data below a free-space threshold; it does not evict data to maintain a size-based retention target. Leave room for merges, snapshots and temporary workload spikes.
Snapshot Backup and Restore
vmbackup reads a consistent snapshot from the same storage directory as the single-node/vmstorage process. It supports S3, GCS, Azure Blob, S3-compatible and local filesystem destinations. The local snapshot alone is not an independent backup; protect remote copies, credentials and restoration procedures.
The raw StatefulSet above produces PVC storage-vmsingle-0 (claim-template + StatefulSet + ordinal), not vmsingle-storage-vmsingle-0. Operator-created names differ: inspect the actual Pod volumes/PVCs. A random CronJob cannot be assumed to attach an EBS RWO volume on another node or read the snapshot created by a different Pod. Prefer a reviewed co-located backup sidecar/workflow, and point the snapshot URL to that exact storage process.
# Run only in the reviewed backup container with this storage directory mounted.
vmbackup -storageDataPath=/storage \
  -snapshot.createURL=http://127.0.0.1:8428/snapshot/create \
  -dst=s3://example-vm-backup/cluster-a/vmsingle-0/2026-09-12
The bucket/prefix above is a placeholder and the command creates storage snapshots and writes backup objects; it was not executed against AWS. Avoid concurrent writers to one destination. Reusing a destination performs incremental synchronization, not an immutable historical backup by itself; define versioned destinations/retention and test recovery. In cluster mode back up every vmstorage member to a distinct prefix, not vminsert/vmselect or a load-balanced random member. Restore with the compatible vmrestore workflow into reviewed storage while the target database process is stopped.
Use a least-privilege workload identity for the actual backup container and bucket/prefix; configure its AWS Region, TLS and network route as well. The reviewed source uses AWS SDK for Go v2's default configuration chain; EKS Pod Identity additionally needs its Agent/association and supported Linux EC2 platform, while IRSA is another supported integration path. Neither a ServiceAccount name nor S3 networking alone grants access. Check required read/write/list/delete or KMS operations against the chosen backup/retention workflow. Do not inject static AWS access keys into the chart, CronJob or image.
Downsampling
Enterprise storage downsampling and OSS recording additional derived series are not the same operation. Recording rules do not remove or compact raw data and can increase stored series. Ingestion-time stream aggregation is another option, with explicit grouping, reset and keep/drop-input semantics; evaluate those before discarding raw samples.
Recording Derived Series
Use this group instead of the earlier recording group when choosing five-minute output intervals; do not activate both with the same record names.
CPU seconds are counters, so calculate an idle rate, then derive utilization. The one-hour expression below averages the recorded five-minute ratio observations. Keep histogram quantiles in separate series; combining same-label p50/p90/p99 expressions with or retains the first matching series and loses the others.
groups:
- name: derived-series
  interval: 5m
  rules:
  - record: instance:node_cpu_utilization:ratio_rate5m
    expr: 1 - avg by (instance) (rate(node_cpu_seconds_total{mode="idle"}[5m]))
  - record: instance:node_cpu_utilization:ratio_avg1h
    expr: avg_over_time(instance:node_cpu_utilization:ratio_rate5m[1h])
  - record: service:http_request_duration_seconds:p50_5m
    expr: histogram_quantile(0.5, sum by (service, le) (rate(http_request_duration_seconds_bucket[5m])))
  - record: service:http_request_duration_seconds:p90_5m
    expr: histogram_quantile(0.9, sum by (service, le) (rate(http_request_duration_seconds_bucket[5m])))
  - record: service:http_request_duration_seconds:p99_5m
    expr: histogram_quantile(0.99, sum by (service, le) (rate(http_request_duration_seconds_bucket[5m])))
These p50/p90/p99 values are derived gauges and cannot reconstruct the original histogram or a correct quantile across arbitrary longer windows. Preserve rate/count/bucket information if later aggregation is required. Alert thresholds, record intervals, missing inputs and query semantics need tests before adoption.
Performance Optimization
| Control | What it actually bounds |
|---|---|
memory.allowedPercent / memory.allowedBytes | Internal caches, not total process RSS; query/ingestion/Go/OS memory needs additional headroom. |
search.maxMemoryPerQuery | One query; account for concurrent requests and other allocations. |
search.maxUniqueTimeseries, search.maxSamplesPerQuery | Reject unexpectedly large queries; they do not reduce ingestion cardinality. |
search.maxQueryDuration, search.maxPointsPerTimeseries | Query time/output bounds. A larger range step changes evaluation resolution, not the original stored samples. |
storage.cacheSizeIndexDBDataBlocks, storage.cacheSizeIndexDBIndexBlocks | Advanced cache overrides. Measure cache misses, CPU and disk I/O before overriding automatic sizing. |
maxLabelsPerTimeseries, maxLabelValueLen | The reviewed version rejects series exceeding limits and increments vm_rows_ignored_total; these are not harmless label truncation. |
dedup.minScrapeInterval | Retains one point per discrete interval of the same label set; choose deliberately for replication/scraper cadence, not as generic compression. |
Measure active series and churn, query fan-out, retention, queue growth, cache pressure and free disk. A fixed resource example or one benchmark does not establish a safe production capacity. Protect administrative and query endpoints with network and application access controls.
Best Practices
Choose failure and recovery objectives before replica counts. Separate collector HA, storage replication, query availability and backups. Keep tenant routing/authentication, TLS, workload identity, PVC ownership and upgrade/migration responsibilities explicit. Monitor insert failures, rejected rows, queue drops, slow queries, memory and disk; discover the labels actually exposed by each component's /metrics endpoint before writing rules.
The local 1.151.0 /metrics endpoint exposed these metric names. After scraping it, use the actual job/instance labels to scope queries:
vm_app_version
rate(vm_rows_inserted_total[5m])
rate(vm_slow_queries_total[5m])
process_resident_memory_bytes
Migration Guide
- Keep the current scraper and add a reviewed VictoriaMetrics remote-write target; validate queue health and data arrival.
- Run Grafana queries and alert rules against both stores with known inputs, including missing/zero traffic, counter resets and histogram aggregation.
- If importing history, create and preserve a consistent Prometheus snapshot. Run the separately supplied
vmctlagainst the intended destination and account for retention, overlap/dedup, rate limits and permissions. - Retire the old write path only after the replacement scraper/agent is collecting all targets and its data is present. Changing Grafana's datasource does not replace metric collection. Keep a rollback window and backup ownership.
remote_write:
- url: http://vmsingle.monitoring.svc:8428/api/v1/writevmctl prometheus --prom-snapshot=/backup/prometheus-snapshot \
--vm-addr=http://vmsingle.monitoring.svc:8428These are configuration/command references, not a migration executed in this audit. The URL names above refer to the raw single-node manifest; use the actual generated Services for the Helm profile. Cluster import/write/query paths differ from the single-node paths. For vmctl, supply the vminsert base through --vm-addr and the intended tenant through --vm-account-id; do not substitute the remote-write URL for the importer base.
Troubleshooting
Use a known single-node Service and a local port-forward for read-only diagnostics; replace the Service name for the operator/Helm deployment:
kubectl port-forward -n monitoring svc/vmsingle 8428:8428curl --fail --silent --show-error http://127.0.0.1:8428/api/v1/status/tsdb
curl --fail --silent --show-error http://127.0.0.1:8428/api/v1/status/active_queries
curl --fail --silent --show-error http://127.0.0.1:8428/api/v1/status/top_queries
curl --fail --silent --show-error http://127.0.0.1:8428/metricsTSDB status describes series/cardinality, not filesystem free bytes or a complete memory profile. Check process/container memory, PVC/filesystem metrics, queue size and storage health separately. Active/top-query endpoints describe requests and may require profiling flags or elapsed collection time to provide useful results. Query filters, range, step and concurrency can materially affect cost.
A full disk needs a storage/retention/ingestion plan, not a blanket deletion command. delete_series, /snapshot/create and /internal/force_merge are mutating administrative operations. Deletion requires a valid, narrowly reviewed selector and backup/retention approval; snapshots can retain disk blocks, and force-merge consumes I/O and needs working space. They are intentionally not included in a copy-paste read-only diagnostic block. Stopping ingress under storage pressure can overflow finite collector queues, so inspect the whole data path.
References
- VictoriaMetrics 1.151.0
- Single-node
- Cluster / replication
- MetricsQL
- vmagent
- vmalert
- vmbackup
- Prometheus snapshot migration
- Stream aggregation
- Stack0.92.1 values
- VMServiceScrape
- EKS EBS CSI
- Pod Identity SDK requirements
- Backup S3 implementation