Datadog
Last Updated: October 12, 2026 Helm chart 3.244.0; matching Agent/Cluster Agent 7.83.1. Configuration, SDK and local validation limits are stated below; no Datadog tenant was modified.
Introduction
Datadog supplies a SaaS observability backend. Teams still own collectors, identity, network access, instrumentation, data disclosure, retention, monitors and cost. Infrastructure Monitoring, APM, profiling, logs and other products have distinct entitlements and billing dimensions; installing an Agent does not include every product.
| Topic | Datadog | CloudWatch | Self-managed Prometheus / Grafana |
|---|---|---|---|
| Backend | Datadog SaaS, with site-specific availability | AWS-managed services | Operated storage, query and visualization |
| Collection | Agent/Cluster Agent, libraries and supported OTel paths | AWS service metrics, agents/SDKs/OTLP | Exporters, scraping, agents and remote write |
| APM/logs | Select and configure the required products | Application Signals, tracing and Logs integrations | Configure the relevant backends and collectors |
| Operations | Collector/configuration and application responsibilities remain | Collection/configuration and response responsibilities remain | Backend and collection responsibilities remain |
| Cost | Host and other product-specific usage/retention units | Metric/observation/OTLP/log/query/alarm units | Infrastructure and operating effort |
Choose the correct Datadog site for the organization and its credentials; API endpoints, data residency, available products and pricing terms are not interchangeable across sites. Use the integration catalogue rather than a fixed integration-count claim or a universal “easy/advanced/cheap” ranking.
EKS integration architecture
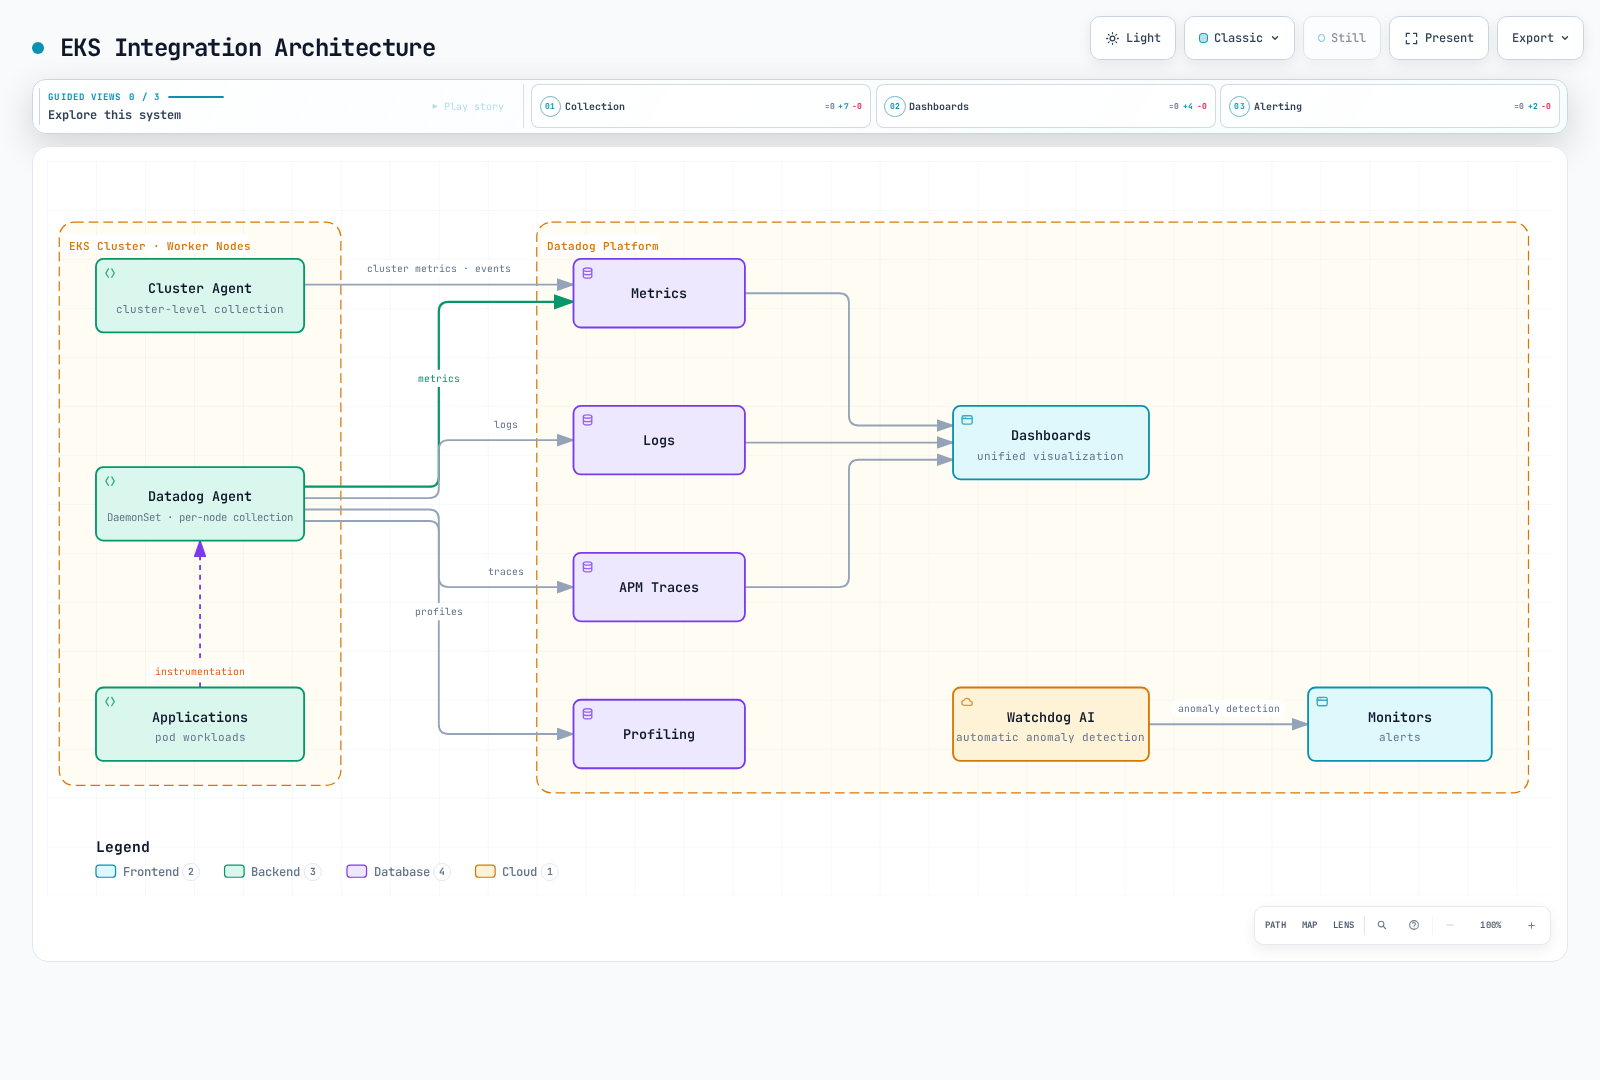
| Component | Responsibility / boundary |
|---|---|
| Node Agent | Host/container checks; typically a DaemonSet on supported EC2 nodes |
| Cluster Agent | Shared Kubernetes metadata/checks, event coordination and optional admission/external-metric features |
| Trace Agent | Receives application trace payloads and forwards them |
| Process collection / system-probe | Optional process/network/security features with their own OS, privilege and product requirements |
| Admission Controller | Injects connection settings and, when configured, supported client libraries into new pods |
Application instrumentation produces traces/profiles; an Agent listener or a pod label alone does not prove instrumentation. The Cluster Agent is not the ordinary application-log or trace forwarding path.
This chapter's installation targets Linux EC2-backed EKS nodes. EKS Fargate uses the documented per-pod/sidecar collection model, not this host DaemonSet. UDS is local to the host and is not supported on Windows. Windows, Bottlerocket, Auto Mode and mixed compute need their distribution/feature-specific settings and supported host access. Do not disable TLS verification or claim all eBPF/process features work everywhere.
Datadog documents Agent and Cluster Agent 7.67+ for Kubernetes 1.33+ compatibility with AllocatedResources, and recommends matching their versions. Such minimum feature requirements are not the current EKS support matrix.
The overview shows possible collection paths. Traces/profiles require application instrumentation and selected products; Watchdog notification routing must be configured.
Datadog Agent installation
Datadog recommends its Operator for higher-level lifecycle configuration and also supports Helm installation. This example owns the node/Cluster Agents through the Datadog Agent Helm chart. Chart 3.244.0 bundles an optional Operator dependency; datadog.operator.enabled: false keeps that additional controller out of this example. It does not mean the Operator is obsolete.
The chart defaults to Agent/Cluster Agent 7.82.3. This example explicitly pins both to 7.83.1 and the verified image-index digests. The release includes network-test billing, containerd snapshot cleanup and Cluster Agent leader-lock shutdown fixes. The Agent/Cluster Agent image indexes include Linux amd64/arm64. A successful template render is not a Kubernetes deployment or runtime compatibility test.
Credentials and installation ownership
This profile retrieves the Datadog API key and shared Cluster Agent token from AWS Secrets Manager using the native aws.secrets backend. An application key is not needed for baseline ingestion; external metrics remain disabled.
Prepare observability/datadog in ap-northeast-2 with JSON string keys api-key and cluster-token; the token must be cryptographically random and at least 32 characters. The API key must match the Datadog site. Both ServiceAccounts, datadog and datadog-cluster-agent in namespace datadog, require scoped IRSA roles, regional STS/Secrets Manager connectivity and KMS permission if applicable. Replace the two example role ARNs. EC2 metadata credential fallback is disabled. See complete prerequisites and reusable profiles.
Use Python 3/PyYAML 6.0.3 and the executable pinned-chart postrenderer from that repository directory. It replaces exactly seven hardcoded SecretKeyRef entries with literal ENC[...] handles, preserving node, trace, init and Cluster Agent consumers. Native resolution updates in-memory configuration, not the environment. The init script requires nonempty DD_API_KEY, so deleting it without a valid replacement breaks startup. The must-use-secret-postrenderer Secret is deliberately absent; do not create it to bypass an omitted renderer. Keep the renderer on every install/upgrade and review changes to the pinned chart, images or profile contract.
These commands change the cluster only at installation; no deployment was executed in the audit. Run from the repository root, in an existing datadog namespace, with an owned release after preparing the IAM/secret prerequisites.
PROFILE=examples/observability/secret-profiles
helm repo add datadog https://helm.datadoghq.com
helm repo update datadog
helm template datadog datadog/datadog --version 3.244.0 \
  --namespace datadog --include-crds -f "$PROFILE/datadog-values.yaml" \
  --post-renderer "$PROFILE/datadog_postrender.py" > datadog-reviewed-render.yaml
# Review resources and ownership first; retain the renderer on EVERY upgrade.
helm upgrade --install datadog datadog/datadog --version 3.244.0 \
  --namespace datadog -f "$PROFILE/datadog-values.yaml" \
  --post-renderer "$PROFILE/datadog_postrender.py"
Reviewed values
The following matches the reusable datadog-values.yaml. Logs are opt-in by container configuration, APM/DogStatsD use UDS, and cluster-wide automatic library injection, external HPA metrics, discovery network statistics and optional process/network collection are not enabled here. The application namespace should be separate from the Agent namespace; SSI does not instrument pods in the Agent's own namespace.
# datadog 3.244.0: postrenderer required; replace example IRSA role ARNs.
targetSystem: linux
registry: gcr.io/datadoghq
datadog:
  apiKeyExistingSecret: must-use-secret-postrenderer
  clusterName: my-eks-cluster
  site: datadoghq.com
  tags:
  - env:demo
  - team:platform
  logs:
    enabled: true
    containerCollectAll: false
    containerCollectUsingFiles: true
  apm:
    socketEnabled: true
    portEnabled: false
    instrumentation:
      enabled: false
  dogstatsd:
    useSocketVolume: true
    useHostPort: false
    nonLocalTraffic: false
  processAgent:
    processCollection: false
    processDiscovery: false
    containerCollection: true
  networkMonitoring:
    enabled: false
  discovery:
    enabled: false
    networkStats:
      enabled: false
  autoscaling:
    workload:
      enabled: false
  profiling:
    enabled: null
  collectEvents: true
  prometheusScrape:
    enabled: false
  kubeStateMetricsCore:
    enabled: true
    collectSecretMetrics: false
    collectConfigMaps: false
  operator:
    enabled: false
  secretBackend:
    type: aws.secrets
    config:
      aws_session:
        aws_region: ap-northeast-2
    enableGlobalPermissions: false
  env: &id001
  - name: AWS_EC2_METADATA_DISABLED
    value: 'true'
  - name: DD_SECRET_REFRESH_INTERVAL
    value: '0'
  - name: DD_SECRET_REFRESH_ON_API_KEY_FAILURE_INTERVAL
    value: '0'
clusterAgent:
  enabled: true
  replicas: 2
  image:
    tag: 7.83.1
    digest: sha256:8e420c81e68abec34ab792c72a6513b739dcba8f7682c52e1e7e276363827b1a
  metricsProvider:
    enabled: false
    useDatadogMetrics: false
  admissionController:
    enabled: true
    mutateUnlabelled: false
  tokenExistingSecret: must-use-secret-postrenderer
  rbac:
    create: true
    serviceAccountAnnotations:
      eks.amazonaws.com/role-arn: arn:aws:iam::111122223333:role/datadog-cluster-agent-secrets
  env: *id001
agents:
  image:
    tag: 7.83.1
    digest: sha256:ed0bd588e955d82f661d1b8dd1cdf179c1023e74a2817e7a812c99d52f05c319
  rbac:
    create: true
    serviceAccountAnnotations:
      eks.amazonaws.com/role-arn: arn:aws:iam::111122223333:role/datadog-agent-secrets
The only credential-related environment values after postrendering are ENC[observability/datadog;api-key] and ENC[observability/datadog;cluster-token]. DD_SECRET_BACKEND_TYPE/CONFIG carry only the backend type and region. No shell exports a resolved value, no real key is placed in Helm values, and the profile does not need a Kubernetes credential Secret. The two init-volume containers only copy image configuration; init-config uses the API-key handle for its bootstrap check. Actual native backend authorization and Datadog ingestion still require runtime verification.
Scheduled and API-failure secret refresh are explicitly disabled. Rotate through an approved coordinated restart of node/trace and Cluster Agent Pods; keep an old API key valid until the fleet uses the new key. A cluster-token change can interrupt node/Cluster Agent authentication during mixed-version rollout, so plan a maintenance window or separately validated transition. No zero-downtime rotation is claimed. See Datadog secret backends.
processAgent.enabled is deprecated; use the individual collection options. The chart already mounts /etc/passwd when applicable, so do not add duplicate manual passwd volumes/mounts. Resource overrides are per component, such as agents.containers.agent.resources; size the actual rendered containers under load. Two Cluster Agent replicas do not replace placement, disruption and failure testing.
The original top-level kubeStateMetricsEnabled and prometheus.enabled entries do not configure the claimed integrations. The legacy KSM option is nested under datadog; the example uses datadog.kubeStateMetricsCore.enabled and avoids duplicate legacy collection. Explicit Datadog Autodiscovery checks are separate from turning on annotation-wide prometheusScrape.
datadog.profiling.enabled is valid. It injects DD_PROFILING_ENABLED into eligible pods and requires installed client libraries and Cluster Agent 7.57+. It does not install a profiler into an arbitrary uninstrumented application. Choose its null/false/auto/true behavior deliberately. Likewise, enabling external HPA metrics requires its application key, API permissions, service/CRDs and actual metric availability; network monitoring requires supported system-probe access.
AWS account integration is a separate path
The SaaS AWS account integration uses an authorized cross-account role and Datadog-provided external ID, with the permissions needed by selected integrations. An arbitrary IRSA role attached to a node Agent SA does not configure that SaaS integration. Ordinary Kubernetes Agent collection does not require the broad CloudWatch/EC2/tag policy previously shown here.
Use Pod Identity or IRSA only for an Agent/check that actually calls AWS, with its specific role, trust and permissions. Resolve the rendered service-account name; creating an IAM association for a guessed datadog-agent SA does not bind a different SA used by the Helm release. Never treat a local STS caller check as proof of the workload's identity.
Infrastructure Monitoring
Check the metric's collector, unit and tags
| Metric / source | Meaning |
|---|---|
system.cpu.idle / System check | CPU idle percent; suitable for a percentage-based node threshold |
system.mem.total, system.mem.used, system.mem.free | Memory measurements; free is not interchangeable with usable/reclaimable memory |
kubernetes.cpu.usage.total / Kubelet | Nanocores, not percent; one core is 1,000,000,000 nanocores |
kubernetes.memory.usage, kubernetes.memory.limits | Bytes; usage versus limit requires matching the same entity/tag set |
kubernetes.pods.running, kubernetes.containers.restarts | Valid Kubelet gauges: running pods and cumulative container restarts |
kubernetes_state.deployment.replicas_available, kubernetes_state.deployment.replicas_desired | Kubernetes State Metrics Core deployment state |
kubernetes_state.pod.status_phase, kubernetes_state.service.count | Pod phase/service inventory; inspect their documented grouping tags |
kubernetes_state.container.restarts | State Core's restart gauge, with namespace/pod/container tags |
The legacy Kubernetes integration, Kubelet check and State Core have different catalogues. A metric absent from one catalogue is not necessarily removed from the Agent. Do not rename valid Kubelet metrics blindly. Filesystem/network availability and rate units depend on the collector/runtime; read that metric's actual definition.
Use the standard kube_cluster_name tag for this Kubernetes installation and inspect real metric tags before grouping. Cluster-centric State Core metrics do not always carry a host tag. cluster_name and kube_cluster_name are not interchangeable. A raw nanocore value compared with 80 does not mean 80% CPU.
OpenMetrics Autodiscovery
Merge the following metadata fragment into a workload whose container is named app and serves the gauge queue_depth on port 9464. It does not create that application or endpoint. The annotation's container identifier must match. Protect the endpoint and configure TLS/authentication if required.
metadata:
  annotations:
    ad.datadoghq.com/app.checks: "{\n  \"openmetrics\": {\n    \"init_config\": {},\n\
      \    \"instances\": [\n      {\n        \"openmetrics_endpoint\": \"http://%%host%%:9464/metrics\"\
      ,\n        \"namespace\": \"my_app\",\n        \"metrics\": [\n          {\n\
      \            \"queue_depth\": \"queue_depth\"\n          }\n        ]\n    \
      \  }\n    ]\n  }\n}"
The current openmetrics check uses openmetrics_endpoint. These Datadog Autodiscovery annotations do not require a separate Prometheus server or the chart's broad prometheusScrape discovery. Restrict selected metrics/labels. For counters and histograms, verify name normalization, emitted .count/bucket series and check-version behavior instead of assuming the Prometheus name is also the final Datadog name.
DogStatsD: use an endpoint reachable from the application
An application pod's localhost is not the node Agent. The Linux example uses the host-local UDS directory. The Admission Controller's socket mode can inject DD_DOGSTATSD_URL, DD_TRACE_AGENT_URL and the volume; otherwise configure matching mounts and permissions explicitly. A Pod-specific admission.datadoghq.com/config.mode is a label, not an annotation. Mount the parent directory so socket replacement after an Agent restart remains visible.
The Python helper was checked with datadog==0.53.0. Pass the actual filesystem path, such as /var/run/datadog/dsd.socket, to socket_path; the unix:// URL used by other SDKs/environment settings is not the same argument format. Call emit_batch with actual interval counts, including zero good/error values.
from datadog import DogStatsd


def emit_batch(client, total, errors):
    """Report one real interval; send zeros instead of omitting counters."""
    if any(isinstance(x, bool) or not isinstance(x, int) for x in (total, errors)):
        raise ValueError("counts must be integers")
    if not 0 <= errors <= total:
        raise ValueError("require 0 <= errors <= total")
    client.increment("requests.total", total)
    client.increment("requests.error", errors)
    client.increment("requests.good", total - errors)


# Create once in an application with the Agent's UDS directory mounted.
# This construction does not mean that the socket or receiving Agent is ready.
def make_metrics_client(socket_path):
    return DogStatsd(
        socket_path=socket_path,
        namespace="my_app",
        constant_tags=["env:demo", "service:orders"],
        disable_telemetry=True,
        disable_buffering=True,
    )
The Go helper uses datadog-go/v5. Create the client with WithNamespace("my_app.") and the same env:demo,service:orders tags. Check constructor, send and close errors; do not discard the statsd.New error. The helper does not close a shared client supplied by the caller.
package metrics

import (
    "fmt"

    "github.com/DataDog/datadog-go/v5/statsd"
)

// The caller creates/reuses the client, checks New's error, and closes it at shutdown.
// For the Linux UDS example, use unix:///var/run/datadog/dsd.socket.
func EmitBatch(client *statsd.Client, total, errors int64) error {
    if errors < 0 || total < errors {
        return fmt.Errorf("require 0 <= errors <= total")
    }
    for _, item := range []struct {
        name string
        value int64
    }{
        {"requests.total", total},
        {"requests.error", errors},
        {"requests.good", total - errors},
    } {
        if err := client.Count(item.name, item.value, nil, 1); err != nil {
            return err
        }
    }
    return nil
}| DogStatsD type | Interpretation |
|---|---|
| Counter | Interval count; Datadog may store it as a rate. .as_count() reconstructs counts for a query window |
| Gauge | Snapshot such as queue depth; summing snapshots is not a processed-request count |
| Histogram | Aggregated by the receiving Agent; averaging per-host percentiles does not create a global percentile |
| Distribution | Supports backend distribution aggregation; review enabled percentiles, tags and billing |
| Service check | Status from a real health check: 0 OK, 1 warning, 2 critical, 3 unknown |
Local datagram delivery does not acknowledge SaaS ingestion. UDP can lose packets; UDS/client buffering and Agent queues also need monitoring. The sample helper does not enable DogStatsD client telemetry, so choose a separate collection-health signal for deployment. Counter retries/duplicate sends are not an exactly-once business ledger.
File-based Autodiscovery configuration
For Helm-owned configuration, datadog.confd creates and mounts the check files. A standalone ConfigMap named datadog-checks is not automatically discovered merely because it exists. The following NGINX fragment requires a matching image identity and a configured, authorized stub_status endpoint.
datadog:
  confd:
    nginx.yaml: "ad_identifiers:\n  - nginx\ninit_config: {}\ninstances:\n  - nginx_status_url:\
      \ http://%%host%%:80/nginx_status\n"
An authenticated Redis check additionally needs the correct port/TLS and credential delivery. %%env_REDIS_PASSWORD%% reads the Agent's environment, not the Redis application pod's environment. Prefer a configured Datadog secret backend or protected file delivery with the specific permissions it needs; do not expose passwords in public check examples or grant cluster-wide Secret reads just for discovery.
APM and Distributed Tracing
Local SDK injection and SSI are explicit choices
The admission opt-in label allows mutation/connection-setting injection. To install a tracing library, configure SSI targets or a supported language/version annotation. The label alone is not proof that an SDK was installed or traces reached Datadog. Java/Python/Node.js local injection requires Cluster Agent 7.40+; .NET/Ruby requires 7.44+. Cluster Agent 7.83.1 (the version pinned in this guide) also excludes kube-system and its own namespace from injection.
For a controlled Java example, merge the following pod-template fragment into an existing Deployment in an application namespace, preserving its selector, containers and security settings. It is not a complete Deployment to apply alone. The Java init image gcr.io/datadoghq/dd-lib-java-init:v1.66.0 was verified for Linux amd64/arm64. Verify the actual application's JVM/framework/image compatibility.
spec:
  template:
    metadata:
      labels:
        admission.datadoghq.com/enabled: 'true'
        admission.datadoghq.com/config.mode: socket
        tags.datadoghq.com/env: demo
        tags.datadoghq.com/service: orders
        tags.datadoghq.com/version: 1.0.0
      annotations:
        admission.datadoghq.com/java-lib.version: v1.66.0
The tags.datadoghq.com/* labels supply unified service/environment/version tagging. Do not put the label only on Deployment metadata and expect its pods to inherit it. Injection happens when new pods are admitted. Confirm the injected init containers, library files, UDS mounts/permissions and the non-secret connectivity settings, then verify actual traffic/traces. Namespace exclusions, webhook failures, security policies and unsupported images can prevent instrumentation.
Cluster-wide SSI is an alternative configured through datadog.apm.instrumentation, with reviewed namespace/pod targets and library versions. Avoid combining manual and injected tracers unintentionally: an injected library can take precedence over a manually installed one. Profiler enablement still requires a supported client library and its own product/runtime conditions.
Manual Java instrumentation
Use a staged, versioned dd-java-agent.jar when starting the application JVM, or the validated injection route above. Merely adding dd-trace-api gives access to the annotation/API; it does not start runtime bytecode instrumentation. The Maven dependency below and Java source are separate files.
<dependency>
  <groupId>com.datadoghq</groupId>
  <artifactId>dd-trace-api</artifactId>
  <version>1.66.0</version>
</dependency>import java.util.function.Supplier;
import datadog.trace.api.Trace;
public final class TraceMethods {
private TraceMethods() {}
@Trace(operationName = "order.process", resourceName = "process_order")
public static <T> T process(Supplier<T> handler) {
return handler.get();
}
}The handler represents application code supplied by the caller. Use bounded operation/resource names. The old example's per-order/customer identifier tags are unnecessary for this demonstration and can create disclosure/cardinality risks. Manual span APIs require their corresponding supported bridge/library; do not add OpenTracing imports to a project that only has the annotation API.
Manual Python instrumentation
Use the current ddtrace.trace import for this checked 4.14.0 example. Keep the dependency declaration in requirements.txt, not inside a Python code block. For framework auto-instrumentation, follow the selected ddtrace-run/SSI setup before application imports; do not assume this helper patches an entire framework.
ddtrace==4.14.0from ddtrace.trace import tracer
def process_order(handler):
with tracer.trace("order.process", service="orders", resource="process_order") as span:
span.set_tag("operation.kind", "order")
return handler()The equivalent tracer.wrap decorator is available for method tracing. Exceptions from the handler must propagate; recording a span is not an application retry or success guarantee. Use correct service/env/version tags and context propagation across supported HTTP/message integrations. Service maps come from observed instrumented relationships, not from arbitrary DD_TAGS alone.
Do not tag raw customer/order identifiers, tokens or request bodies by default. Review instrumentation capture, error messages and sampling/redaction rules for the actual application. Auto-instrumentation does not guarantee complete PII removal.
Log Management
Select collection and parsing deliberately
The installation enables log collection but leaves containerCollectAll: false. Merge this metadata into the pod template for the container named app. The multiline rule applies to plain-text Java records beginning with a date. It is not a general JSON-log parser. Container runtime framing and application message parsing are separate stages; verify the actual collected records.
metadata:
  annotations:
    ad.datadoghq.com/app.logs: "[\n  {\n    \"source\": \"java\",\n    \"service\"\
      : \"orders\",\n    \"log_processing_rules\": [\n      {\n        \"type\": \"\
      multi_line\",\n        \"name\": \"java_timestamp_start\",\n        \"pattern\"\
      : \"^\\\\d{4}-\\\\d{2}-\\\\d{2}\"\n      }\n    ]\n  }\n]"
For one-JSON-event-per-line applications, use the supported JSON path rather than joining unrelated JSON events with this rule. File access, runtime paths, annotation matching, exclusion settings and backend pipeline filters all affect collection. Check selective collection with both a matching application and an excluded one.
Pipeline request structure
This request uses the actual API fields match_rules and support_rules. The old camelCase fields were not the Logs API model. The sample message defines the expected line format; use the application's actual format/timezone and test unmatched/multiline/error cases. A valid request model does not prove Grok parsing or ingestion/indexing in a Datadog tenant.
{
  "name": "Java application logs",
  "is_enabled": true,
  "filter": {
    "query": "source:java service:orders"
  },
  "processors": [
    {
      "type": "grok-parser",
      "name": "Parse the documented Java line format",
      "is_enabled": true,
      "source": "message",
      "samples": [
        "2026-09-13 12:00:00,123 INFO [main] example.Service - completed"
      ],
      "grok": {
        "support_rules": "",
        "match_rules": "java_log %{date(\"yyyy-MM-dd HH:mm:ss,SSS\"):timestamp} %{word:level} \\[%{notSpace:thread}\\] %{notSpace:logger} - %{data:message}"
      }
    },
    {
      "type": "status-remapper",
      "name": "Use level as status",
      "is_enabled": true,
      "sources": [
        "level"
      ]
    },
    {
      "type": "date-remapper",
      "name": "Use parsed timestamp",
      "is_enabled": true,
      "sources": [
        "timestamp"
      ]
    }
  ]
}
Pipeline creation/reordering changes processing for matching logs. Configure it under the correct site, scoped API permissions and existing pipeline ownership. No pipeline request was sent during this audit.
Trace-log correlation and MDC ownership
Use supported automatic log injection where possible and preserve trace/span IDs as strings in structured logs. Correct service/env/version, timestamps, parsing and available trace data are also needed; two ID fields alone do not guarantee correlation. There is no useful active trace ID when a process has not been instrumented.
For applications that explicitly manage SLF4J MDC, this helper restores the caller's whole previous context on success and failure. The old unconditional MDC.clear() lost unrelated caller fields. It is a synchronous helper, not an async context propagation mechanism or a complete servlet filter.
import java.util.Map;
import java.util.function.Supplier;
import datadog.trace.api.CorrelationIdentifier;
import org.slf4j.MDC;

public final class TraceLogContext {
    private TraceLogContext() {}

    public static <T> T withTraceContext(Supplier<T> handler) {
        Map<String, String> previous = MDC.getCopyOfContextMap();
        try {
            MDC.put("dd.trace_id", CorrelationIdentifier.getTraceId());
            MDC.put("dd.span_id", CorrelationIdentifier.getSpanId());
            return handler.get();
        } finally {
            if (previous == null) {
                MDC.clear();
            } else {
                MDC.setContextMap(previous);
            }
        }
    }
}
It requires dd-trace-api and the application's compatible SLF4J API/provider. The logging pattern or JSON encoder must include the MDC values. Do not copy a servlet example without the servlet API, imports and checked-exception contract.
Dashboards and Alerts
Dashboard request construction
This helper uses datadog-api-client==2.60.0 to construct a request body. The cluster and namespace template variables are actually referenced by its queries. The host widget uses a percent metric; the pod widget uses memory bytes and its namespace filter. Check that the selected data really has the grouping tags.
from datadog_api_client.v1.model.dashboard import Dashboard
from datadog_api_client.v1.model.dashboard_layout_type import DashboardLayoutType


def build_dashboard(cluster_name):
    return Dashboard(
        title="EKS observability example",
        layout_type=DashboardLayoutType.ORDERED,
        widgets=[
            {"definition": {
                "type": "timeseries",
                "title": "CPU idle by host (%)",
                "requests": [{"q": "avg:system.cpu.idle{$cluster} by {host}", "display_type": "line"}],
            }},
            {"definition": {
                "type": "toplist",
                "title": "Top 10 pod memory series by mean (bytes)",
                "requests": [{"q": "top(sum:kubernetes.memory.usage{$cluster,$namespace} by {pod_name,kube_namespace}, 10, 'mean', 'desc')"}],
            }},
        ],
        template_variables=[
            {"name": "cluster", "prefix": "kube_cluster_name", "default": cluster_name},
            {"name": "namespace", "prefix": "kube_namespace", "default": "*"},
        ],
    )
The caller supplies a correctly configured ApiClient and uses DashboardsApi to create or update the intended dashboard. Record/reconcile its returned ID; repeated creation by title can create duplicates. Site and scoped automation credentials are separate from the node Agent API key. No dashboard API was called in this audit.
Monitor queries and units
Use a configured Datadog Terraform provider and project version constraints/lock file. These are resource fragments, not a complete provider/credential setup. Thresholds are examples; inspect real metric units, tags, windows and application objectives. The first monitor evaluates idle percent directly instead of comparing nanocores with 80 and calling the result “CPU percent”.
# Fragments for a configured, version-pinned Datadog Terraform provider.
# Replace notification destinations with approved, tested destinations.
resource "datadog_monitor" "low_cpu_idle" {
  name    = "Low CPU idle on EKS nodes"
  type    = "metric alert"
  message = "CPU idle on {{host.name}} is {{value}}%. Inspect the host and collection health."
  query   = "avg(last_5m):avg:system.cpu.idle{kube_cluster_name:my-eks-cluster} by {host} < 20"
  monitor_thresholds {
    warning  = 30
    critical = 20
  }
  require_full_window = false
  notify_no_data      = false
  tags               = ["env:demo", "team:platform"]
}

resource "datadog_monitor" "restart_total" {
  name    = "Container restart total exceeds example threshold"
  type    = "metric alert"
  message = "Inspect {{pod_name.name}} / {{kube_container_name.name}}. This is a restart total, not a count of new restarts in five minutes."
  query   = "max(last_5m):max:kubernetes_state.container.restarts{kube_cluster_name:my-eks-cluster} by {pod_name,kube_namespace,kube_container_name} > 3"
  monitor_thresholds {
    warning  = 2
    critical = 3
  }
  require_full_window = false
  notify_no_data      = false
  tags               = ["env:demo", "team:platform"]
}

resource "datadog_monitor" "request_error_rate" {
  name    = "High request error ratio"
  type    = "metric alert"
  message = "Error ratio for {{service.name}} is {{value}}%. Check traffic volume and the reporting path."
  query   = "sum(last_5m):sum:my_app.requests.error{env:demo} by {service}.as_count() / sum:my_app.requests.total{env:demo} by {service}.as_count() * 100 > 5"
  monitor_thresholds {
    warning  = 2
    critical = 5
  }
  require_full_window = false
  notify_no_data      = false
  tags               = ["env:demo", "type:application"]
}
The restart gauge is a total. Comparing sums of repeated gauge samples in two windows does not count new restarts reliably, especially with resets, replacement pods or unequal sampling. A recent-restart monitor needs a validated delta/reset design. This example explicitly alerts on a total instead.
The error monitor uses the three counters emitted by emit_batch, including explicit zero values for errors/good requests. For .as_count() evaluation, time aggregation occurs before division: sum(errors)/sum(total), rather than a sum of each time bucket's ratio. Use a sum aggregator with this path.
Zero traffic, missing telemetry and genuinely error-free traffic are different. Define minimum traffic/collection-health conditions and validate the monitor's no-data behavior. notify_no_data: false does not establish health; it simply does not notify on missing data in these fragments.
For built-in APM metrics, use the actual trace.<operation>.hits/errors names and tags generated by the chosen integration. Java, Python and other integrations do not all emit trace.http.request.*. Trace analytics, generated trace metrics and custom DogStatsD metrics are different sources.
Watchdog and notification delivery
Watchdog can surface detected anomalies/insights without manually choosing every threshold. An insight is not proof that a notification was delivered. Use the supported Watchdog/monitor workflow and verify the event source, product availability and notification routing in the intended site.
The following event-monitor fragment assumes actual events matching source:watchdog exist in that organization. It does not invent a story_category group tag or guarantee every Watchdog result appears in this stream. Validate the filter against real events before enabling notifications.
resource "datadog_monitor" "watchdog_events" {
  name    = "Review matching Watchdog events"
  type    = "event-v2 alert"
  message = "Review the matching Watchdog event and affected services. Add an approved notification destination."
  query   = "events(\"source:watchdog\").rollup(\"count\").last(\"5m\") > 0"
  tags    = ["env:demo", "type:watchdog"]
}
SLO request construction
Metric-based SLOs need well-defined good/total counts. The helper below uses the explicit counters above. “Good” must match the application's SLI policy; counting only HTTP 2xx is not a universal availability definition. Validate zero-traffic and missing-data behavior rather than treating absence as 100% success.
from datadog_api_client.v1.model.service_level_objective_request import ServiceLevelObjectiveRequest


def build_success_slo():
    return ServiceLevelObjectiveRequest(
        name="Orders successful-request SLO",
        type="metric",
        description="Successful requests divided by all reported requests",
        query={
            "numerator": "sum:my_app.requests.good{env:demo,service:orders}.as_count()",
            "denominator": "sum:my_app.requests.total{env:demo,service:orders}.as_count()",
        },
        thresholds=[{"timeframe": "30d", "target": 99.9, "warning": 99.95}],
        tags=["env:demo", "service:orders"],
    )
This builds a request, not a live SLO. The configured caller can pass it to ServiceLevelObjectivesApi.create_slo after ownership, data and permissions are verified. Datadog also supports monitor-based and time-slice SLOs; choose the model that matches the SLI instead of forcing a gauge/restart total into a good-event count.
Cost Structure
Use the actual product and contract units
| Component | Inputs to estimate |
|---|---|
| Infrastructure | Billable hosts/containers or the applicable platform model, plan and commitment terms |
| APM | Billable APM hosts and selected plan/model, included allotments, ingested and indexed spans |
| Logs | Ingested volume plus indexing/retention/search/archive choices |
| Custom metrics / distributions | Distinct metric/tag combinations, enabled aggregations and applicable included volumes |
| Additional products | Profiling, network/security, serverless and other enabled product charges |
Do not combine every product into a universal Free/Pro/Enterprise table. The pricing page distinguishes products, annual/on-demand terms and attached versus standalone offerings. Retention for infrastructure metrics, searchable traces and indexed logs is not one common “15-month” setting.
For the old 100-node example, 50 services do not imply 50 APM hosts. Under a host-priced agreement, first determine the actual billable Infrastructure and APM host counts. For 100 GB/day over 30 days, log ingestion is 3,000 GB, but ingestion alone is not the total log bill.
Estimated cost =
  billable infrastructure units × applicable rate
  + billable APM units × applicable rate
  + ingested/indexed span overages under the contract
  + 3,000 GB × applicable log-ingestion rate
  + indexed events/retention/search/archive charges
  + custom-metric and other enabled-product charges
The previous ~$3,350 total used mismatched APM units and omitted billable dimensions. It was not a measured production bill. Use the current site/product quote and measured usage instead of treating that estimate as a budget guarantee.
Metrics, logs and trace controls do different things
dogstatsd.nonLocalTrafficcontrols receiver reachability; it is not a custom-metric quota. Closing a receiver can simply lose telemetry.ignoreAutoConfigdisables selected automatic checks. Container exclusion filters select containers; neither is a general tag-cardinality limiter.Review allowed metrics and tag values at their collection owner. Changing origin tag cardinality can change available grouping tags, so recheck monitors/SLOs.
Source-side log exclusion avoids sending selected records. Index exclusion happens later and does not erase ingestion costs. Preserve incident evidence and failures; do not drop every health-check line regardless of outcome.
Sampling and indexing/retention are separate.
DD_TRACE_SAMPLE_RATEor sampling rules depend on the library/version and matching scope. The documented PythonDD_TRACE_RATE_LIMITis per process and applies with configured sampling rules/rate, not a cluster-wide or dollar cap. A 10% trace rate does not imply a 90% reduction in the whole Datadog bill.
Best Practices
Use consistent service/env/version labels and bounded tags, with separate API-key ingestion and application-key automation permissions. Review application capture and secret/redaction paths before collecting all logs, process arguments or profiles. Monitor collector queues/drops and verify real outputs after changing filters.
Agree on alert severity, ownership and response targets with the operating team. P1/P2 labels in a runbook are an operational policy, not standalone Datadog resource definitions. Test actual destinations, missing data and recovery notifications. Use a documented SLI/SLO and traffic context rather than choosing thresholds only because they appear in a sample.
Troubleshooting
Start with the installation owner, actual pod/container names and intended site. Check literal native-backend handles, Secrets Manager IRSA and the required postrenderer, Agent/Cluster Agent health, Kubelet/RBAC access, scrape configuration and queued/dropped telemetry. This release's rendered node Agent pod has agent and trace-agent containers; the old app=datadog selector is not a reliable substitute for inspecting current labels.
kubectl get pods -n datadog \
  -l app.kubernetes.io/instance=datadog,app.kubernetes.io/component=agent -o wide

# Select the actual node Agent pod after inspecting the list.
: "${DD_AGENT_POD:?Set the node Agent pod name}"
kubectl exec -n datadog "$DD_AGENT_POD" -c agent -- agent status
kubectl logs -n datadog "$DD_AGENT_POD" -c agent --tail=100
kubectl logs -n datadog "$DD_AGENT_POD" -c trace-agent --tail=100

# Check new application pods without dumping credentials/environment values.
: "${APP_NAMESPACE:?Set the application namespace}"
: "${APP_POD:?Set the application pod name}"
kubectl get pod -n "$APP_NAMESPACE" "$APP_POD" \
  -o jsonpath='{.spec.initContainers[*].image}'
kubectl get pod -n "$APP_NAMESPACE" "$APP_POD" \
  -o jsonpath='{range .spec.containers[*]}{.name}{": "}{.env[*].name}{"\n"}{end}'

# Create a local diagnostic archive only; review it before any authorized sharing.
kubectl exec -n datadog "$DD_AGENT_POD" -c agent -- agent flare --local
For traces, verify real library injection/startup, the socket or host endpoint, permissions and consistent tags. A successful TCP check does not validate a UDS path or prove accepted trace payloads. Do not use env | grep DD_: it can disclose API/application keys or proxy credentials.
For logs, inspect the actual annotation/container identifier and file access, then collection exclusions, parsing and index filters. agent configcheck, status, logs and archives can expose configuration or application data; inspect/redact outputs before sharing them.
agent flare --local creates a local bundle for inspection. Upload or remote flare collection is a separate authorized support action. Built-in redaction is useful, but does not replace reviewing the archive for the data your application collected.
Validation scope
The audit used chart rendering and official schema/source inspection, local DogStatsD Unix datagrams, ddtrace 4.14.0 manual spans on Python 3.12 with export/telemetry disabled, dd-trace-api 1.66.0 compilation for Java 17 and synchronous MDC tests, and API client 2.60.0 request models/serialization. These checks did not call a Datadog tenant, install on EKS, execute an admission webhook, send traces/logs to SaaS, create dashboards/monitors/ SLOs, or measure costs.
Monitor query meaning was checked against the documented metric units and aggregation rules; no Datadog query engine or Terraform provider plan was invoked. Grok request schema is distinct from live parsing. Applications, credentials, traffic, runtime support and destination ownership remain deployment prerequisites.
References
- Kubernetes installation and version prerequisites
- Helm chart 3.244.0
- Agent 7.83.1 release
- Kubernetes distributions
- Kubelet metrics
- Kubernetes State Metrics Core
- System metrics
- AWS account integration
- Admission Controller
- Local SDK injection
- OpenMetrics on Kubernetes
- DogStatsD UDS
- Python tracing configuration
- Custom instrumentation
- Log parsing
- as_count monitor evaluation
- Metric-based SLOs
- Datadog pricing and billing FAQs
- Agent flare handling