Argo Rollouts Experiments Deep Dive
Supported Versions: Argo Rollouts 1.10.0 (historical 1.8.3/Kubernetes 1.33 report identified separately) Last Updated: September 11, 2026
Table of Contents
- What is an Experiment?
- Resource Hierarchy and Creation Chain
- Name Generation Rules
- Traffic Routing Behavior
- Measurement and Verdict: AnalysisRun
- Result Propagation and Rollout State Transitions
- Working Example
- Observing with the kubectl Plugin
- Verification Results
- Next Steps
- References
- Quiz
What is an Experiment?
An Experiment is an Argo Rollouts CRD that creates ephemeral ReplicaSets and runs analyses. It supports baseline/canary comparisons, pre-deployment checks, and experiments with real traffic. Creating separate ReplicaSets does not itself isolate production traffic. Explicitly design Service selectors, routers, and test traffic.
| Aspect | Canary step | Experiment step |
|---|---|---|
| Pods | Rollout canary ReplicaSet | Temporary Experiment ReplicaSets |
| Traffic | Pod-ratio approximation for basic canary; weighted routing when configured | Isolated or real traffic, according to Service/router configuration |
| Completion | Can become the new stable version | Replicas scale to zero under the cleanup-delay policy |
| Analysis | Version-specific quality metrics | Separate baseline/canary metrics and test traffic |
Both standalone Experiments and Rollout experiment steps are supported. specRef and weight belong to Rollout step templates. Standalone Experiments define selectors and Pod templates directly.
Resource Hierarchy and Creation Chain
When a Rollout reaches an experiment step, resources are created along this chain:
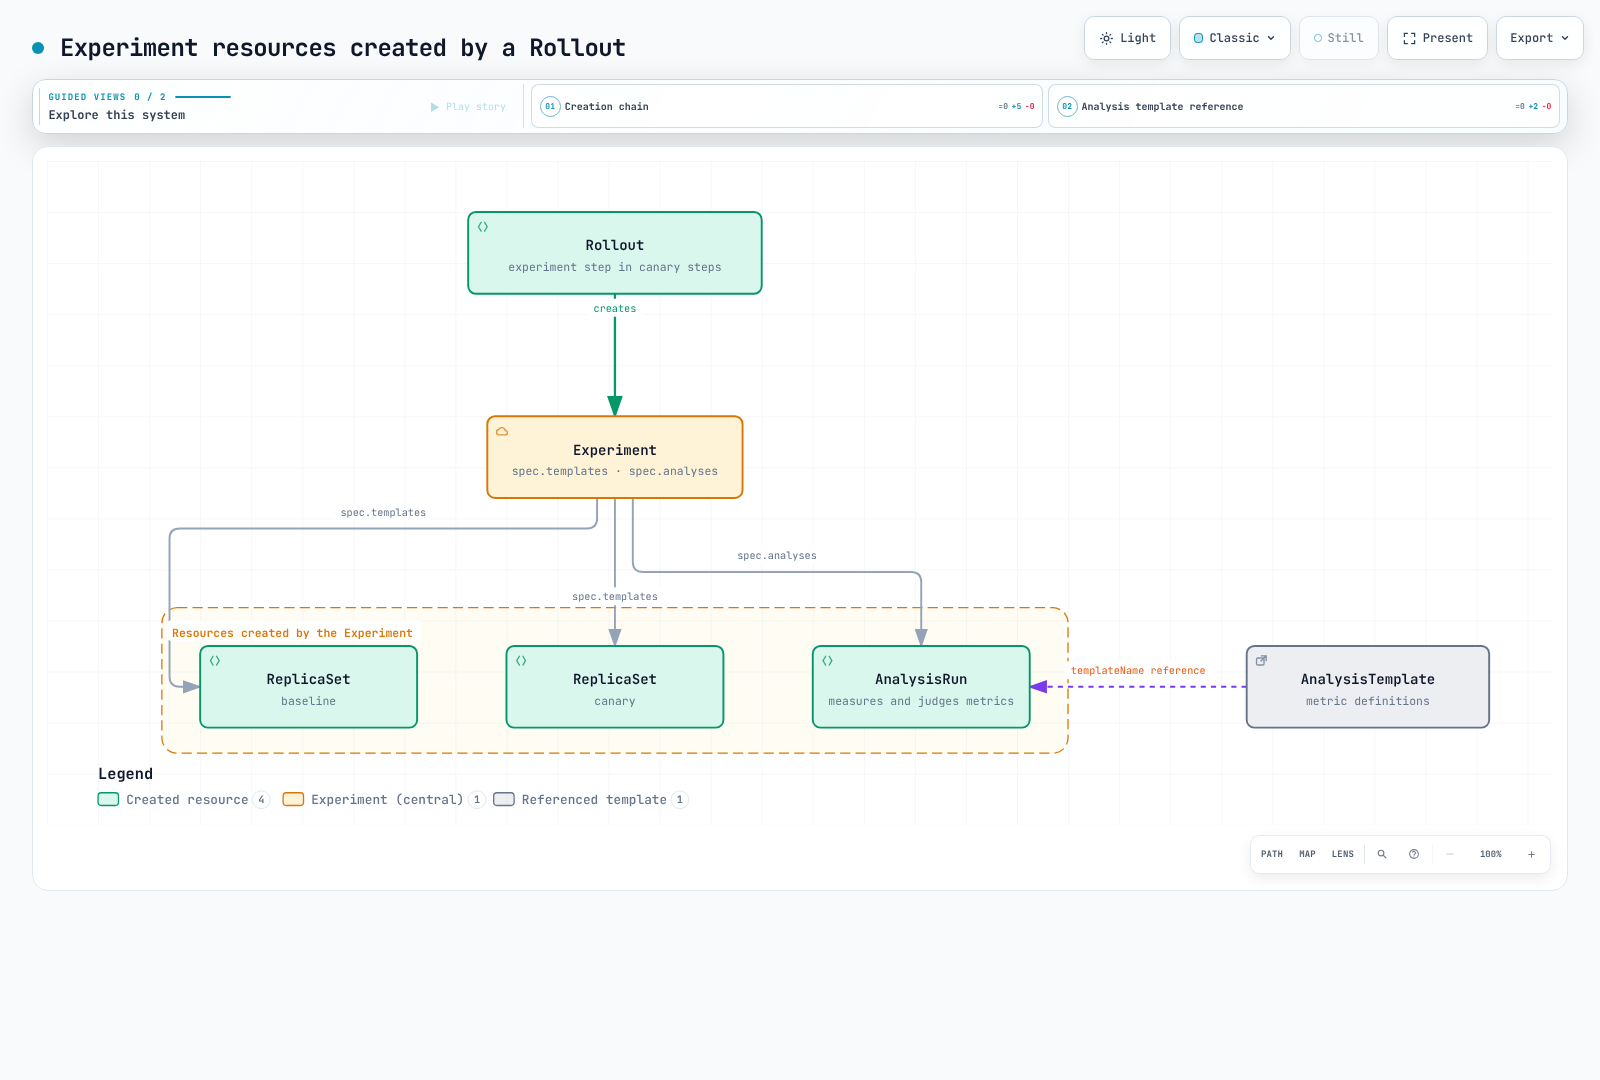
- An update reaching the experiment step creates an Experiment. Initial creation establishes stable and skips normal canary steps; observe the experiment on a subsequent Pod-template change.
- The controller creates a ReplicaSet per template and waits for its requested replicas to become available. Readiness/minReadySeconds matter; exceeding the progress deadline fails the experiment.
- When all are available, it records
status.availableAtand starts analysis. A configureddurationis measured from that point. - The completion result propagates: Successful advances, Failed/Error aborts, and Inconclusive pauses. ReplicaSet/Service cleanup is a separate reconciliation process.
Name Generation Rules
Experiment-family resources are named systematically so the owning Rollout, revision, and step can be traced from the name alone.
| Resource | Rule | Measured example |
|---|---|---|
| Experiment | <rollout-name>-<new-version PodTemplateHash>-<revision>-<step-index> | demo-app-74d8d8b4fb-2-0 |
| ReplicaSet | <experiment-name>-<template-name> | demo-app-74d8d8b4fb-2-0-baseline, demo-app-74d8d8b4fb-2-0-canary |
| AnalysisRun | <experiment-name>-<analysis-name> | demo-app-74d8d8b4fb-2-0-success-rate |
The examples above come from the experiment at step index 0 of the demo-app Rollout's revision 2 update. The tree output in Verification Results shows the actual hierarchy.
These are base names. Experiment/AnalysisRun name collisions can add numeric suffixes; use ownerReferences and status to find actual resources.
Traffic Routing Behavior
A production Service selecting only app: demo-app can also select experiment Pods. Inspect actual hash-specific selectors too; do not assume a separate hash always guarantees sufficient isolation. The example requires traffic-class: production on the production Service and overrides it to experiment on Experiment templates. Check other Services and mesh routes as well.
These are two alternatives for an entry in Rollout spec.strategy.canary.steps. Creating a Service does not automatically wire external traffic to it.
- experiment:
    duration: 1m
    templates:
    - name: baseline
      specRef: stable
      service: {}
    - name: canary
      specRef: canary
service: {}- experiment:
duration: 1m
templates:
- name: baseline
specRef: stable
weight: 5
- name: canary
specRef: canary
weight: 5service: {}creates a Service for that template. Its default name matches the ReplicaSet;service.namecan override it. Declared container ports must match the application’s actual listeners.weightis per template. Five means 5% with the default total weight of 100; check units when using a custommaxTrafficWeight. A weight also creates a Service.- Weighted Experiments require a supporting router. Version 1.10 documentation lists ALB/Istio/SMI. Ordinary canary weighting does not imply NGINX or every plugin supports Experiment traffic splitting.
Measurement and Verdict: AnalysisRun
AnalysisRuns evaluate provider results with conditions. This is an AnalysisTemplate spec fragment; the full provider is in the example below. Missing or out-of-range success rates make both conditions false and are Inconclusive. Invalid types, HTTP/collection failures, and expression errors follow the Error path.
metrics:
- name: success-rate
  interval: 15s
  count: 3
  successCondition: let payload = default(result, {}); payload?.status == 'ok' && payload?.success_rate != nil &&
    asFloat(payload.success_rate) >= 0.95 && asFloat(payload.success_rate) <= 1
  failureCondition: let payload = default(result, {}); payload?.status == 'ok' && payload?.success_rate != nil &&
    asFloat(payload.success_rate) >= 0 && asFloat(payload.success_rate) < 0.95
  failureLimit: 1
  inconclusiveLimit: 1
consecutiveErrorLimit: 2| Condition | Measurement result |
|---|---|
| failureCondition=true | Failed, taking precedence over success |
| successCondition=true, failureCondition=false | Successful |
| Both false | Inconclusive |
| Provider or expression error | Error |
With only a success condition, false means Failed. With only a failure condition, false means Successful. With neither condition, a measurement without a collection error is Successful.
| Field | Meaning | Result when exceeded |
|---|---|---|
| failureLimit | Allowed Failed measurements | Failed |
| inconclusiveLimit | Allowed Inconclusive measurements | Inconclusive |
| consecutiveErrorLimit | Allowed consecutive Errors, default 4 | Error |
failureLimit: 1 is exceeded by the second failed measurement. count counts measurements, not HTTP requests. Interval without count repeats indefinitely; omitting both means one measurement. Three overlapping metric windows are not three independent samples.
Result Propagation and Rollout State Transitions
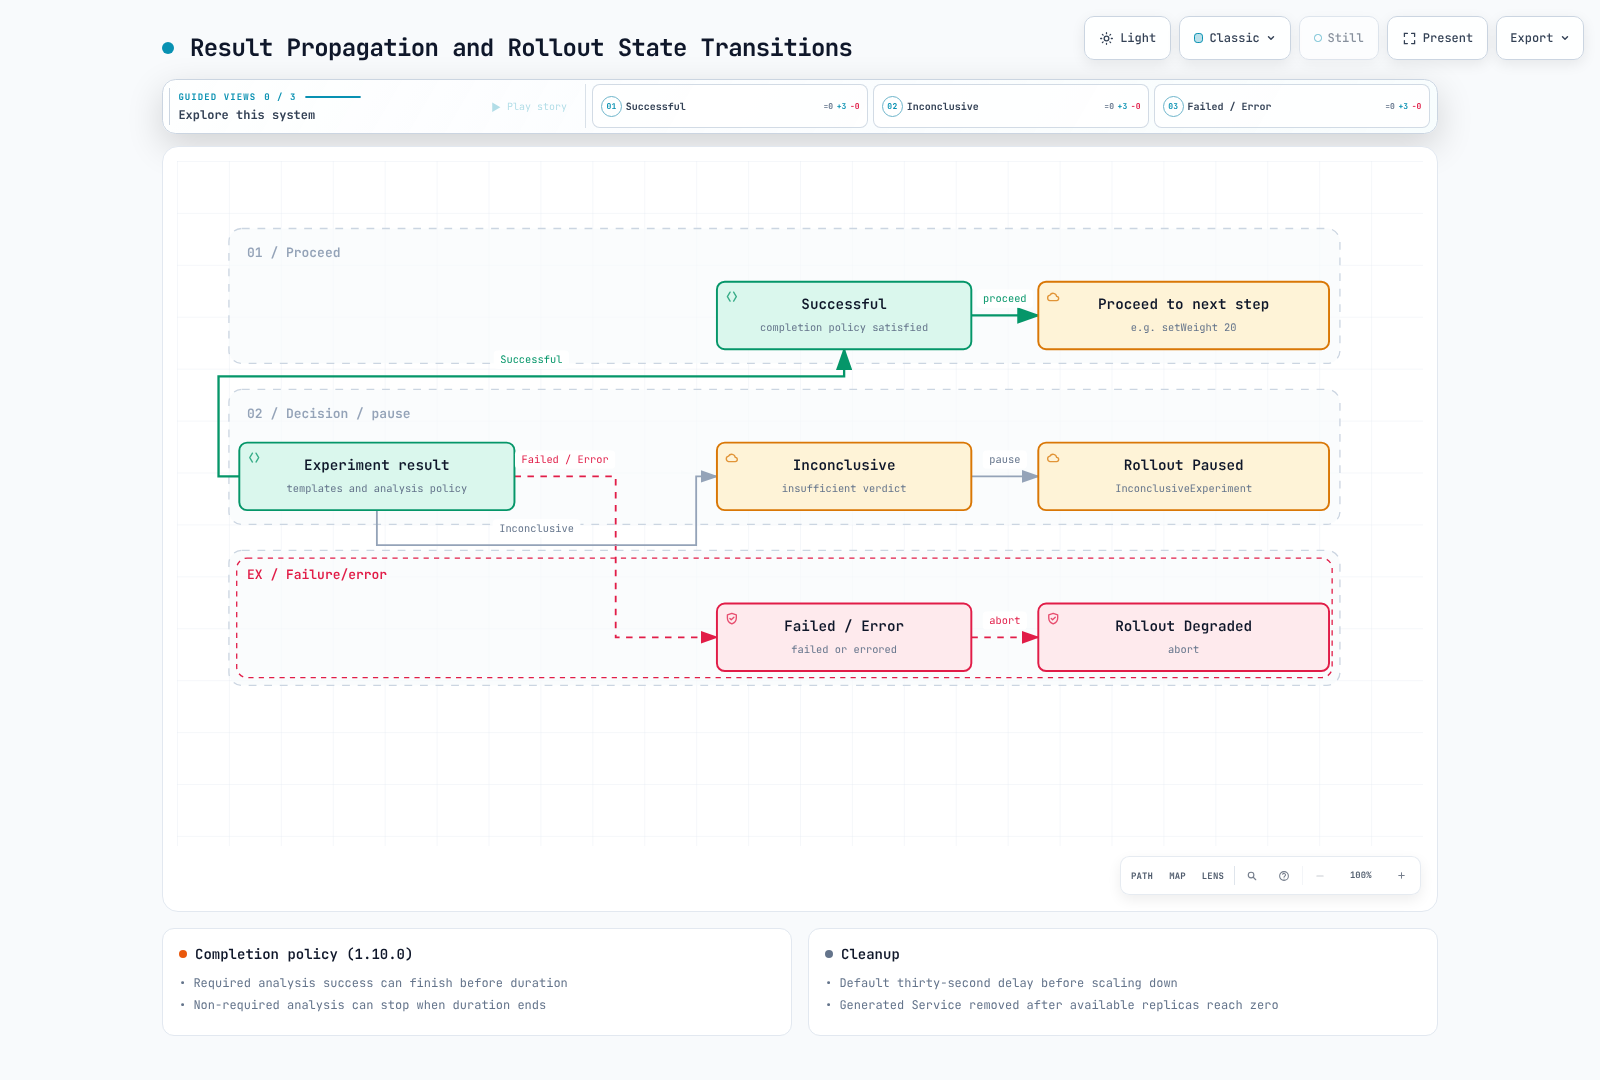
| Experiment result | Rollout behavior |
|---|---|
| Successful | Advance to the next step |
| Failed / Error | Abort/Degraded; restore stable under configured routing/replica policies |
| Inconclusive | Pause with InconclusiveExperiment; investigate and make an operator decision |
Version 1.10 does not unconditionally wait for duration AND analysis. All required analyses succeeding can finish the Experiment before duration elapses. Remaining required analyses can keep it running past duration; non-required analyses may be terminated when duration ends. With neither duration nor required analysis, it runs until explicitly terminated. The example omits duration and uses finite-count required analysis for completion.
scaleDownDelaySeconds defaults to thirty seconds. Terminal status, zero Pods, and Service deletion are not simultaneous guarantees. The controller scales down after the delay and removes generated Services once available replicas reach zero. ReplicaSet/AnalysisRun objects can remain under history/GC policies. Abort does not undo database changes or external side effects.
Working Example
This is an educational control-flow example. Install Rollouts 1.10.0/CRDs and the plugin, and separately provide an HTTP Service named metrics-mock in namespace demo returning the JSON below. Its server implementation is not included, so applying these manifests alone does not guarantee success. Fixed mock values do not measure baseline/canary quality or real traffic ratios.
{"status":"ok","success_rate":0.99}apiVersion: v1
kind: Namespace
metadata:
name: demo
---
apiVersion: v1
kind: Service
metadata:
name: demo-production
namespace: demo
spec:
selector:
app: demo-app
traffic-class: production
ports:
- name: http
port: 9898
targetPort: http
---
apiVersion: argoproj.io/v1alpha1
kind: AnalysisTemplate
metadata:
name: success-rate-check
namespace: demo
spec:
metrics:
- name: success-rate
interval: 15s
count: 3
successCondition: let payload = default(result, {}); payload?.status == 'ok' && payload?.success_rate != nil
&& asFloat(payload.success_rate) >= 0.95 && asFloat(payload.success_rate) <= 1
failureCondition: let payload = default(result, {}); payload?.status == 'ok' && payload?.success_rate != nil
&& asFloat(payload.success_rate) >= 0 && asFloat(payload.success_rate) < 0.95
failureLimit: 1
inconclusiveLimit: 1
consecutiveErrorLimit: 2
provider:
web:
url: http://metrics-mock.demo.svc.cluster.local/metrics.json
jsonPath: '{$}'
---
apiVersion: argoproj.io/v1alpha1
kind: Rollout
metadata:
name: demo-app
namespace: demo
spec:
replicas: 3
revisionHistoryLimit: 3
progressDeadlineSeconds: 180
selector:
matchLabels:
app: demo-app
strategy:
canary:
steps:
- experiment:
scaleDownDelaySeconds: 30
templates:
- name: baseline
specRef: stable
replicas: 1
metadata:
labels:
traffic-class: experiment
experiment-role: baseline
service: {}
- name: canary
specRef: canary
replicas: 1
metadata:
labels:
traffic-class: experiment
experiment-role: canary
service: {}
analyses:
- name: success-rate
templateName: success-rate-check
requiredForCompletion: true
- setWeight: 20
- pause:
duration: 10s
template:
metadata:
labels:
app: demo-app
traffic-class: production
annotations:
demo-revision: v1
spec:
containers:
- name: app
image: ghcr.io/stefanprodan/podinfo:6.15.0
ports:
- name: http
containerPort: 9898
readinessProbe:
httpGet:
path: /readyz
port: http
resources:
requests:
cpu: 50m
memory: 64Mi
limits:
cpu: 500m
memory: 128MiAfter applying the file and establishing the first stable revision in a dedicated lab cluster, change the Pod-template annotation to exercise the experiment step. This demonstrates controller flow, not a new image’s quality. For Argo CD-managed resources, make the change in Git instead of patching live state. A mock rate of 0.99 exercises success, 0.50 exceeds failureLimit and aborts, and a missing rate exercises Inconclusive pause. Review the lab resource cleanup scope afterward.
kubectl argo rollouts status demo-app -n demo --timeout=180s
# A second Pod-template revision exercises the steps; the image stays unchanged in this demo.
kubectl patch rollout demo-app -n demo --type merge \
  -p '{"spec":{"template":{"metadata":{"annotations":{"demo-revision":"v2"}}}}}'
kubectl argo rollouts get rollout demo-app -n demo --watch
setWeight: 20 is a Pod-ratio approximation without trafficRouting. Three replicas cannot guarantee exactly 20% of user requests. Real comparisons require test traffic, instrumentation/scraping, sufficient samples, and the following Experiment ReplicaSet hash arguments. These are not podTemplateHashValue: Baseline/Canary fields.
args:
- name: baseline-hash
  value: '{{templates.baseline.podTemplateHash}}'
- name: canary-hash
  value: '{{templates.canary.podTemplateHash}}'
See the metric comparison example.
Observing with the kubectl Plugin
kubectl argo rollouts get rollout <name> --watch shows the entire Experiment hierarchy (Experiment → ReplicaSets → Pods, plus the AnalysisRun) live. The output below is the original document’s historical 1.8.3 record, not a fresh run of the current example. Do not interpret its names, times, or cleanup timing as new 1.10.0 results.
$ kubectl argo rollouts get rollout demo-app -n demo
Name:            demo-app
Namespace:       demo
Status:          ◌ Progressing
Strategy:        Canary
  Step:          0/3
  SetWeight:     0
  ActualWeight:  0

NAME                                                  KIND         STATUS         AGE  INFO
⟳ demo-app                                            Rollout      ◌ Progressing  51s
├──# revision:2
│  ├──⧉ demo-app-74d8d8b4fb                           ReplicaSet   • ScaledDown   29s  canary
│  └──Σ demo-app-74d8d8b4fb-2-0                       Experiment   ◌ Running      29s
│     ├──⧉ demo-app-74d8d8b4fb-2-0-baseline           ReplicaSet   ✔ Healthy      29s
│     │  └──□ demo-app-74d8d8b4fb-2-0-baseline-gvgnq  Pod          ✔ Running      29s  ready:1/1
│     ├──⧉ demo-app-74d8d8b4fb-2-0-canary             ReplicaSet   ✔ Healthy      29s
│     │  └──□ demo-app-74d8d8b4fb-2-0-canary-jq6lb    Pod          ✔ Running      29s  ready:1/1
│     └──α demo-app-74d8d8b4fb-2-0-success-rate       AnalysisRun  ◌ Running      29s  ✔ 2
└──# revision:1
   └──⧉ demo-app-779c8779bf                           ReplicaSet   ✔ Healthy      51s  stable
The historical trace shows revision 2’s main ReplicaSet scaled down. That does not prove there is no production exposure under other step orders or Service/router configurations. The AnalysisRun keeps its measurement history in its status for post-hoc analysis:
$ kubectl get analysisrun demo-app-74d8d8b4fb-2-0-success-rate -n demo \
    -o jsonpath='{.status.metricResults[0]}' | python3 -m json.tool
{
    "consecutiveSuccess": 2,
    "count": 2,
    "measurements": [
        {
            "finishedAt": "2026-07-17T01:24:09Z",
            "phase": "Successful",
            "value": "{\"error_rate\":0.004,\"status\":\"ok\",\"success_rate\":0.99}"
        },
        ...
    ],
    "name": "success-rate",
    "phase": "Running",
    "successful": 2
}
Verification Results
The original document reported these results from a 1.8.3 source build and Kubernetes 1.33/kwok (real control-plane binaries, simulated node/Pod lifecycles). Complete executed manifests, raw API dumps, and logs are not attached, so this review could not reproduce the report. These are historical observations, not fresh 1.10.0 results or evidence of real traffic, Pod readiness, or application quality.
| Historical item | Original report |
|---|---|
Experiment auto-created at the experiment step, name = <rollout>-<PodHash>-<revision>-<step> | Reported: demo-app-74d8d8b4fb-2-0 (revision 2, step 0) |
ReplicaSets created from templates, name = <experiment>-<template> | Reported: ...-2-0-baseline, ...-2-0-canary, 1 replica each |
Experiment-scoped Service for the template with service: {} created and cleaned up | Reported: ...-2-0-canary Service created, confirmed deleted after the experiment |
AnalysisRun created after all templates healthy; repeated measurements at interval: 15s/count: 3 | Reported: 3 measurements recorded 15s apart, successCondition evaluated Successful |
| Success path: 60s duration elapsed → Experiment Successful → experiment RSes scaled to 0 → next step (setWeight 20) → Rollout Healthy | Reported: Works |
Failure path: degraded metrics → AnalysisRun Failed with failed (2) > failureLimit (1) → Experiment Failed → Rollout aborted (Degraded), stable preserved | Reported: Works — the abort message names the offending metric verbatim |
Next Steps
Traffic Management: combine experiment steps with canary/blue-green strategies and ingress integrations.
Best Practices: learn progressive delivery operational best practices.
References
Quiz
Test what you've learned in this chapter with the Rollouts Experiments Quiz.