Metrics Overview
Last Updated: September 13, 2026. Examples were checked locally with Prometheus 3.14.0 tooling; no cluster or cloud deployment was performed.
Table of Contents
- Metrics Fundamentals
- Metric Types
- Pull vs Push Model
- Cardinality and Metric Design
- Long-term Storage Requirements
- Solution Comparison
- Metrics Collection Architecture
Metrics Fundamentals
Metrics describe system state and behavior numerically. A metric name and its complete label set identify a time series; each sample adds a value and a timestamp. Metrics support alerting, troubleshooting, capacity planning and performance analysis, but a sampled measurement does not preserve every individual event.
For example, http_requests_total names a request counter; method="GET" and status="200" distinguish populations. The sample value is the accumulated count. Target labels such as job and instance are normally added during scraping.
Timestamps depend on the format. An explicit timestamp in legacy Prometheus text exposition is Unix milliseconds, whereas OpenMetrics uses Unix seconds. Exporters normally omit explicit sample timestamps so Prometheus assigns the scrape time. Do not treat one unit as universal across telemetry protocols.
Naming and units
| Example | Interpretation |
|---|---|
http_requests_total | Counter; _total indicates a cumulative count, not a physical unit |
http_request_duration_seconds | Duration in a base unit |
node_memory_MemAvailable_bytes | Existing node-exporter metric; retain its published spelling |
requests | Too little context for a new application metric |
httpRequestDurationMs | Does contain a unit, but uses camelCase and milliseconds rather than the usual Prometheus naming/base-unit convention |
For new metrics, prefer descriptive prefixes, lowercase words separated by underscores, and units such as _seconds or _bytes. A naming convention does not authorize renaming an exporter's established API.
The following text blocks are synthetic Prometheus text exposition, not YAML. Query expressions are separate promql blocks. Query selectors assume the shown scrape-job names; adapt them to your actual target labels.
Metric Types
Prometheus client libraries commonly expose Counter, Gauge, Histogram and Summary. Select the type from the meaning of the measurement, not merely from which query happens to accept its samples.
1. Counter
A counter accumulates nonnegative increments, such as requests, errors or completed tasks. It can reset when the measured process/state is recreated; not every exporter restart necessarily resets the underlying counter.
# TYPE http_requests_total counter
http_requests_total{method="GET",endpoint="/api/users",status="200"} 12345
http_requests_total{method="POST",endpoint="/api/users",status="500"} 23
Per-series rate, service-wide rate and estimated increase:
rate(http_requests_total{job="example-app"}[5m])sum(rate(http_requests_total{job="example-app"}[5m]))increase(http_requests_total{job="example-app"}[1h])rate() accounts for observed counter resets and extrapolates over the requested window. It cannot recover increments lost between observations. increase() can therefore return a fractional estimate even for an integer counter. Apply rate() before aggregating so a reset in one instance is not hidden by growth in another.
2. Gauge
A gauge represents current state and can rise or fall. These values illustrate real node-exporter and kube-state-metrics names alongside an application-defined temperature metric.
# TYPE node_memory_MemAvailable_bytes gauge
node_memory_MemAvailable_bytes 8589934592
# TYPE node_memory_MemTotal_bytes gauge
node_memory_MemTotal_bytes 17179869184
# TYPE kube_pod_status_ready gauge
kube_pod_status_ready{namespace="example-app",pod="example-0",uid="00000000-0000-4000-8000-000000000001",condition="true"} 1
# TYPE temperature_celsius gauge
temperature_celsius{location="datacenter-1"} 23.5100 * (1 - node_memory_MemAvailable_bytes{job="node-exporter"} / node_memory_MemTotal_bytes{job="node-exporter"})max_over_time(temperature_celsius{job="example-app"}[1h])The memory expression is the share not reported as MemAvailable; it is not an application's resident-memory measurement. Pod readiness uses a particular condition series: a value of one on condition="false" has a different meaning from one on condition="true".
3. Histogram
A classic histogram counts observations into cumulative buckets in the instrumented application/exporter. Prometheus calculates quantiles later. le is an inclusive upper bound, and the +Inf bucket equals _count.
# TYPE http_request_duration_seconds histogram
http_request_duration_seconds_bucket{le="0.005"} 24054
http_request_duration_seconds_bucket{le="0.01"} 33444
http_request_duration_seconds_bucket{le="0.025"} 100392
http_request_duration_seconds_bucket{le="0.05"} 129389
http_request_duration_seconds_bucket{le="0.1"} 133988
http_request_duration_seconds_bucket{le="0.25"} 144320
http_request_duration_seconds_bucket{le="+Inf"} 144320
http_request_duration_seconds_sum 4800.8625
http_request_duration_seconds_count 144320
This is an illustrative distribution, not a benchmark. Its 144,320 observations total 4,800.8625 seconds. The old sum of 53.42 seconds was inconsistent with the displayed bucket counts, which imply a lower bound above 2,704 seconds. The finite 0.25-second bucket also prevents the example's p95 from falling only in the unbounded bucket.
Fleet-wide p95 and mean for matching bucket layouts:
histogram_quantile(0.95, sum by (le) (rate(http_request_duration_seconds_bucket{job="example-app"}[5m])))sum(rate(http_request_duration_seconds_sum{job="example-app"}[5m])) / sum(rate(http_request_duration_seconds_count{job="example-app"}[5m]))Keep le when aggregating classic buckets. Quantiles interpolate within buckets; their accuracy depends on the distribution and bucket resolution. Changing classic bucket boundaries is an instrumentation change, not a query-only edit.
Native histograms represent the distribution differently. Current Prometheus guidance prefers them when the client, scrape protocol and storage/query pipeline support them. Verify compatibility and configuration through the entire path; the classic examples here are not native-histogram wire output.
4. Summary
A summary may calculate configured quantiles over a client-side window. Those values are generally approximations with algorithm/window-dependent error, not exact quantiles. Library support differs; a Summary implementation may expose only sum/count.
# TYPE rpc_request_duration_seconds summary
rpc_request_duration_seconds{quantile="0.5"} 0.052
rpc_request_duration_seconds{quantile="0.9"} 0.089
rpc_request_duration_seconds{quantile="0.99"} 0.245
rpc_request_duration_seconds_sum 29969.50
rpc_request_duration_seconds_count 562887rpc_request_duration_seconds{job="example-app",quantile="0.99"}sum(rate(rpc_request_duration_seconds_sum{job="example-app"}[5m])) / sum(rate(rpc_request_duration_seconds_count{job="example-app"}[5m]))The first expression returns each matching instance's reported p99. Averaging or summing those p99 values does not produce a fleet p99. The second expression legitimately aggregates nonnegative-duration _sum and _count rates to calculate a fleet mean.
| Question | Classic Histogram | Summary with quantiles |
|---|---|---|
| Where is the distribution processed? | Buckets at instrumentation; quantile at query time | Quantile at instrumentation |
| Can instances be combined? | Compatible buckets can be aggregated | Quantiles cannot; sum/count can |
| Error depends on | Bucket resolution and observations | Client algorithm, objective and time window |
| Can a different percentile/window be queried later? | From retained bucket samples | Not from only the precomputed quantile |
For zero traffic the mean can be NaN; absent series can produce an empty result. Neither should silently become evidence of healthy traffic.
Pull vs Push Model
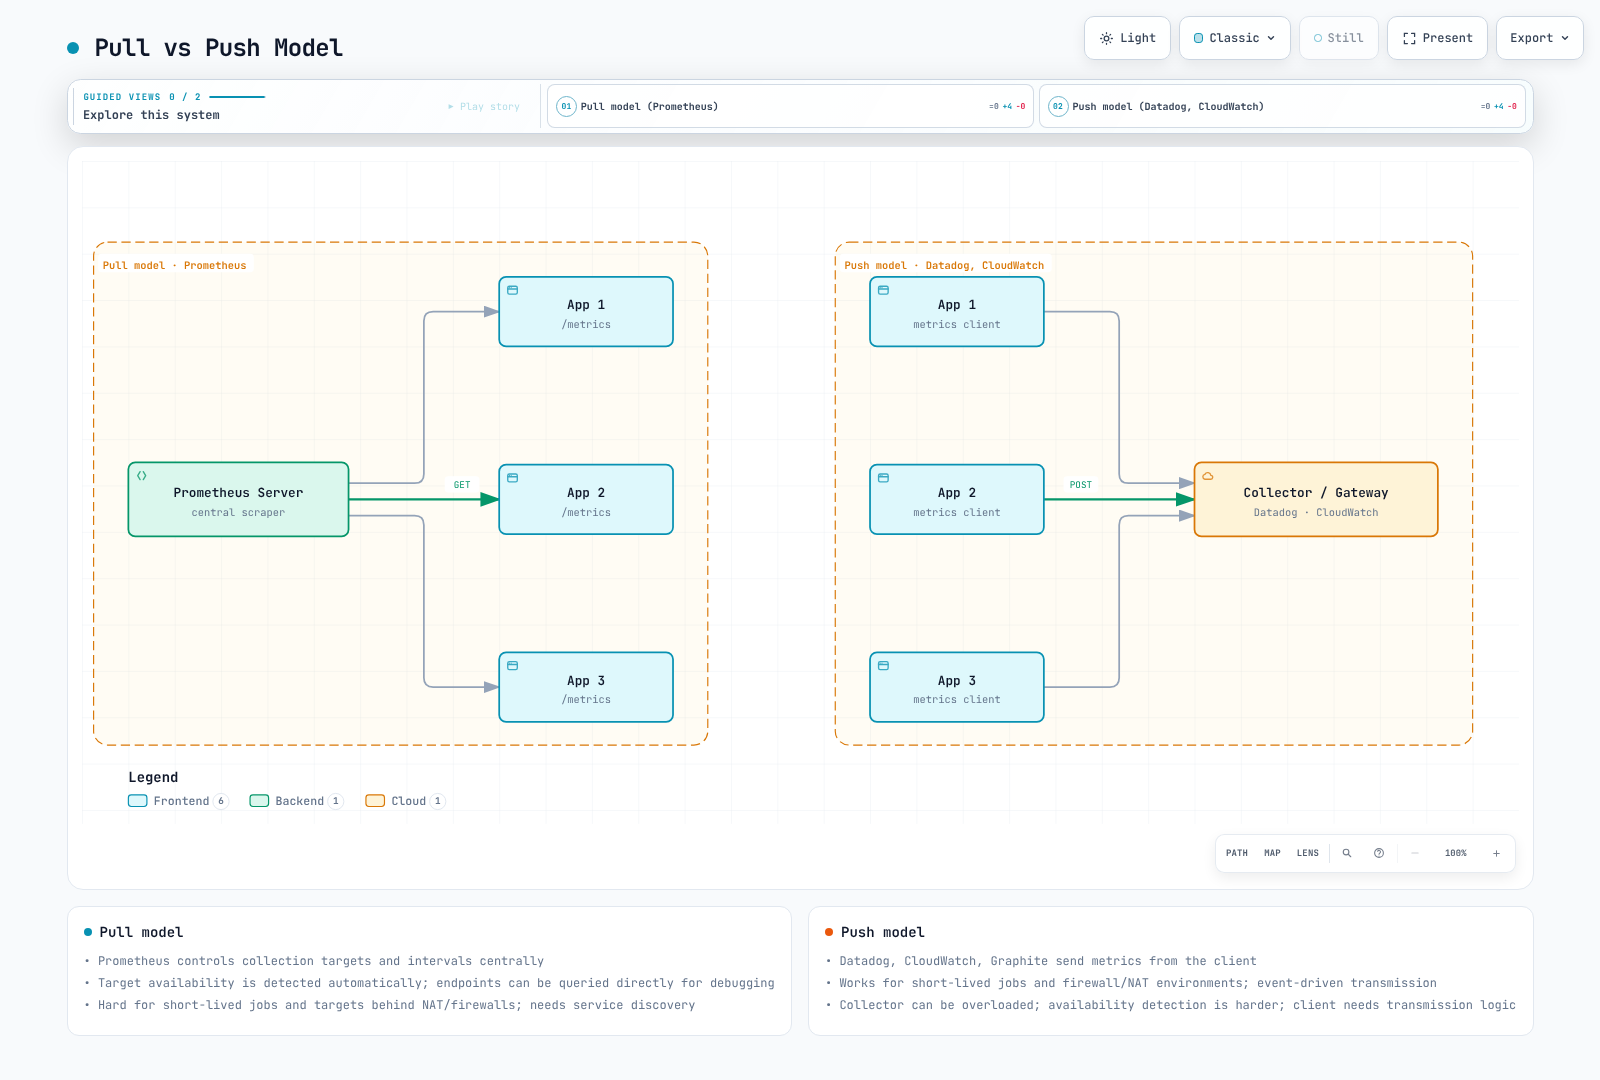
The figure illustrates connection direction. Real pipelines can mix both models: an agent can scrape endpoints and forward the results. Vendor names do not imply that every integration uses one model.
Pull and Kubernetes discovery
Pull collection centrally controls targets and intervals and makes endpoints easy to inspect. The collector needs outbound connectivity and the target needs permitted inbound access, with routing, TLS and authorization configured. NAT does not automatically make a target reachable. Prometheus up reports scrape success; it is not the application's availability SLO.
This Prometheus configuration fragment selects Running Pods in example-app with an opted-in, named TCP metrics container port. It uses the discovered address rather than rewriting it with an IPv4-only regular expression.
# pod-scrape.yaml
scrape_configs:
- job_name: example-app
  kubernetes_sd_configs:
  - role: pod
    namespaces:
      names:
      - example-app
  relabel_configs:
  - source_labels:
    - __meta_kubernetes_pod_annotation_prometheus_io_scrape
    action: keep
    regex: 'true'
  - source_labels:
    - __meta_kubernetes_pod_phase
    action: keep
    regex: Running
  - source_labels:
    - __meta_kubernetes_pod_container_port_name
    action: keep
    regex: metrics
  - source_labels:
    - __meta_kubernetes_pod_container_port_protocol
    action: keep
    regex: TCP
  - source_labels:
    - __meta_kubernetes_pod_annotation_prometheus_io_path
    action: replace
    target_label: __metrics_path__
    regex: (.+)
  - source_labels:
    - __meta_kubernetes_namespace
    target_label: namespace
  - source_labels:
    - __meta_kubernetes_pod_name
    target_label: pod
Prerequisites: the Pod annotation prometheus.io/scrape: "true", a declared port named metrics, an optional prometheus.io/path, and Prometheus Kubernetes API credentials/RBAC to discover these Pods. The endpoint must actually serve metrics on that port/path. This is a configuration fragment, not a cluster installation or proof of reachability.
Push and service-level batch jobs
Push can fit producers with outbound access, including some short-lived workloads. It still requires receiver capacity, authentication, timeout/retry handling and a way to detect missing producers. A successful receiver health check is not proof that a batch job ran.
Prometheus recommends Pushgateway for limited service-level batch use cases, not as the default for every short-lived Pod. Pushed groups do not expire automatically. Avoid per-Pod HOSTNAME grouping that leaves abandoned groups; define stable job ownership and an explicit retirement/cleanup process.
The following is a post-success integration fragment for one logical batch, not a runnable Kubernetes Job. It assumes a reachable, authorized Pushgateway, sh, awk and curl. The batch supplies its measured duration, processed-record count and original completion timestamp. If delivery is retried, retain that original timestamp. Add environment-appropriate TLS/authentication without embedding secrets in examples.
set -eu
: "${PUSHGATEWAY_URL:?Set the reachable authorized Pushgateway base URL}"
: "${DURATION_SECONDS:?Set the measured duration of the successful batch}"
: "${RECORDS_PROCESSED:?Set the number of records processed by that batch}"
: "${COMPLETED_AT_SECONDS:?Set its original Unix completion time in seconds}"

# Reject nonnumeric metric values before sending anything.
awk -v n="$DURATION_SECONDS" 'BEGIN { exit !(n ~ /^[0-9]+([.][0-9]+)?$/) }'
case "$RECORDS_PROCESSED" in *[!0-9]*|'') exit 2;; esac
case "$COMPLETED_AT_SECONDS" in *[!0-9]*|'') exit 2;; esac

cat <<EOF | curl --fail --silent --show-error --connect-timeout 5 --max-time 15 \
  --request PUT --data-binary @- "${PUSHGATEWAY_URL%/}/metrics/job/example_batch"
# TYPE example_batch_last_run_duration_seconds gauge
example_batch_last_run_duration_seconds ${DURATION_SECONDS}
# TYPE example_batch_last_run_records_processed gauge
example_batch_last_run_records_processed ${RECORDS_PROCESSED}
# TYPE example_batch_last_success_timestamp_seconds gauge
example_batch_last_success_timestamp_seconds ${COMPLETED_AT_SECONDS}
EOF
PUT replaces this stable grouping key's metrics. Independent jobs must not compete for the same key. Do not push a success timestamp after failed work, or delete the group after every successful run before it can be scraped. When the logical job is retired, remove its owned group deliberately.
Scrape the Pushgateway with honor_labels so the pushed job identity is retained:
# pushgateway-scrape.yaml
scrape_configs:
- job_name: pushgateway
  honor_labels: true
  static_configs:
  - targets:
    - pushgateway:9091
Age of the last successful completion, in seconds:
time() - max(example_batch_last_success_timestamp_seconds{job="example_batch"})Choose a threshold from the schedule and expected runtime, and handle an entirely missing series separately. up for Pushgateway only describes the gateway scrape.
Cardinality and Metric Design
Cardinality is the number of distinct series in a defined scope. The product of label-value counts is an upper bound if every combination can occur, not a guarantee that all combinations exist.
Five methods × twenty normalized routes × ten statuses gives at most 1,000 application label combinations. Target/replica labels and classic histogram buckets plus sum/count can multiply that count. Series churn also adds historical storage and index cost.
Use bounded route templates such as /users/{id}. Avoid user IDs, request IDs, session IDs and changing timestamps as ordinary metric labels; they also risk exposing sensitive data. Group status codes only when the lost detail is acceptable. Put request-specific context in appropriately controlled logs/traces instead.
These scoped queries count currently selectable series, not every historical series stored in the TSDB:
topk(10, count by (__name__) ({job="example-app"}))count(http_requests_total{job="example-app"})count(count by (endpoint) (http_requests_total{job="example-app"}))Metric and label name/value lengths still affect format limits, storage and backend acceptance. Cardinality is important, but it is not the only design constraint.
Long-term Storage Requirements
Prometheus local TSDB uses compression and can retain data for much longer than 30 days when configured and provisioned accordingly. Its default time retention is 15 days when no time/size retention setting is supplied; that is not a maximum.
Local storage is not a replicated distributed store. Independent Prometheus replicas can provide collection/alerting redundancy without requiring Thanos or Mimir, but shared querying, deduplication, remote durability and recovery need their own design. Long-range query cost depends on data volume and the expression, not merely on calendar age.
Retention planning
| Need | Planning question |
|---|---|
| Alert evaluation | Which lookback windows, outage buffers and missing-data behavior are required? |
| Incident analysis | How long must useful resolution remain available? |
| Capacity/seasonality | Are several months or a year-over-year comparison needed? |
| Audit obligations | Which actual policy applies to this data, access and deletion? |
| Recovery | Are backups, restore tests and independent failure domains required? |
There is no universal “metrics must be kept for 1–7 years” rule. Specify retention and resolution, deletion/access policy and recovery objectives for the workload.
Remote write
This fragment targets an already deployed single-node VictoriaMetrics receiver. Merge it with reviewed scrape configuration. A cluster receiver uses a different path/topology; a tenant ID by itself is not authentication. Use an authorized, TLS-protected endpoint as appropriate for the environment.
# remote-write.yaml
global:
  scrape_interval: 15s
remote_write:
- url: http://victoriametrics:8428/api/v1/write
  queue_config:
    capacity: 10000
    max_samples_per_send: 2000
    max_shards: 10
  write_relabel_configs:
  - source_labels:
    - __name__
    regex: example_debug_payload_total
    action: drop
The example retains the documented queue/batch defaults of 10,000/2,000; max_shards: 10 is an illustrative concurrency cap, not a measured optimum. Queue memory grows with shards and capacity. The tuning guide suggests capacity around 3–10 times the batch size; start from defaults and measure backlog, throughput and memory.
The explicit drop rule illustrates excluding one reviewed debug metric from remote delivery; it does not remove local samples. Dropping all go_.* metrics is not a general cardinality remedy and discards runtime diagnostics.
Remote write is asynchronous and its WAL buffering is finite. The Prometheus tuning guide describes loss of unsent data after an extended outage beyond the documented WAL window (about two hours in that guidance). It is not a backup or a guarantee that delivery always succeeds.
Solution Comparison
Deployment and operational boundaries
| Option | What to evaluate |
|---|---|
| Prometheus server | Local TSDB, PromQL and rules; retention/capacity, independent replicas and recovery |
| VictoriaMetrics | Single-node versus cluster deployment; MetricsQL/PromQL compatibility, storage capacity, tenant authorization, replication and edition-specific features |
| Grafana Mimir | Distributed services and object storage; local/ingest resources, replication, tenant authentication, limits and operational capacity |
| CloudWatch metrics | AWS-managed metric storage, metric math/Metrics Insights and relevant integrations; dimensions, query product, quotas and resolution |
| Datadog metrics | SaaS plus agents/integrations; tag cardinality, product entitlements, query rollups and billing |
Object storage does not imply unlimited scaling or eliminate every local-disk requirement. VictoriaMetrics backup targets and features of particular editions are not interchangeable with the primary storage architecture. Benchmark compression claims such as “7×” need a named dataset, version and method; none is asserted here.
For traditional CloudWatch metrics, resolution changes with age: sub-minute points are available for three hours, one-minute points for 15 days, five-minute points for 63 days, and hourly points for 455 days. Other metric products/ingestion paths must be checked separately. Datadog's published retention table lists metric tags/values for 15 months, but queries apply rollups; that does not promise original scrape resolution in every graph.
Cost inputs, not unsupported monthly totals
If one million is the actual exported series count, a uniform 15-second interval over 30 days produces 1,000,000 × 30 × 86,400 / 15 = 172,800,000,000 samples before delivery filtering/deduplication. If the million refers only to application label combinations, expand targets, replicas and histogram series first.
| Option | Inputs needed for an estimate |
|---|---|
| Self-managed storage | CPU/RAM, measured bytes per sample, indexes/WAL/headroom, replicas, storage/network, backup and operator time |
| Amazon Managed Service for Prometheus | Ingested samples, storage, query processing, chosen collection features and regional prices |
| CloudWatch | Billable metric/dimension combinations, resolution, API/query and selected observability features |
| Datadog | Selected plans, hosts/containers, included and additional custom metrics, tags and other enabled products |
Compare equivalent ingestion, retention, HA and feature assumptions. Obtain current prices from the official pricing pages below and test workload-specific resource use. “Open source” does not make infrastructure and operations free.
Select a solution from required queries/resolution, cardinality and churn, failure/recovery goals, tenant/access boundaries, integrations and a measured cost model. Team size alone is not a product-selection algorithm.
Metrics Collection Architecture
Separate collection, storage/query, rule evaluation and notification responsibilities:
| Component | Role |
|---|---|
| node-exporter | Host OS metrics such as memory, filesystem and network counters |
| kube-state-metrics | Kubernetes API object state; not a substitute for container CPU measurements |
| kubelet/cAdvisor endpoints | Container resource measurements; endpoint availability and scrape authorization require verification |
| metrics-server | Resource Metrics API for autoscaling and kubectl top; not a historical Prometheus TSDB |
| Prometheus | Scrape, local storage/query and rule evaluation |
| vmagent | Collect and forward metrics, with buffering; not a queryable Prometheus TSDB |
| VictoriaMetrics / Mimir | Store and query metrics according to their deployment architecture |
| Prometheus rules / vmalert / Mimir ruler | Evaluate expressions and send alerts to Alertmanager |
| Alertmanager | Group, route, inhibit and deliver alerts; it does not query a TSDB to evaluate PromQL |
| Grafana | Query configured data sources and visualize results |
Plan discovery, RBAC, credentials, TLS and network access for each connection. Scraping more endpoints is not a substitute for defining which signals answer the workload's questions.
Primary References
- Prometheus metric types, histograms and summaries, and exposition formats
- Prometheus 3.14 configuration and storage
- When to use Pushgateway, Pushgateway lifecycle/API, and remote-write tuning
- VictoriaMetrics cluster, vmagent, and Mimir architecture
- CloudWatch metric retention, Datadog retention, and Datadog rollup
- Official pricing: Amazon Managed Service for Prometheus, CloudWatch, Datadog