Operational Alert Configuration
Review baseline: Prometheus 3.14.0, Alertmanager 0.34.0, kube-prometheus-stack 90.1.1 / Prometheus Operator 0.93.1
Last reviewed: September 11, 2026. Rule evaluation, templates, routing, inhibition scope and chart wiring were validated locally. No real cluster alert configuration or Slack/PagerDuty notification was performed.
< Previous: Scaling | Contents | Next: Observability Analysis >
Alerting requires more than copying metric names. Verify the collector, metric type, labels, units and missing-data behavior, then choose thresholds from service impact and operational response requirements. The thresholds below are examples; select/adapt rules that overlap with existing kube-prometheus-stack defaults.
Alert Architecture
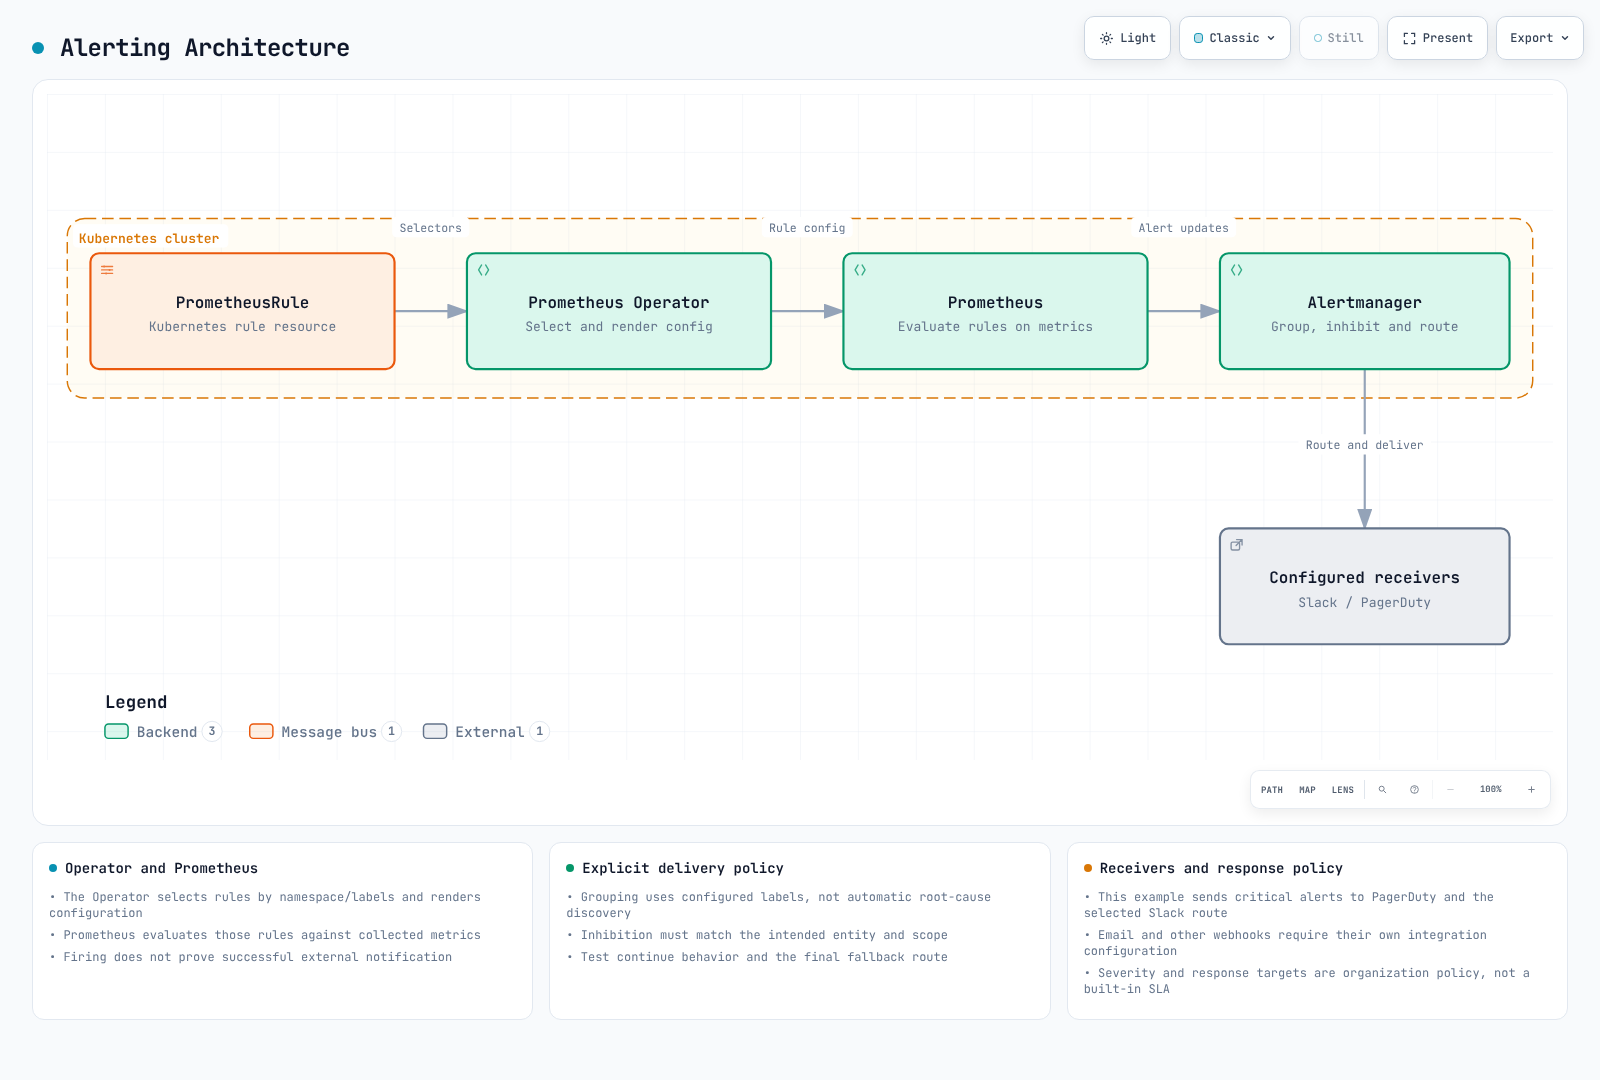
PrometheusRule is a Kubernetes resource. Prometheus Operator selects resources by namespace/label selectors and renders rule configuration. Prometheus evaluates the resulting rules against collected time series.
The example uses namespace and Helm release name monitoring, matching the Rule's release: monitoring label to the generated selector. Change both if the real release or selector differs.
| Field/concept | Meaning |
|---|---|
labels | Alert-instance identity and grouping/routing/inhibition inputs |
annotations | Summary, description and real runbook links |
for | Required duration for the condition on a particular label set |
keep_firing_for | Optional continued firing after the condition clears |
| Severity | Organization-defined label values and response policy |
critical, warning and info are common conventions, not a fixed enum or tool-enforced SLA. Evaluation intervals, for, transport, group_wait and receiver processing all affect notification time.
Evaluation state and resolution
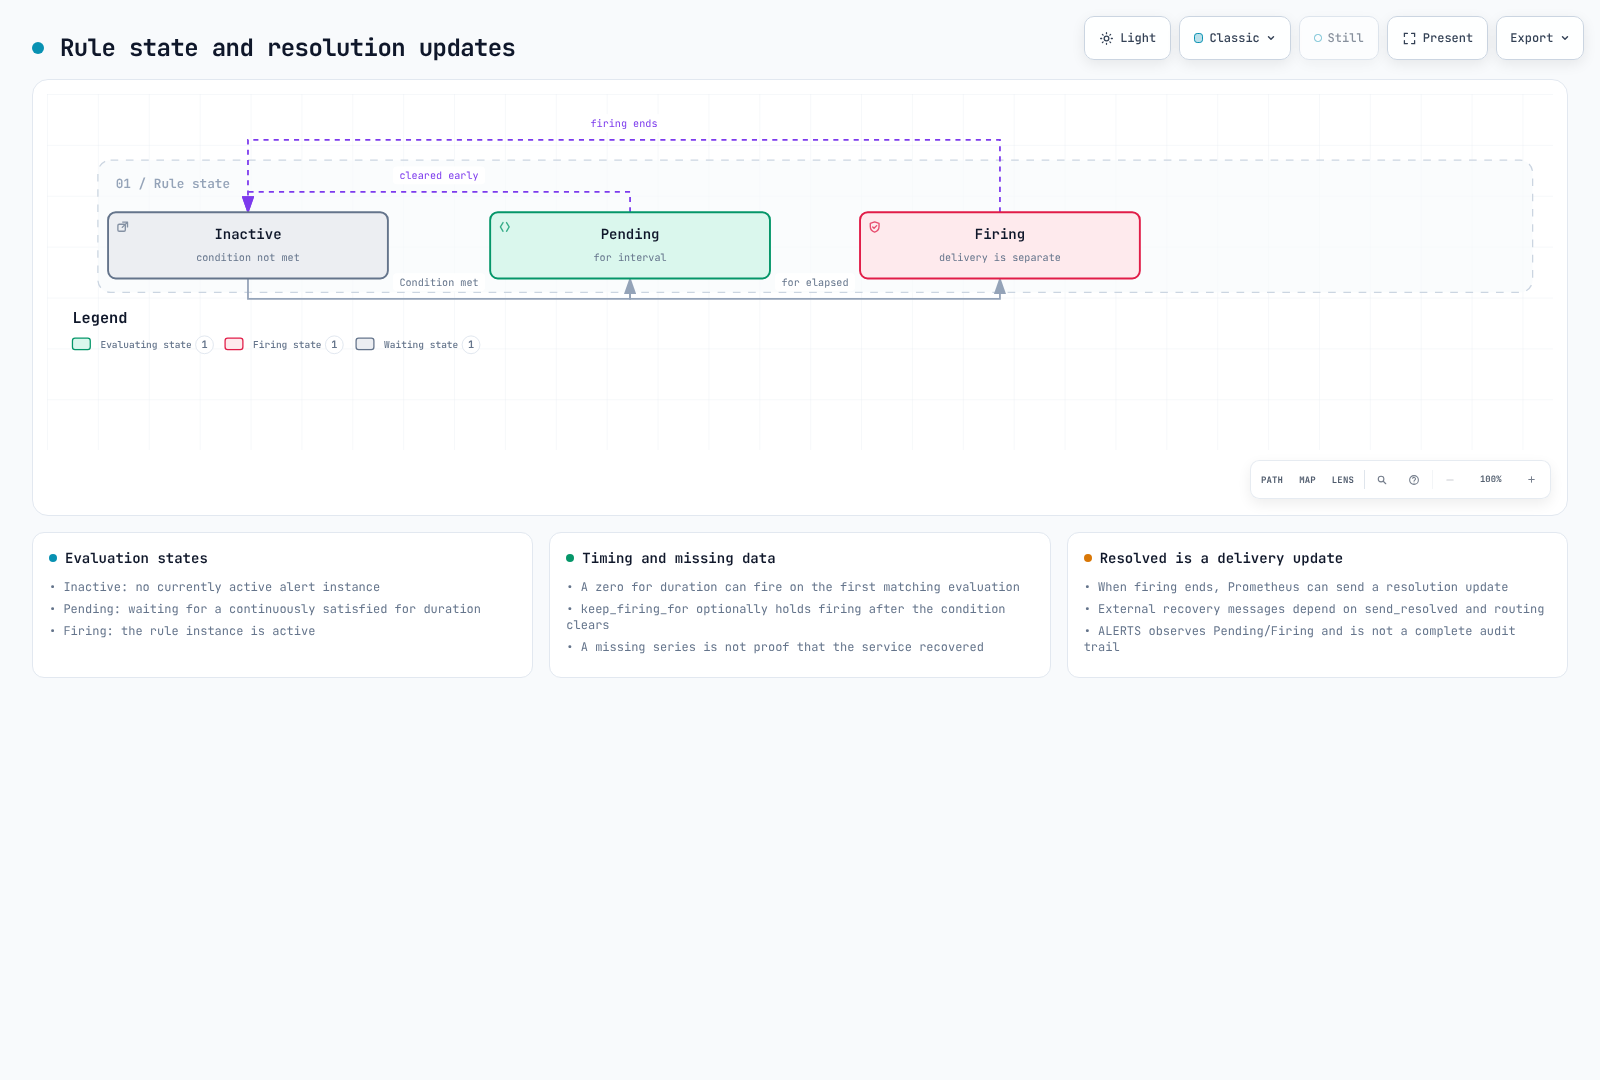
Distinguish rule evaluation from notification delivery. Firing does not establish that Slack received a message. When firing ends, a resolution update can be sent; external recovery messages depend on send_resolved, routing, muting and delivery.
Alerts activate for returned vector elements, including elements whose numeric value is zero. Ready == 0 intentionally returns such elements. Do not accidentally retain false comparisons by adding bool to an alert expression.
A disappeared series can remove expression results without a real service recovery. ALERTS is useful for observing pending/firing state, but is not a complete history of node termination or operator actions.
Validated Baseline Rules
These examples require actual node-exporter, kubelet/cAdvisor and kube-state-metrics collection. Check metric names, jobs, labels and the relevant node/volume mode. The baseline assumes one cluster per Prometheus; centralized queries need cluster labels on the collected series themselves to avoid mixing clusters.
# prometheusrule.yaml
apiVersion: monitoring.coreos.com/v1
kind: PrometheusRule
metadata:
  name: reviewed-operational-alerts
  namespace: monitoring
  labels:
    release: monitoring
spec:
  groups:
  - name: docs.network
    rules:
    - alert: NodeNetworkReceiveDropsHigh
      expr: rate(node_network_receive_drop_total{device!~"lo|veth.*|docker.*|br-.*|cali.*"}[5m]) > 100
      for: 5m
      labels:
        severity: warning
        alert_family: network_receive_drop
        team: network
      annotations:
        summary: Elevated receive drops on {{ $labels.instance }}
        description: '{{ $labels.device }} reports {{ printf "%.2f" $value }} dropped packets/s. Correlate with
          workload symptoms.'
        runbook_url: https://www.atomai.click/kubernetes-docs/en/ops/16-troubleshooting-playbook
    - alert: NodeNetworkTransmitDropsHigh
      expr: rate(node_network_transmit_drop_total{device!~"lo|veth.*|docker.*|br-.*|cali.*"}[5m]) > 100
      for: 5m
      labels:
        severity: warning
        alert_family: network_transmit_drop
        team: network
      annotations:
        summary: Elevated transmit drops on {{ $labels.instance }}
        description: '{{ $labels.device }} reports {{ printf "%.2f" $value }} dropped packets/s. Check the actual
          interface and path.'
        runbook_url: https://www.atomai.click/kubernetes-docs/en/ops/16-troubleshooting-playbook
  - name: docs.cpu
    rules:
    - alert: NodeCPUUsageHigh
      expr: (1 - avg by (cluster, instance, job) (rate(node_cpu_seconds_total{mode="idle"}[5m]))) > 0.85
      for: 5m
      labels:
        severity: warning
        alert_family: node_cpu
        team: platform
      annotations:
        summary: Elevated CPU utilization on {{ $labels.instance }}
        description: '{{ $value | humanizePercentage }} non-idle CPU time. This alone does not establish CPU pressure
          or customer impact.'
        runbook_url: https://www.atomai.click/kubernetes-docs/en/ops/16-troubleshooting-playbook
    - alert: NodeCPUUsageCritical
      expr: (1 - avg by (cluster, instance, job) (rate(node_cpu_seconds_total{mode="idle"}[5m]))) > 0.95
      for: 5m
      labels:
        severity: critical
        alert_family: node_cpu
        team: platform
      annotations:
        summary: Elevated CPU utilization on {{ $labels.instance }}
        description: '{{ $value | humanizePercentage }} non-idle CPU time. This alone does not establish CPU pressure
          or customer impact.'
        runbook_url: https://www.atomai.click/kubernetes-docs/en/ops/16-troubleshooting-playbook
    - alert: ContainerCPUThrottlingHigh
      expr: (sum by (cluster, namespace, pod, container) (rate(container_cpu_cfs_throttled_periods_total{container!="",container!="POD"}[5m])))
        / ((sum by (cluster, namespace, pod, container) (rate(container_cpu_cfs_periods_total{container!="",container!="POD"}[5m])))
        > 0) > 0.25
      for: 5m
      labels:
        severity: warning
        alert_family: container_cpu_throttling
        team: platform
      annotations:
        summary: CPU throttling on {{ $labels.namespace }}/{{ $labels.pod }}/{{ $labels.container }}
        description: '{{ $value | humanizePercentage }} of observed CFS periods included throttling. Correlate with
          latency and CPU quota before changing limits.'
        runbook_url: https://www.atomai.click/kubernetes-docs/en/ops/16-troubleshooting-playbook
    - alert: ContainerCPUThrottlingCritical
      expr: (sum by (cluster, namespace, pod, container) (rate(container_cpu_cfs_throttled_periods_total{container!="",container!="POD"}[5m])))
        / ((sum by (cluster, namespace, pod, container) (rate(container_cpu_cfs_periods_total{container!="",container!="POD"}[5m])))
        > 0) > 0.5
      for: 5m
      labels:
        severity: critical
        alert_family: container_cpu_throttling
        team: platform
      annotations:
        summary: CPU throttling on {{ $labels.namespace }}/{{ $labels.pod }}/{{ $labels.container }}
        description: '{{ $value | humanizePercentage }} of observed CFS periods included throttling. Correlate with
          latency and CPU quota before changing limits.'
        runbook_url: https://www.atomai.click/kubernetes-docs/en/ops/16-troubleshooting-playbook
    - alert: ContainerCPUAboveRequest
      expr: (sum by (cluster, namespace, pod, container) (rate(container_cpu_usage_seconds_total{container!="",container!="POD"}[5m])))
        / ((max by (cluster, namespace, pod, container) (kube_pod_container_resource_requests{resource="cpu",unit="core",container!=""}))
        > 0) > 1.5
      for: 30m
      labels:
        severity: info
        alert_family: container_cpu_request
        team: platform
      annotations:
        summary: CPU use exceeds request on {{ $labels.namespace }}/{{ $labels.pod }}
        description: '{{ printf "%.2f" $value }} times the request. CPU requests are not a hard usage limit; review
          sustained demand.'
        runbook_url: https://www.atomai.click/kubernetes-docs/en/ops/16-troubleshooting-playbook
  - name: docs.storage
    rules:
    - alert: NodeFilesystemUsageHigh
      expr: ((1 - node_filesystem_avail_bytes{fstype!~"tmpfs|overlay|squashfs|nsfs|tracefs"} / (node_filesystem_size_bytes{fstype!~"tmpfs|overlay|squashfs|nsfs|tracefs"}
        > 0)) > 0.85) and (node_filesystem_readonly{fstype!~"tmpfs|overlay|squashfs|nsfs|tracefs"} == 0)
      for: 5m
      labels:
        severity: warning
        alert_family: node_filesystem
        team: storage
      annotations:
        summary: Filesystem usage on {{ $labels.instance }} {{ $labels.mountpoint }}
        description: '{{ $value | humanizePercentage }} of reported capacity is unavailable. Check actual mount
          layout and workload storage.'
        runbook_url: https://www.atomai.click/kubernetes-docs/en/ops/16-troubleshooting-playbook
    - alert: NodeFilesystemUsageCritical
      expr: ((1 - node_filesystem_avail_bytes{fstype!~"tmpfs|overlay|squashfs|nsfs|tracefs"} / (node_filesystem_size_bytes{fstype!~"tmpfs|overlay|squashfs|nsfs|tracefs"}
        > 0)) > 0.95) and (node_filesystem_readonly{fstype!~"tmpfs|overlay|squashfs|nsfs|tracefs"} == 0)
      for: 5m
      labels:
        severity: critical
        alert_family: node_filesystem
        team: storage
      annotations:
        summary: Filesystem usage on {{ $labels.instance }} {{ $labels.mountpoint }}
        description: '{{ $value | humanizePercentage }} of reported capacity is unavailable. Check actual mount
          layout and workload storage.'
        runbook_url: https://www.atomai.click/kubernetes-docs/en/ops/16-troubleshooting-playbook
    - alert: PVCUsageHigh
      expr: (max by (cluster, namespace, persistentvolumeclaim) (kubelet_volume_stats_used_bytes{persistentvolumeclaim!=""}
        / (kubelet_volume_stats_capacity_bytes{persistentvolumeclaim!=""} > 0))) > 0.85
      for: 5m
      labels:
        severity: warning
        alert_family: pvc_usage
        team: storage
      annotations:
        summary: PVC usage on {{ $labels.namespace }}/{{ $labels.persistentvolumeclaim }}
        description: '{{ $value | humanizePercentage }} filesystem usage. This is not an EBS IOPS/throughput measurement.'
        runbook_url: https://www.atomai.click/kubernetes-docs/en/ops/16-troubleshooting-playbook
    - alert: PVCUsageCritical
      expr: (max by (cluster, namespace, persistentvolumeclaim) (kubelet_volume_stats_used_bytes{persistentvolumeclaim!=""}
        / (kubelet_volume_stats_capacity_bytes{persistentvolumeclaim!=""} > 0))) > 0.95
      for: 5m
      labels:
        severity: critical
        alert_family: pvc_usage
        team: storage
      annotations:
        summary: PVC usage on {{ $labels.namespace }}/{{ $labels.persistentvolumeclaim }}
        description: '{{ $value | humanizePercentage }} filesystem usage. This is not an EBS IOPS/throughput measurement.'
        runbook_url: https://www.atomai.click/kubernetes-docs/en/ops/16-troubleshooting-playbook
    - alert: PVCInodesHigh
      expr: max by (cluster, namespace, persistentvolumeclaim) (kubelet_volume_stats_inodes_used{persistentvolumeclaim!=""}
        / (kubelet_volume_stats_inodes{persistentvolumeclaim!=""} > 0)) > 0.9
      for: 5m
      labels:
        severity: warning
        alert_family: pvc_inodes
        team: storage
      annotations:
        summary: PVC inode usage on {{ $labels.namespace }}/{{ $labels.persistentvolumeclaim }}
        description: '{{ $value | humanizePercentage }} of reported inodes are used. The driver/filesystem must
          support these statistics.'
        runbook_url: https://www.atomai.click/kubernetes-docs/en/ops/16-troubleshooting-playbook
    - alert: PVCGrowthProjectionHigh
      expr: max by (cluster, namespace, persistentvolumeclaim) ((predict_linear(kubelet_volume_stats_used_bytes{persistentvolumeclaim!=""}[6h],
        24*3600) / (kubelet_volume_stats_capacity_bytes{persistentvolumeclaim!=""} > 0)) and (kubelet_volume_stats_used_bytes{persistentvolumeclaim!=""}
        / (kubelet_volume_stats_capacity_bytes{persistentvolumeclaim!=""} > 0) > 0.7)) > 1
      for: 1h
      labels:
        severity: warning
        alert_family: pvc_growth
        team: storage
      annotations:
        summary: PVC growth projection on {{ $labels.namespace }}/{{ $labels.persistentvolumeclaim }}
        description: A linear fit projects usage beyond current capacity within 24h. Check data coverage, resizing
          and nonlinear changes.
        runbook_url: https://www.atomai.click/kubernetes-docs/en/ops/16-troubleshooting-playbook
  - name: docs.nodes
    rules:
    - alert: NodeNotReady
      expr: max by (cluster, node) (kube_node_status_condition{condition="Ready",status="true"}) == 0
      for: 5m
      labels:
        severity: warning
        alert_family: node_ready
        team: platform
      annotations:
        summary: Node {{ $labels.node }} is not Ready
        description: An observed Node has Ready=false or unknown. Inspect conditions and events; this is not proof
          of termination.
        runbook_url: https://www.atomai.click/kubernetes-docs/en/ops/16-troubleshooting-playbook
    - alert: NodeDiskPressure
      expr: max by (cluster, node) (kube_node_status_condition{condition="DiskPressure",status="true"}) == 1
      for: 5m
      labels:
        severity: critical
        alert_family: node_disk_pressure
        team: storage
      annotations:
        summary: Node {{ $labels.node }} reports DiskPressure
        description: Kubelet reports disk pressure. Correlate filesystem space/inodes and eviction events.
        runbook_url: https://www.atomai.click/kubernetes-docs/en/ops/16-troubleshooting-playbook
    - alert: PDBHealthyBelowDesired
      expr: max by (cluster, namespace, poddisruptionbudget) (kube_poddisruptionbudget_status_desired_healthy -
        kube_poddisruptionbudget_status_current_healthy) > 0
      for: 5m
      labels:
        severity: warning
        alert_family: pdb_health
        team: platform
      annotations:
        summary: PDB healthy count below desired in {{ $labels.namespace }}
        description: '{{ printf "%.0f" $value }} fewer healthy Pods than desired for {{ $labels.poddisruptionbudget
          }}. This does not prove a policy was bypassed.'
        runbook_url: https://www.atomai.click/kubernetes-docs/en/ops/16-troubleshooting-playbook
  - name: docs.collection
    rules:
    - alert: KnownScrapeTargetDown
      expr: up == 0
      for: 5m
      labels:
        severity: warning
        alert_family: scrape
        team: platform
      annotations:
        summary: Cannot scrape {{ $labels.job }} at {{ $labels.instance }}
        description: A known target failed scraping. A target removed from discovery needs separate absence/inventory
          monitoring.
        runbook_url: https://www.atomai.click/kubernetes-docs/en/ops/16-troubleshooting-playbook
Ratios use humanizePercentage. Prometheus alert annotations do not provide arbitrary Sprig mul/div functions. Do not format 0.96 as 0.96% or read a nonexistent $labels.used_bytes. $value is the expression result; other operands do not automatically become labels.
Network
Use rate() for packet-drop counters; its unit is packets/s. Do not interchange packets per second and per minute. Some policy rejections or transient drops are expected, so correlate persistence, traffic volume and service symptoms.
Inspect bandwidth in bits/s:
rate(node_network_transmit_bytes_total{device!~"lo|veth.*|docker.*|br-.*"}[5m]) * 8Compare against the actual EC2 baseline/burst contract, path and PPS limits. Distinguish 10^9 bits in Gbps from binary Gi units. node_network_speed_bytes may be zero/unknown or a virtual NIC's advertised speed. RX+TX is not universally a full-duplex saturation ratio. Do not assume every node has a 10-Gbps denominator.
CPU
The CFS throttled-period ratio is the fraction of periods with throttling, not lost CPU time. Throttled seconds divided by actual CPU use is not a simple percentage of wall time either. Use counter-aware functions and exclude zero denominators.
Exceeding CPU requests can be legitimate burst usage. High utilization, throttling, iowait or steal alone does not prove customer impact or root cause. Evaluate limits/requests alongside service latency, quota, scheduling and HPA effects.
An expression such as process_cpu_seconds_total{job="containerd"} needs that actual process exporter/job. Do not assume managed Auto Mode services expose the same Deployment/DaemonSet metrics as a conventional installation.
Filesystems, PVCs and inodes
kubelet_volume_stats_* provides statistics for supported drivers/filesystems. PVC usage is not EBS IOPS/throughput saturation, and not every volume mode exposes the same statistics.
Zero or missing capacity is not “0% used.” Exclude read-only/virtual filesystems according to purpose and inspect actual mounts; /var/lib/kubelet is not always its own mountpoint.
container_fs_limit_bytes is not guaranteed to equal Kubernetes resources.limits.ephemeral-storage. Distinguish writable layers, logs, emptyDir and node filesystem accounting.
predict_linear extrapolates a fitted trend. Resizing, deletion, missing samples and nonlinear growth change its interpretation. It does not guarantee exhaustion at a precise deadline or justify unconditional automated expansion.
Match CNI, DNS and Policy Metrics to the Installation
VPC CNI
The conventional VPC CNI IPAM endpoint and cni-metrics-helper's CloudWatch aggregation use different paths/names. The following gauge/counter definitions are present in v1.23.1; verify the installed version and actual /metrics before use.
# Spare addresses in the currently allocated pool
awscni_total_ip_addresses - awscni_assigned_ip_addresses

# IPAM error counter
rate(awscni_ipamd_error_count[5m])

# Failure to obtain an available IP address
rate(awscni_no_available_ip_addresses[5m])
Zero warm-pool headroom alone does not establish subnet exhaustion or prove that all new Pods are impossible. Check additional allocation, prefix delegation, ENI limits, actual errors and subnet capacity.
Do not add an absent status="failed" label to awscni_add_ip_req_count or invent an ENI latency histogram. Distinguish original Prometheus names from cni-metrics-helper's renamed cluster-level CloudWatch aggregates.
DNS
NXDOMAIN can be a legitimate negative lookup. Define failures and traffic thresholds deliberately. Where CoreDNS metrics are collected, this diagnostic expression calculates a SERVFAIL/REFUSED ratio:
(
  sum by (cluster) (rate(coredns_dns_responses_total{rcode=~"SERVFAIL|REFUSED"}[5m]))
  or on (cluster)
  (0 * sum by (cluster) (rate(coredns_dns_responses_total[5m])))
)
/
(sum by (cluster) (rate(coredns_dns_responses_total[5m])) > 0)
Failed scraping and failed DNS queries are different conditions. absent(up{job="coredns"} == 1) alone does not prove cluster DNS is impossible. Pure EKS Auto Mode runs CoreDNS as a node system service; do not impose conventional CoreDNS Deployment assumptions. Check the DNS architecture of mixed-node installations.
Network-policy drops
With drop metrics enabled, Cilium 1.20.1 Hubble exports hubble_drop_total with reason/protocol and configured context labels.
sum by (cluster, reason) (
  rate(hubble_drop_total{reason="POLICY_DENIED"}[5m])
)
Namespace context exists only when configured. A policy drop is not inherently a misconfiguration. Check the actual Cilium/Calico distribution, features and metrics configuration rather than inventing a shared denied_packets metric. See the reviewed Cilium observability chapter.
Auto Mode Node State and Termination Causes
NodeNotReady means an observed Node's Ready status is false/unknown. It does not independently prove termination, replacement or exhausted capacity. Distinguish missing inventory from a failed exporter too.
# Previously observed Nodes missing from current inventory: diagnostic only
max by (cluster, node) (kube_node_info offset 5m)
unless on (cluster, node)
max by (cluster, node) (kube_node_info)

# Currently retained Evicted Pod state, not a historical event counter
sum by (cluster, namespace) (kube_pod_status_reason{reason="Evicted"} == 1)
Pod phase/reason and deletion timestamps are not event counters. Do not use increase() to turn them into a period eviction count, or add a nonexistent reason="NodeDrain" label. Preserve Kubernetes Events and audit/operational logs for history after Pod garbage collection.
A PDB currentHealthy count below desiredHealthy is a health shortfall, not proof someone violated its policy. Investigate involuntary failures, direct replica changes and other causes separately.
Managed Auto Mode and self-managed Karpenter
Do not assume Auto Mode exposes a self-managed Karpenter controller's scrape endpoint. Use supported Node conditions, NodeClaim/NodePool state and managed control-plane audit logs.
AWS's Auto Mode troubleshooting guide describes events such as DisruptionBlocked, DisruptionTerminating, FailedScheduling and FailedDraining in control-plane audit logs. With audit logging enabled, scope a query to the actual cluster log group:
fields @timestamp, @message
| filter @logStream like /kube-apiserver-audit/
| filter @message like /DisruptionBlocked|DisruptionTerminating|FailedScheduling|FailedDraining|NodeRepairBlocked/
| sort @timestamp desc
| limit 100
For self-managed Karpenter, use the installed version's metric catalog. Current NodeClaim termination counters are aggregates, not a complete per-node/reason audit trail. Interruption-queue counters can include message types other than Spot.
karpenter_nodepools_usage measures provisioned resources, not busy CPU utilization. Check resource labels, units, cluster identity and missing/zero limits before comparing it to limits. Pending Pods plus spare-capacity metrics do not prove schedulability; affinity, taints, topology and volumes still matter.
Alertmanager Configuration and Chart Wiring
The following is native Alertmanager YAML. Do not mix it with AlertmanagerConfig CRD structured matchers/camelCase fields. Native Alertmanager does not automatically substitute ${NAME} environment placeholders.
Prepare files and Secrets
Prepare these objects in namespace monitoring:
| Object | Contents |
|---|---|
Secret reviewed-alertmanager-config | alertmanager.yaml key |
ConfigMap notification-templates | notifications.tmpl key |
Secret notification-credentials | slack-default, slack-network, slack-storage, slack-info, pagerduty-routing-key |
Use the approved secret-management workflow for credentials. Keep real URLs/keys out of Git, Helm values and PR logs. Modern Slack incoming webhooks are bound to the installation's selected channel; changing a channel field does not turn one URL into several channels. This example uses separate URL files.
PagerDuty uses an Events API v2 routing key here. service_key/service_key_file remains a supported separate v1 integration path; select credentials matching the actual integration type.
# alertmanager.yaml
global:
  resolve_timeout: 5m
route:
  receiver: default-slack
  group_by: [cluster, alertname, namespace, severity]
  group_wait: 30s
  group_interval: 5m
  repeat_interval: 4h
  routes:
    - receiver: oncall
      matchers: ['severity="critical"']
      group_wait: 10s
      repeat_interval: 1h
      continue: true
    - receiver: low-priority
      matchers: ['severity="info"']
      mute_time_intervals: [nightly-maintenance]
    - receiver: network-team
      matchers: ['team="network"']
    - receiver: storage-team
      matchers: ['team="storage"']
    # Explicit sibling fallback: a matched critical route does not fall back
    # to the root receiver merely because its continue flag is true.
    - receiver: default-slack

inhibit_rules:
  - source_matchers: ['severity="critical"', 'cluster!=""', 'alert_family!=""', 'instance!=""']
    target_matchers: ['severity="warning"', 'cluster!=""', 'alert_family!=""', 'instance!=""']
    equal: [cluster, alert_family, instance, job, device, mountpoint, fstype]
  - source_matchers: ['severity="critical"', 'cluster!=""', 'alert_family!=""', 'namespace!=""', 'pod!=""', 'container!=""']
    target_matchers: ['severity="warning"', 'cluster!=""', 'alert_family!=""', 'namespace!=""', 'pod!=""', 'container!=""']
    equal: [cluster, alert_family, namespace, pod, container]
  - source_matchers: ['severity="critical"', 'cluster!=""', 'alert_family!=""', 'namespace!=""', 'persistentvolumeclaim!=""']
    target_matchers: ['severity="warning"', 'cluster!=""', 'alert_family!=""', 'namespace!=""', 'persistentvolumeclaim!=""']
    equal: [cluster, alert_family, namespace, persistentvolumeclaim]

receivers:
  - name: default-slack
    slack_configs:
      - api_url_file: /etc/alertmanager/secrets/notification-credentials/slack-default
        send_resolved: true
        title: '{{ template "docs.title" . }}'
        text: '{{ template "docs.text" . }}'
  - name: network-team
    slack_configs:
      - api_url_file: /etc/alertmanager/secrets/notification-credentials/slack-network
        send_resolved: true
        title: '{{ template "docs.title" . }}'
        text: '{{ template "docs.text" . }}'
  - name: storage-team
    slack_configs:
      - api_url_file: /etc/alertmanager/secrets/notification-credentials/slack-storage
        send_resolved: true
        title: '{{ template "docs.title" . }}'
        text: '{{ template "docs.text" . }}'
  - name: low-priority
    slack_configs:
      - api_url_file: /etc/alertmanager/secrets/notification-credentials/slack-info
        send_resolved: true
        title: '{{ template "docs.title" . }}'
        text: '{{ template "docs.text" . }}'
  - name: oncall
    pagerduty_configs:
      - routing_key_file: /etc/alertmanager/secrets/notification-credentials/pagerduty-routing-key
        send_resolved: true
        severity: critical
        description: '{{ template "docs.title" . }}'
        details:
          alerts: '{{ template "docs.text" . }}'

templates:
  - /etc/alertmanager/configmaps/notification-templates/*.tmpl

time_intervals:
  - name: nightly-maintenance
    time_intervals:
      - location: Asia/Seoul
        times:
          - start_time: "02:00"
            end_time: "04:00"
Critical alerts reach oncall, then continue to the team-specific Slack path. The explicit final sibling fallback also sends critical alerts without a team to Slack. Once a child route matches, continue: true alone does not cause fallback to the root receiver.
Info uses a separate path, muted daily during 02:00–04:00 Asia/Seoul. This does not accumulate a daily digest. Repetition/group delays do not replace a calendar-based digest process.
Inhibition requires actual cluster/entity identifiers. Warning and critical names may differ, but must share alert_family and the intended node/container/PVC scope. Missing labels can compare equal as empty values; an unqualified equal: [node] can suppress unrelated alerts.
resolve_timeout does not change for or the resolution delay of Prometheus alerts carrying EndsAt. Check actual receiver behavior, including send_resolved, separately.
Notification template
notifications.tmpl:
{{ define "docs.title" -}}
[{{ .Status | toUpper }}] {{ .GroupLabels.alertname }} — {{ .CommonLabels.cluster }}
{{- end }}

{{ define "docs.text" -}}
{{ range .Alerts -}}
[{{ .Status | toUpper }}] {{ .Annotations.summary }}
{{ .Annotations.description }}
{{ if .Labels.namespace }}Namespace: {{ .Labels.namespace }}
{{ end -}}
{{ if .Annotations.runbook_url }}Runbook: {{ .Annotations.runbook_url }}
{{ end -}}
{{ end -}}
{{ if .ExternalURL }}Alertmanager: {{ .ExternalURL }}
{{ end -}}
{{- end }}
The template displays each alert's status even when firing/resolved alerts share a group. Avoid unconditional empty runbook buttons or manually assembled silence URLs containing unescaped label values. Use the authenticated Alertmanager UI to select and silence specific alerts.
For example, supply the configuration and template through these Kubernetes objects. This does not create the credentials Secret:
kubectl --context "$TARGET_CONTEXT" -n monitoring create secret generic \
  reviewed-alertmanager-config --from-file=alertmanager.yaml \
  --dry-run=client -o yaml |
  kubectl --context "$TARGET_CONTEXT" -n monitoring apply -f -

kubectl --context "$TARGET_CONTEXT" -n monitoring create configmap \
  notification-templates --from-file=notifications.tmpl \
  --dry-run=client -o yaml |
  kubectl --context "$TARGET_CONTEXT" -n monitoring apply -f -
kube-prometheus-stack values
# alerting-values.yaml
# Merge into the reviewed full values for the actual release named "monitoring".
alertmanager:
  enabled: true
  alertmanagerSpec:
    useExistingSecret: true
    configSecret: reviewed-alertmanager-config
    secrets: [notification-credentials]
    configMaps: [notification-templates]
    externalUrl: https://alertmanager.example.com
    # No AlertmanagerConfig object is supplied in this example.
    # Adding one with this label is an explicit, separately reviewed choice.
    alertmanagerConfigSelector:
      matchLabels:
        alertmanager-config: platform-approved
    alertmanagerConfigNamespaceSelector:
      matchLabels:
        kubernetes.io/metadata.name: monitoring
prometheus:
  prometheusSpec:
    externalLabels:
      cluster: REPLACE_CLUSTER_NAME
    additionalAlertRelabelConfigs:
      - action: labeldrop
        regex: prometheus_replica
Merge this into the release's complete reviewed values, replacing the cluster name and access URL. Do not overwrite an existing installation with this fragment alone. Chart 90.1.1 renders additional alert relabeling into a Secret referenced by Prometheus.
helm template monitoring prometheus-community/kube-prometheus-stack \
  --version 90.1.1 --namespace monitoring \
  --values monitoring-values.yaml --values alerting-values.yaml \
  > rendered-monitoring.yaml
Prepare the Helm repository and review CRD/chart upgrades first. Check duplicate default rules and assumptions about unavailable managed control-plane/Auto Mode jobs before applying through the operational deployment workflow.
External labels identify outgoing alerts; they do not automatically label every local query sample. Remove per-replica identity when needed for HA deduplication while preserving real cluster identity.
The example selects its base Secret and explicitly labeled additional AlertmanagerConfig resources. Adding a matching CRD is another configuration merge and requires deliberate review.
Validation and Maintenance
With PyYAML available, extract the PrometheusRule spec as a native rule file:
python3 - <<'PY'
from pathlib import Path
import yaml
resource = yaml.safe_load(Path("prometheusrule.yaml").read_text())
Path("rules.yaml").write_text(yaml.safe_dump(resource["spec"], sort_keys=False))
PY
promtool check rules rules.yaml
Check Alertmanager using a validation copy with prepared template/credential paths:
amtool check-config alertmanager.yaml --enable-feature=utf8-strict-mode
amtool config routes test --config.file=alertmanager.yaml \
  --verify.receivers=oncall,network-team severity=critical team=network
Synthetic files can replace real credentials for local checks. This chapter validated 17 rules, 18 evaluation scenarios, ten routing cases, two native templates and sixteen inhibition cases on a local Alertmanager with all outbound integrations removed. Actual exporter data, channel authentication and delivery require separate validation after connecting the environment.
Creating/expiring a silence changes notification policy. Confirm the Alertmanager URL, cluster/namespace/entity matchers, owner, reason and duration. Silences do not stop Prometheus evaluation, and a long-muted alert is not a resolved incident.
An OOMKilled last-termination gauge can retain historical state. Correlate restart counts, termination times and Events rather than always increasing limits or declaring a memory leak.
References
- Prometheus alerting rules
- Alertmanager configuration
- VPC CNI v1.23.1 metric definitions
- Auto Mode troubleshooting
- Karpenter metrics
- Slack incoming webhooks
- Chapter quiz
< Previous: Scaling | Contents | Next: Observability Analysis >