Part 1: MLflow Tracking
Review baseline: MLflow 3.16.0; latest patch 3.16.1 checked · 2026-10-12
Lab Environment Setup
Install mlflow==3.16.0 with Python 3.10 or later. The example below was checked with Python 3.12, SQLite, and a local artifact store. It requires no GPU, trained model, or remote server.
Patch 3.16.1 is available, but this example has not been rerun with it. Part 3 covers a team HTTP server and EKS operation.
What Is MLflow Tracking?
Tracking provides APIs and a UI for experiments, runs, parameters, metrics, artifacts, logged models, and traces. The SDK can connect to an HTTP tracking server or directly to a local file/SQL backend. A separate server process is not required for every use.
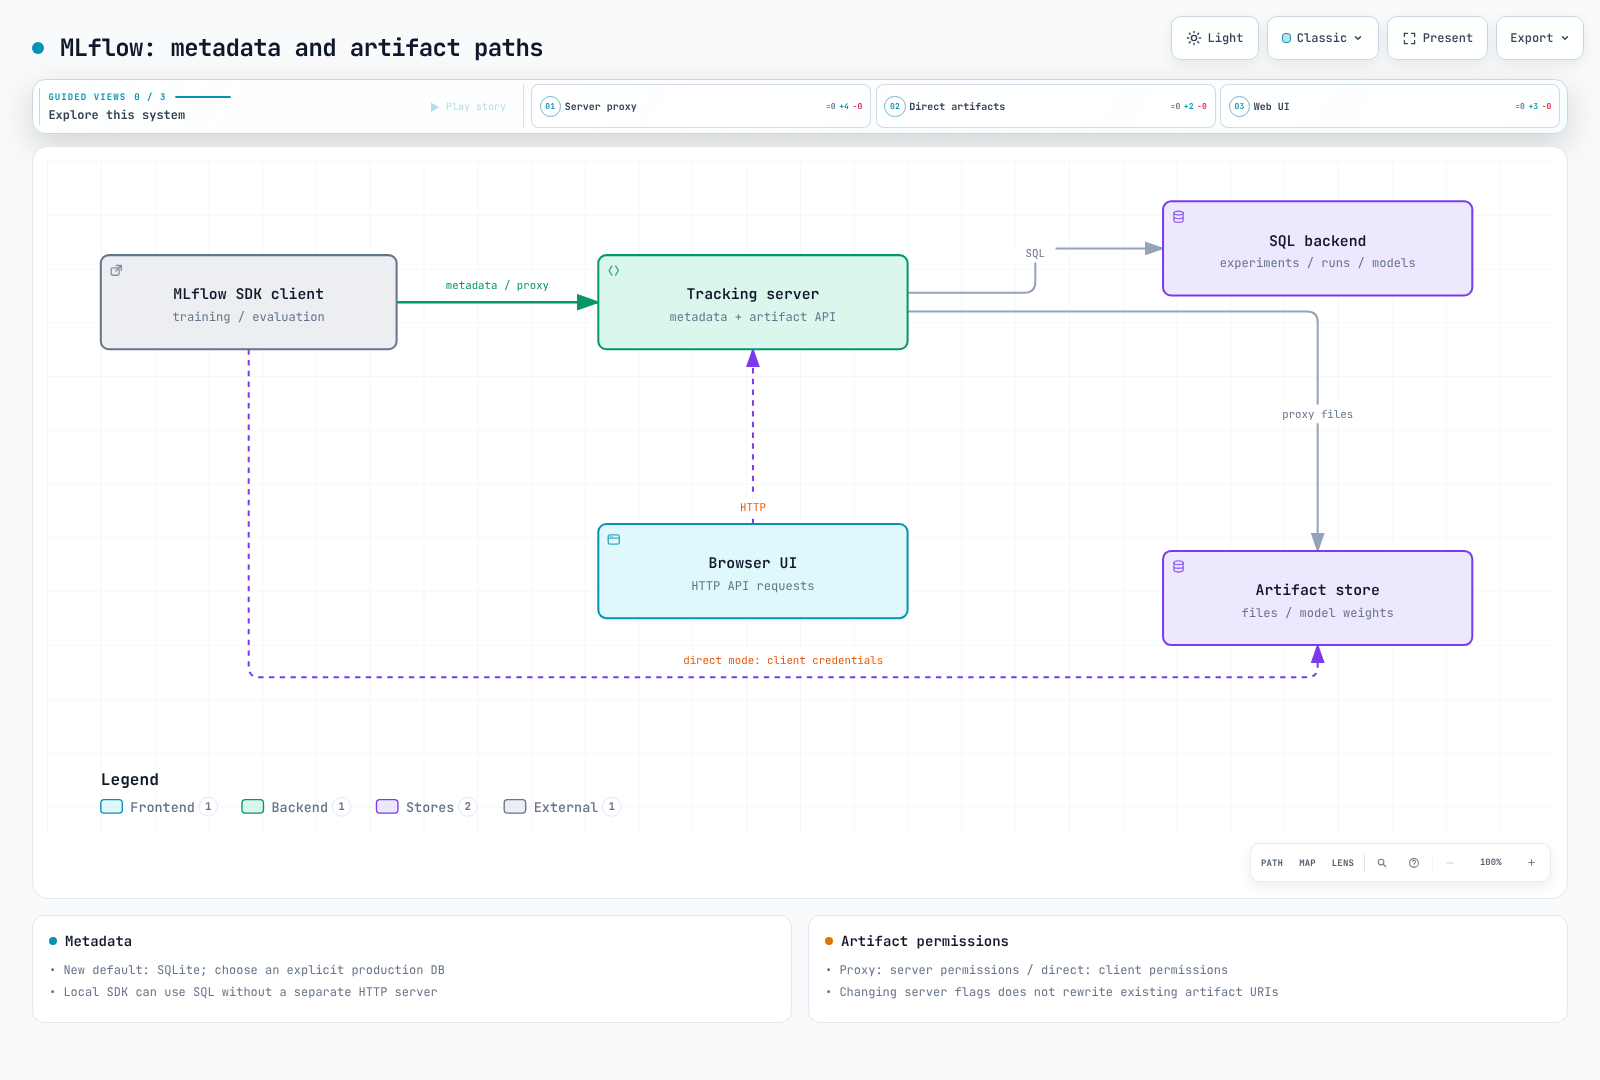
Even with a remote server, metadata and artifact transfers can take different paths. Metadata goes through the tracking API; artifacts can be proxied by the server or transferred directly between the client and a store such as S3. These configurations are distinguished below.
Core Concepts: Experiments and Runs
An Experiment groups runs and related results. A Run can represent evaluation, preprocessing, or a comparison as well as training. A parameter key cannot be changed to a different value within one run. Metrics can have multiple timestamped observations with steps; distinguish the current summary from the full history.
The following values are Tracking API fixtures, not measured model accuracy. The example creates its JSON artifact instead of depending on an undefined image file.
from pathlib import Path
import mlflow
from mlflow import MlflowClient

root = Path(".mlflow-demo").resolve()
root.mkdir(exist_ok=True)
mlflow.set_tracking_uri(f"sqlite:///{root / 'mlflow.db'}")
client = MlflowClient()
experiment = client.get_experiment_by_name("tracking-demo")
experiment_id = (
    experiment.experiment_id if experiment else
    client.create_experiment(
        "tracking-demo", artifact_location=(root / "artifacts").as_uri()
    )
)
mlflow.set_experiment(experiment_id=experiment_id)

with mlflow.start_run(run_name="demo") as run:
    mlflow.log_param("learning_rate", 0.01)
    mlflow.log_metric("demo_score", 0.92, step=0)
    mlflow.log_metric("demo_score", 0.95, step=1)
    mlflow.log_dict({"synthetic_example": True}, "summary.json")
    run_id = run.info.run_id

assert client.get_run(run_id).info.status == "FINISHED"
assert len(client.get_metric_history(run_id, "demo_score")) == 2
Normal context exit ends the run as FINISHED; an exception in the block ends it as FAILED. Run termination does not back up artifacts or verify success of an entire training process. Repeating the example adds a run to the same experiment. The conditional does not change an existing experiment's artifact location.
Autologging
mlflow.autolog() configures supported integrations. Captured values, supported framework versions, model logging, and input-example collection vary by integration. Do not assume an ordinary PyTorch loop and a Lightning workflow receive identical automatic instrumentation. Check the framework-specific API and version support; log additional metrics manually.
Review where inputs, outputs, models, and data samples will be stored before enabling autologging. Enabling the feature neither removes PII nor instruments every custom code path.
The MLflow 3 Shift: Models as First-Class Entities
A LoggedModel has its own model_id, status, artifact location, and metadata. It can refer to a training run through source_run_id and have relationships with other evaluation runs, metrics, and traces. It is distinct from Registered Models and Model Versions.
Calling log_model() without an explicit start_run() block is not itself new in 3.x. Model.log() in 2.22.0 already used _get_or_start_run() when necessary; the 3.16.0 model-logging path still has this behavior. The important change is independent model identity and relationship tracking.
After the tracking setup above, this creates model metadata with no active run:
model = mlflow.initialize_logged_model(
    name="metadata-only", model_type="demo"
)
assert mlflow.active_run() is None
assert model.source_run_id is None
print(model.model_id, model.status)  # PENDING
It does not yet contain usable model weights or a model flavor. Complete actual model logging, artifact retention, and finalization before use. READY is not evidence of deployment approval, quality, or security review.
GenAI and LLM Observability: Tracing
MLflow Tracing was introduced in 2.14.0 on 2024-06-17. Version 3.x expanded model, evaluation, and GenAI UI integration; 3.16.0 added span links and a redesigned trace UI. Tracing did not first become possible in version 3.
A trace represents request steps such as retrieval, tool execution, and LLM calls with spans. Distinguish parent/child structure from span links. Token collection depends on the integration and provider response; retrieval or tool spans do not necessarily have LLM token or cost fields. Cost estimation requires model identity, usage, and price information and is not the reconciled billing total.
Combine automatic instrumentation with manual spans where appropriate. Inputs, outputs, exceptions, tool arguments, and reasoning may contain sensitive information; define collection scope, access, redaction, and retention. Installing an integration does not ensure complete path coverage or cost accounting.
Backend Store vs. Artifact Store
| Store or default | Meaning |
|---|---|
| Backend | experiment/run/parameter/metric/model metadata; SQLite, PostgreSQL, MySQL, and other supported SQL stores |
| Artifact | model files, plots, JSON, and other files; local paths, S3, and other stores |
| Default | a new 3.16.0 environment uses sqlite:///mlflow.db; check compatibility behavior if ./mlruns already exists |
| Legacy file backend | maintenance mode; choose an explicit SQL backend and migration plan for new operation |
SQLite is also a relational database. It fits small local exercises; concurrent writers, multiple server replicas, backups, and high availability require separate assessment. A metadata database backup does not automatically include artifact files.
Two Artifact Paths with a Remote Server
- Proxy mode: the client uses a
mlflow-artifacts:location and sends files through the server, which holds artifact-store permissions. Clients may not need their own S3 access, making tracking-server authentication and authorization important. - Direct mode: with
--no-serve-artifactsand a directs3://...artifact root, clients access storage themselves. They need the relevant AWS permissions, network access, and libraries.
Changing server flags does not retroactively rewrite existing experiment artifact URIs. Inspect the actual experiment/run URI. The browser UI queries server HTTP APIs; it does not connect directly to PostgreSQL.
Next Steps
Part 2 covers registration, versions, and aliases. Part 3 covers EKS storage and access control. Changing an alias alone does not automatically redeploy every serving process.