ClickHouse
Last Updated: September 13, 2026
ClickHouse is a columnar analytical database. It suits log workloads that need SQL filtering, aggregation and joins, provided the ingestion schema, retention and operating model fit the workload.
Table of Contents
- Overview
- Architecture
- Kubernetes deployment
- Log ingestion pipeline
- SQL queries
- Grafana integration
- HyperDX
- Performance optimization
- S3 archiving
Overview
ClickHouse Features
| Feature | Practical implication |
|---|---|
| Columnar storage | Read selected columns rather than every field of every record |
| Compression and codecs | Repeated values and suitable ordering can reduce storage; measure your own data |
| SQL analytics | Use ClickHouse SQL functions, aggregates and joins; it is not a drop-in implementation of every SQL dialect |
| Sharding | Distribute rows across servers; choose a key that avoids hot shards |
| Replication | ReplicatedMergeTree coordinates replicas through Keeper/ZooKeeper |
| Batched ingestion | Control insert frequency and part creation rather than assuming a fixed rows/second rate |
Why Choose ClickHouse for Log Analytics
Evaluate ClickHouse when logs are structured and repeated analytical queries dominate. Benchmark representative filters, text searches, retention, concurrent readers and ingest bursts. Compression above 10:1, scanning billions of rows in seconds and particular cost savings are workload-dependent results, not guarantees for this configuration.
This guide uses ClickHouse 26.3.33.24 LTS, Altinity Operator 0.27.3, Vector 0.58.0 and Grafana ClickHouse datasource 4.21.2 as explicit review baselines. Release publication does not prove that an arbitrary Kubernetes/EKS version, storage class or combination is production-compatible. Validate your cluster and upgrade path separately.
Comparison with Other Solutions
| System | Query and storage model | Evaluate |
|---|---|---|
| ClickHouse | SQL over columnar tables | Sort keys, projections/indexes, aggregation and insert/merge behavior |
| OpenSearch / Elasticsearch | Document search and analytics | Text analysis, mappings, indexing costs and search requirements |
| Loki | LogQL over label-indexed log streams/chunks | Label cardinality, query scans, retention and operational mode |
Avoid universal rankings for compression, query speed or operating complexity. Each system has multiple deployment modes and indexing/query options. Compare the same data, queries, replicas and retention.
Architecture
ClickHouse Cluster Architecture
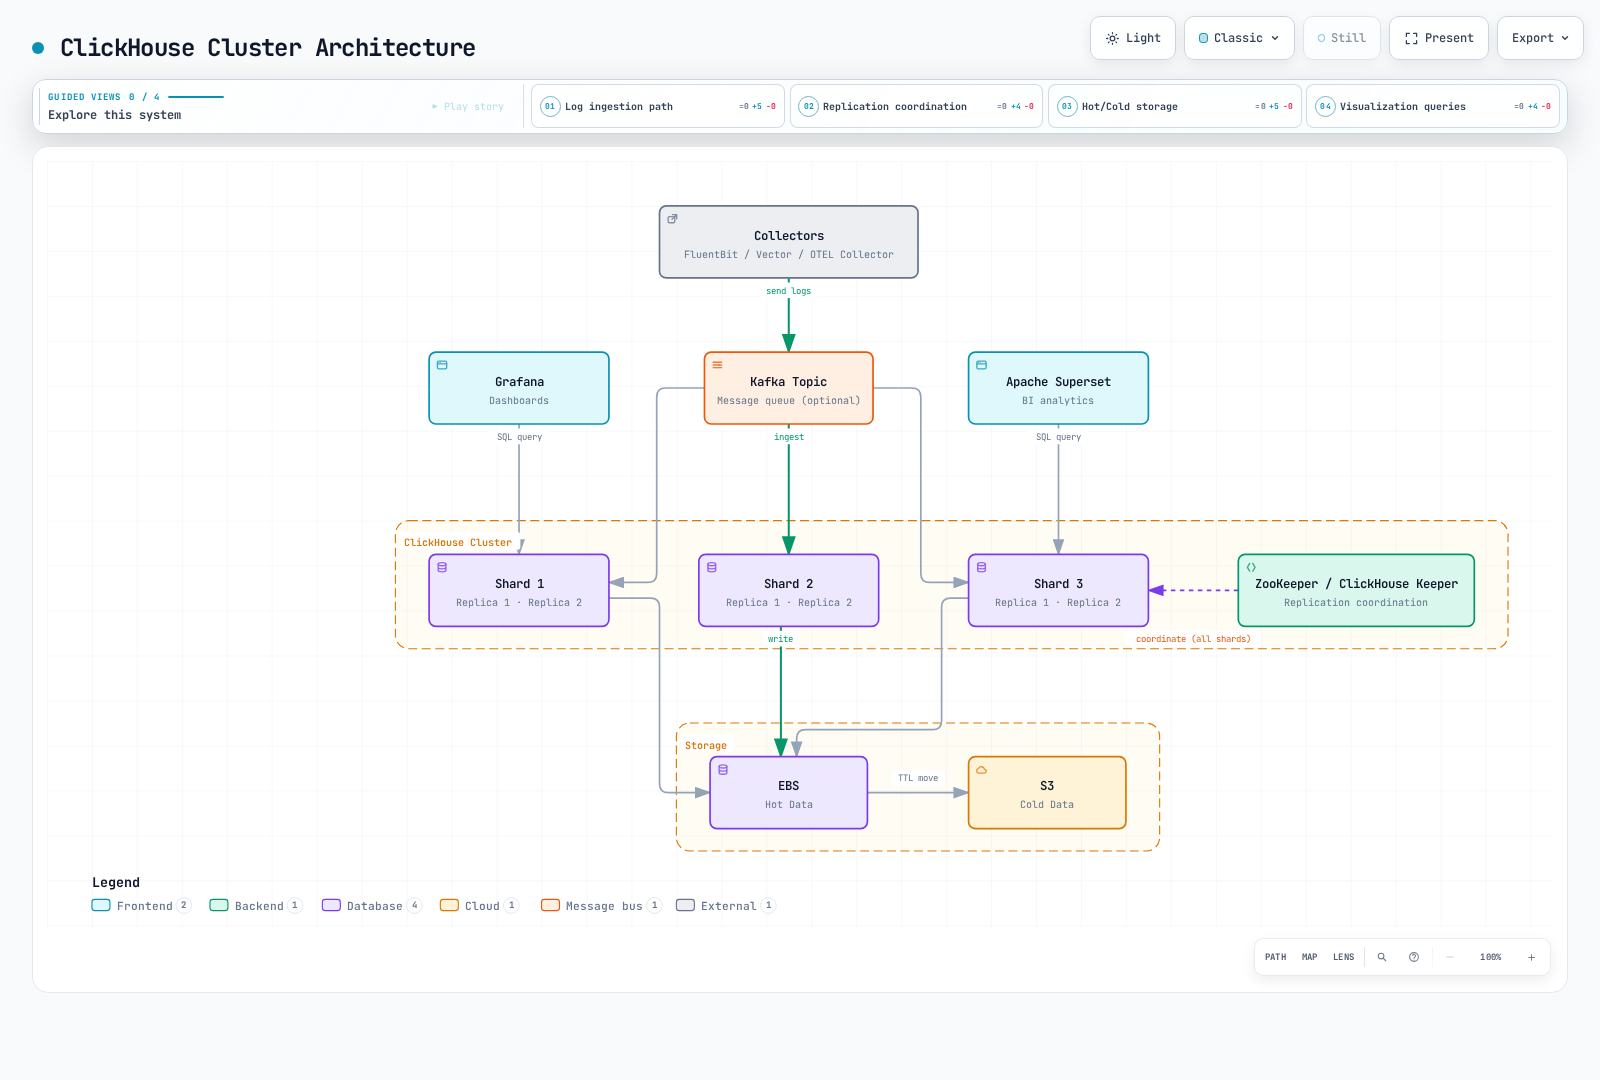
The diagram summarizes a topology, not a tested capacity plan. Each ClickHouse replica needs its own data volume; the EBS symbol does not mean that six replicas share one writable EBS filesystem. Keeper/ZooKeeper coordinates replication and distributed DDL. A ClickHouse query initiator and the Distributed engine perform distributed queries; Keeper is not the query router.
Data Flow
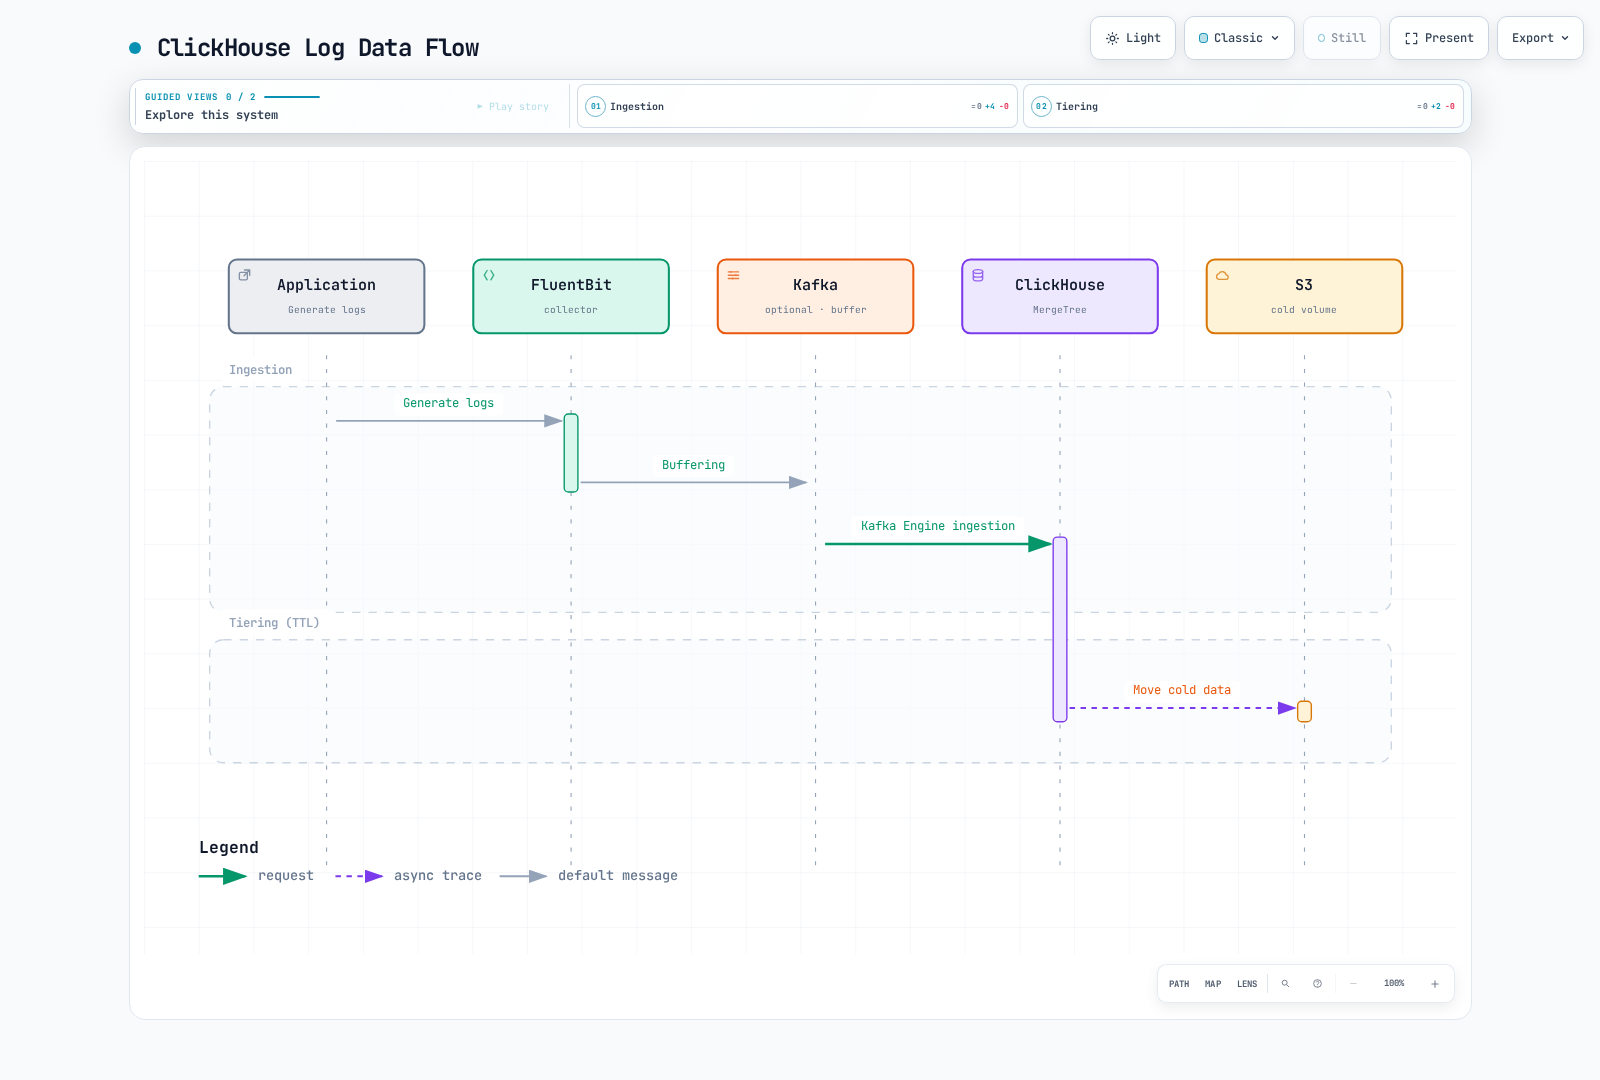
Arrows show data movement. In the Kafka-engine variant, ClickHouse consumers poll Kafka; the picture does not imply that Kafka pushes inserts or guarantees exactly-once delivery. S3 cold table parts and independent Parquet archives are different mechanisms.
Kubernetes Deployment
Install ClickHouse Operator
Use the versioned official chart rather than applying a moving master bundle:
helm upgrade --install clickhouse-operator \
  https://github.com/Altinity/clickhouse-operator/releases/download/release-0.27.3/altinity-clickhouse-operator-0.27.3.tgz \
  --namespace clickhouse-operator --create-namespace

kubectl -n clickhouse-operator get deployments,pods
kubectl get crd clickhouseinstallations.clickhouse.altinity.com \
  clickhousekeeperinstallations.clickhouse-keeper.altinity.com
Inspect rendered RBAC, watched namespaces and CRD installation/upgrade behavior before applying. The local review rendered this chart and checked its official release checksum; it did not install an operator or validate reconciliation against a cluster.
ClickHouse Cluster Definition
The following is a topology example with mandatory existing dependencies, not a complete secure installation:
- Namespace
clickhouse, ServiceAccountclickhouse-serverand the appropriate CSI-backedgp3StorageClass must exist. Storage class names are local choices; EKS Auto Mode storage and conventional EBS CSI require the corresponding provisioner and topology settings. - A site-owned ClickHouseInstallationTemplate named
log-securitymust configure mounted Secret files, accounts, TLS, probes and authenticated internal communication. Ensure its settings/mounts also apply to thelogs-serverpod template below. - A healthy
logs-keeperClickHouseKeeperInstallation must already provide the intended TLS endpoints and quorum. - Provide an internal TLS Service named
logs-clickhousein namespaceclickhouse, exposing HTTPS 8443. Its certificate must match the client DNS name. Confirm actual operator-generated selectors and endpoints; a CHI name alone does not create this particular service name. - Allocate failure domains, disruption budgets and resources from measured requirements. The 3×2 layout and per-replica 100Gi/8Gi limits below are illustrative, not a throughput or availability promise.
apiVersion: clickhouse.altinity.com/v1
kind: ClickHouseInstallation
metadata:
  name: logs-demo
  namespace: clickhouse
spec:
  # Required site-owned template: users, TLS, probes and internal authentication.
  useTemplates:
    - name: log-security
  defaults:
    templates:
      podTemplate: logs-server
      dataVolumeClaimTemplate: logs-data
  configuration:
    zookeeper:
      keeper:
        name: logs-keeper
        serviceType: replicas
    clusters:
      - name: logscluster
        secure: "yes"
        insecure: "no"
        layout:
          shardsCount: 3
          replicasCount: 2
  templates:
    podTemplates:
      - name: logs-server
        spec:
          serviceAccountName: clickhouse-server
          containers:
            - name: clickhouse
              image: clickhouse/clickhouse-server:26.3.33.24
              resources:
                requests:
                  cpu: "2"
                  memory: 4Gi
                limits:
                  memory: 8Gi
    volumeClaimTemplates:
      - name: logs-data
        spec:
          accessModes: [ReadWriteOnce]
          storageClassName: gp3
          resources:
            requests:
              storage: 100Gi
Use separate log_writer, log_reader and administrative identities. Mount credential/configuration files from Secrets; do not put passwords in ConfigMaps, source code, shell command arguments or broad environment dumps. Restrict account networks and NetworkPolicies to the actual collector/query/replica paths. Do not copy permissive ::/0 users, expired example certificates or certificate-verification bypasses.
TLS port exposure alone is insufficient: verify certificate loading, hostname/CA checks, replica traffic and readiness probes. Do not apply the topology until the security template, volumes and dependencies have been reviewed together. Local CRD validation checks shape, not admission, scheduling, TLS or operator behavior.
ZooKeeper (or ClickHouse Keeper) Deployment
For a new deployment, consider ClickHouse Keeper and the operator's ClickHouseKeeperInstallation support. The pinned operator can resolve a CHK reference using zookeeper.keeper.name; secure Keeper service ports are detected during reconciliation. Use the official Keeper reference and TLS configuration example as configuration references, reviewing their example image/settings before reuse.
Three voting members require a majority of two. Persistent state, peer connectivity, certificates and scheduling across failure domains still need validation. Do not pass a Pod name such as zookeeper-0 to a ZooKeeper image's numeric ZOO_MY_ID.
kubectl -n clickhouse get chk logs-keeper
kubectl -n clickhouse get chi logs-demo
kubectl -n clickhouse get pods,pvc,services,endpointslices
kubectl -n clickhouse get events --sort-by=.metadata.creationTimestamp
Log Ingestion Pipeline
Buffer → Store → Distributed 3-Tier Design
These are engine responsibilities, not three independent durable copies. MergeTree stores parts; ReplicatedMergeTree adds replication; Distributed routes reads/inserts across shards. The optional Buffer engine holds data in process memory before forwarding it to a destination table.
Use one consistent destination: logs.application_logs on each shard and logs.application_logs_distributed for cluster-wide access. Creating the same Distributed table twice with IF NOT EXISTS does not retarget the existing table. Inspect SHOW CREATE TABLE and migrate deliberately.
Prefer collector-side batching first. ClickHouse asynchronous inserts are another option: when enabled, wait_for_async_insert=1 waits for the buffered insert to be processed; acknowledge-before-flush modes weaken delivery/error feedback. Test the selected engine, user settings and retries together. The Vector example below uses synchronous batched inserts and a writer profile with foreground Distributed forwarding.
For comparison only, this optional Buffer table targets the same local storage table:
CREATE TABLE logs.application_logs_buffer ON CLUSTER logscluster
AS logs.application_logs
ENGINE = Buffer(
    logs, application_logs, 4,
    1, 10,
    1000, 10000,
    1000000, 10000000);
Buffer flushes when all minimum thresholds are reached or any maximum threshold is reached. Limits apply per buffer layer. Four layers × 10,000,000 bytes is a rough threshold budget, not a process-memory cap; source blocks, copies, queries and caches add memory. A crash can lose unflushed rows, and reordered blocks can defeat replicated insert deduplication. Do not route the default pipeline through this example or describe it as durable Kafka replay protection.
Log Table Schema
Execute cluster DDL with an administrative identity after verifying cluster name logscluster, Keeper and the {shard}/{replica} macros:
CREATE DATABASE IF NOT EXISTS logs ON CLUSTER logscluster;

CREATE TABLE IF NOT EXISTS logs.application_logs ON CLUSTER logscluster
(
    timestamp DateTime64(3, 'UTC') CODEC(Delta, ZSTD(1)),
    date Date MATERIALIZED toDate(timestamp),
    level LowCardinality(String),
    namespace LowCardinality(String),
    service LowCardinality(String),
    pod_name String,
    container_name LowCardinality(String),
    node_name LowCardinality(String),
    message String CODEC(ZSTD(1)),
    trace_id String,
    raw_json String CODEC(ZSTD(1)),
    response_time_ms Nullable(Float64)
        MATERIALIZED if(
            JSONType(raw_json, 'response_time_ms') IN ('Int64', 'UInt64', 'Double'),
            JSONExtract(raw_json, 'response_time_ms', 'Nullable(Float64)'),
            NULL)
)
ENGINE = ReplicatedMergeTree(
    '/clickhouse/logs-demo/tables/{shard}/application_logs', '{replica}')
PARTITION BY date
ORDER BY (namespace, service, timestamp)
TTL toDateTime(timestamp) + INTERVAL 90 DAY DELETE;

CREATE TABLE IF NOT EXISTS logs.application_logs_distributed ON CLUSTER logscluster
AS logs.application_logs
ENGINE = Distributed(
    'logscluster', 'logs', 'application_logs',
    cityHash64(namespace, service, pod_name));
The collector sends the ten ordinary columns; ClickHouse computes date and nullable response_time_ms. Missing or nonnumeric response times remain NULL, so non-request logs are not counted as zero-latency requests. raw_json is valid application JSON, separate from trusted Kubernetes metadata. Apply redaction before ingestion if the application can emit secrets or personal data.
Daily partitions suit this example's retention management; they are not universally optimal. The Keeper path is specific to this installation. Reusing it across unrelated installations can mix replication identities. IF NOT EXISTS is not a schema migration.
For SQL-managed accounts already provisioned through your secret process, configure grants/profiles on every participating server. File-managed users need equivalent file-managed permissions instead of assuming ALTER USER can modify them:
-- Users and credentials already exist through the site-owned secret configuration.
GRANT INSERT ON logs.application_logs TO log_writer;
GRANT INSERT ON logs.application_logs_distributed TO log_writer;
GRANT SELECT ON logs.application_logs TO log_reader;
GRANT SELECT ON logs.application_logs_distributed TO log_reader;

CREATE SETTINGS PROFILE logs_readonly
SETTINGS readonly = 1, max_execution_time = 60 CHANGEABLE_IN_READONLY;
ALTER USER log_reader SETTINGS PROFILE logs_readonly;

CREATE SETTINGS PROFILE logs_writer
SETTINGS distributed_foreground_insert = 1, async_insert = 0;
ALTER USER log_writer SETTINGS PROFILE logs_writer;
The writer's foreground Distributed insert waits for shard forwarding, but does not imply a chosen replica quorum, universal retry deduplication or protection from every storage failure. Review quorum, failure/retry semantics and permissions independently. Keep the Grafana reader read-only while permitting its required query timeout setting.
Ingestion via Vector
This is the Vector 0.58.0 configuration file. A DaemonSet, ServiceAccount/RBAC, read-only /var/log/pods access and writable /var/lib/vector must be supplied separately. Set the nonsecret VECTOR_SELF_NODE_NAME from the Pod's spec.nodeName using the Downward API. This source reads that variable itself; global environment interpolation is not needed.
Mount a Secret key password under /etc/vector/clickhouse-auth, and the trusted CA at /etc/vector/clickhouse-tls/ca.crt. Vector 0.58 uses the explicit SECRET[backend.key] backend below. Do not assume older ${CLICKHOUSE_PASSWORD} interpolation is enabled by default.
data_dir: /var/lib/vector

secret:
  clickhouse_auth:
    type: directory
    path: /etc/vector/clickhouse-auth
    remove_trailing_whitespace: true

sources:
  kubernetes:
    type: kubernetes_logs
    auto_partial_merge: true

transforms:
  project:
    type: remap
    inputs: [kubernetes]
    source: |
      raw = string(.message) ?? ""
      parsed, err = parse_json(raw)
      app = if err == null && is_object(parsed) { object!(parsed) } else { {} }
      namespace = string(.kubernetes.pod_namespace) ?? "unknown"
      service = string(.kubernetes.pod_labels."app.kubernetes.io/name") ??
        string(.kubernetes.pod_labels.app) ?? "unknown"
      pod = string(.kubernetes.pod_name) ?? "unknown"
      container = string(.kubernetes.container_name) ?? "unknown"
      node = string(.kubernetes.pod_node_name) ?? "unknown"
      event_time = if is_timestamp(.timestamp) { timestamp!(.timestamp) } else {
        parse_timestamp(string(.timestamp) ?? "", format: "%+") ?? now()
      }
      . = {
        "timestamp": event_time,
        "level": downcase(string(app.level) ?? "unknown"),
        "namespace": namespace,
        "service": service,
        "pod_name": pod,
        "container_name": container,
        "node_name": node,
        "message": string(app.message) ?? raw,
        "trace_id": string(app.trace_id) ?? "",
        "raw_json": encode_json(app)
      }

sinks:
  clickhouse:
    type: clickhouse
    inputs: [project]
    endpoint: https://logs-clickhouse.clickhouse.svc.cluster.local:8443
    database: logs
    table: application_logs_distributed
    format: json_each_row
    date_time_best_effort: true
    skip_unknown_fields: false
    auth:
      strategy: basic
      user: log_writer
      password: "SECRET[clickhouse_auth.password]"
    tls:
      ca_file: /etc/vector/clickhouse-tls/ca.crt
      verify_certificate: true
      verify_hostname: true
    batch:
      max_events: 10000
      timeout_secs: 2
    buffer:
      type: disk
      max_size: 536870912
      when_full: block
    query_settings:
      async_insert_settings:
        enabled: false
The transform projects a fixed schema rather than merging arbitrary application JSON into the event root. An application-provided kubernetes/namespace field cannot overwrite Kubernetes metadata. Malformed JSON remains readable in message; its parsed application object becomes {}. The timestamp is the collector event timestamp, not an untrusted application's claimed event time.
The 512MiB disk buffer requires actual writable persistent storage and a capacity policy. Backpressure does not stop kubelet log rotation indefinitely. kubernetes_logs is a best-effort file source, without end-to-end acknowledgement support; do not claim exactly-once or guaranteed lossless delivery because a sink has a disk buffer. This host-log collection model also does not cover EKS Fargate nodes.
The review compiled this configuration without environment/health checks and executed ten synthetic VRL cases. Actual Kubernetes access, Secret mounts, TLS handshakes and ClickHouse delivery still require deployment validation.
Ingestion via FluentBit
Fluent Bit's HTTP output can send newline-delimited JSON to ClickHouse's HTTP insert interface. Reuse a correctly installed collector with CRI/Docker framing, Kubernetes metadata, RBAC and a writable tail database/buffer. The outer CRI record is not application JSON.
Before using HTTP output, transform each record to the same ten-column contract shown above, and configure timestamp input parsing consistently. A raw Kubernetes record with nested kubernetes, arbitrary application keys and the wrong timestamp field is not the table schema. Do not hide the mismatch by blindly dropping unknown columns.
Use HTTPS with certificate verification and a separately managed writer credential. Render a protected Secret-backed configuration file if the selected Fluent Bit version requires a password string in its HTTP output configuration; do not publish a static Base64 admin:password header. The Vector path is the complete normalization example here; this section does not claim an unprovided Fluent Bit transform/DaemonSet has been tested.
Buffering via Kafka (Large-scale Environments)
Kafka can absorb bursts and provide replay within its configured retention. Provision authentication/TLS, replication, acknowledgements and disk capacity for the required outage window; Kafka does not automatically prevent every loss or duplicate.
The ClickHouse Kafka engine consumes a topic through a consumer group, and a materialized view transfers parsed rows into the same storage table. Keep one intentional group/partition assignment across consumers, avoid inserting every message into every shard, and monitor lag, parser failures and rejected messages. Credentials belong in managed server configuration, not SQL examples.
Kafka-engine tables do not support the ordinary default columns used above. Define only the incoming fields there and compute defaults/materialized values in the destination/view. Offset commits, downstream insert acknowledgement and retry behavior must be tested together. Avoid a memory Buffer destination when acknowledging durable processing is required; do not enable experimental Keeper-backed offset storage as an unqualified production default.
SQL Queries
Basic Queries
Recent errors use a relative timestamp range that still works across midnight:
SELECT timestamp, namespace, service, pod_name, message
FROM logs.application_logs_distributed
WHERE timestamp >= now() - INTERVAL 1 HOUR
  AND namespace = 'production' AND level = 'error'
ORDER BY timestamp DESC LIMIT 100;
Count log events and exact distinct Pod names:
SELECT toStartOfMinute(timestamp) AS minute, service,
       count() AS log_events, countIf(level = 'error') AS error_events,
       round(100.0 * error_events / nullIf(log_events, 0), 2) AS error_log_percent
FROM logs.application_logs_distributed
WHERE timestamp >= now() - INTERVAL 1 HOUR
  AND namespace = 'production'
GROUP BY minute, service ORDER BY minute, service;

SELECT namespace, service, uniqExact(pod_name) AS distinct_pods_with_logs
FROM logs.application_logs_distributed
WHERE timestamp >= now() - INTERVAL 1 HOUR
GROUP BY namespace, service ORDER BY distinct_pods_with_logs DESC;
error_log_percent is the percentage of log events marked error. It is not an HTTP request failure ratio unless the logging contract guarantees one relevant record per request. uniqExact is exact; uniq is approximate. Both queries describe observed logs, not the number of currently running Pods.
Advanced Analytics Queries
SELECT service, count(response_time_ms) AS measured_events,
       quantileExact(0.95)(response_time_ms) AS p95_ms
FROM logs.application_logs_distributed
WHERE timestamp >= now() - INTERVAL 1 HOUR
  AND namespace = 'production' AND isNotNull(response_time_ms)
GROUP BY service;

SELECT extract(message, '(TimeoutException|ConnectionError|OutOfMemoryError)') AS error_type,
       count() AS log_events
FROM logs.application_logs_distributed
WHERE timestamp >= now() - INTERVAL 1 DAY AND level = 'error'
GROUP BY error_type ORDER BY log_events DESC;

SELECT timestamp, service, pod_name, message
FROM logs.application_logs_distributed
WHERE timestamp >= now() - INTERVAL 1 DAY
  AND trace_id = '0123456789abcdef0123456789abcdef'
ORDER BY timestamp;
Latency aggregates include only events carrying a numeric response time. quantileExact is useful for explaining this bounded example but can consume significant memory; evaluate approximate aggregates for larger workloads. extract returns an empty string when no pattern matches, leaving an explicit unmatched group.
The trace ID is a 32-hex-character example, not a real trace. Correct propagation and matching fields across services are prerequisites. Sensitive query text, credentials and customer identifiers should not become unrestricted log fields.
Real-time Dashboard Queries
SELECT toStartOfHour(timestamp) AS hour, namespace,
       count() AS log_events, sum(length(message)) AS message_bytes
FROM logs.application_logs_distributed
WHERE timestamp >= now() - INTERVAL 1 DAY
GROUP BY hour, namespace ORDER BY hour;

SELECT namespace, pod_name, count() AS backoff_log_events
FROM logs.application_logs_distributed
WHERE timestamp >= now() - INTERVAL 1 DAY
  AND positionCaseInsensitive(message, 'Back-off restarting failed container') > 0
GROUP BY namespace, pod_name;
message_bytes counts message text bytes, not compressed table storage or network billing. Matching “Back-off” messages counts log events, not authoritative container restart counts; use Kubernetes state metrics for that. A SQL SELECT is a snapshot query. A dashboard becomes periodically refreshed through its refresh interval, not through a special live-stream property of this query.
Grafana Integration
ClickHouse Datasource Setup
Install/pin grafana-clickhouse-datasource 4.21.2 using your Grafana deployment mechanism and check that plugin's Grafana requirements. The provisioning template uses a hostname without scheme, numeric port, HTTP protocol plus TLS, and credentials under secureJsonData.
apiVersion: 1
datasources:
  - name: ClickHouse
    uid: clickhouse-logs
    type: grafana-clickhouse-datasource
    access: proxy
    jsonData:
      host: logs-clickhouse.clickhouse.svc.cluster.local
      port: 8443
      protocol: http
      secure: true
      tlsSkipVerify: false
      tlsAuthWithCACert: true
      username: log_reader
      defaultDatabase: logs
      logs:
        defaultDatabase: logs
        defaultTable: application_logs_distributed
        timeColumn: timestamp
        levelColumn: level
        messageColumn: message
    # Filled by the file-to-file renderer before provisioning.
    secureJsonData: {}
Populate the empty credential map before provisioning. For example, the following file-to-file renderer reads a mounted password and CA; it needs Python with PyYAML. It writes no secret to stdout and escapes literal $ characters for Grafana provisioning. Treat the resulting entire file as a Secret, not a ConfigMap or a Git-tracked artifact.
"""Render a complete Secret-backed provisioning file; requires PyYAML."""
import os
from pathlib import Path
import sys
import tempfile
import yaml

template, password_path, ca_path, output = map(Path, sys.argv[1:])
config = yaml.safe_load(template.read_text())
password = password_path.read_text().rstrip("\r\n")
ca = ca_path.read_text()
if not password or "-----BEGIN CERTIFICATE-----" not in ca:
    raise ValueError("A nonempty password and PEM CA file are required")
# Grafana provisioning expands $ variables even in quoted YAML scalars.
# Escape literal dollars; do not interpolate secrets through process environment.
config["datasources"][0]["secureJsonData"] = {
    "password": password.replace("$", "$$"),
    "tlsCACert": ca.replace("$", "$$"),
}
fd, temporary = tempfile.mkstemp(prefix=".clickhouse-", dir=output.parent)
try:
    with os.fdopen(fd, "w") as stream:
        yaml.safe_dump(config, stream, sort_keys=False)
    os.replace(temporary, output)
finally:
    if os.path.exists(temporary):
os.unlink(temporary)python3 render-grafana.py grafana-template.yaml \
/run/secrets/clickhouse/password /run/secrets/clickhouse/ca.crt \
/run/grafana-provisioning/clickhouse.yamlThe target directory must exist on a protected writable volume. Arrange file ownership/read permissions for the Grafana process and mount the completed file in its datasource provisioning directory. A Secret update does not by itself prove Grafana reloaded a datasource. Test the read-only account, CA validation and a real query; “Save & test” alone does not prove every query setting is permitted.
Grafana Dashboard Panels
Choose Time series for a time-plus-number query:
SELECT $__timeInterval(timestamp) AS time, count() AS log_events
FROM logs.application_logs_distributed
WHERE $__timeFilter(timestamp) AND namespace = 'production'
GROUP BY time ORDER BY time;
Use Logs/Explore with the configured timestamp, level and message columns for individual records. Grafana expands its macros before sending SQL; $__timeFilter is not executable ClickHouse SQL by itself.
Alert Rules
Use Grafana Alerting with this datasource rather than inventing a Prometheus metric named clickhouse_custom_query{query="..."}:
SELECT countIf(level = 'error') AS value
FROM logs.application_logs_distributed
WHERE $__timeFilter(timestamp) AND namespace = 'production';
Choose Table format for the single numeric row, then Reduce/Last and a threshold such as “above 10.” Define the evaluation interval, time range, pending period and contact policy explicitly. Ten is an exercise threshold, not a production recommendation. Export provisioning from the configured Grafana version instead of mixing Prometheus groups/rules/expr with Grafana's alerting schema.
countIf can return zero when no rows were ingested. Monitor ingestion separately, for example with a scheduled synthetic heartbeat:
SELECT $__timeInterval(timestamp) AS time, count() AS value
FROM logs.application_logs_distributed
WHERE $__timeFilter(timestamp) AND service = 'log-heartbeat'
GROUP BY time ORDER BY time;
This query returns no time-series rows when no heartbeat is present. Configure No Data and execution errors deliberately, account for ingestion lag, and test notification delivery.
HyperDX (ClickHouse Native Viewer)
Key Advantages
HyperDX is the observability UI used in ClickStack. It supports configuring sources over existing ClickHouse tables; using a custom schema is not inherently unsupported. Explicitly map timestamp, message/body, severity, service and trace fields to your schema, set a connection and restricted user, and verify search against representative records.
Do not treat a Buffer/Store/Distributed naming convention as automatic source discovery or claim a universal 20× speed improvement. HyperDX application/API release 2.38.0 and its separately versioned CLI are different artifacts. This guide does not prescribe a new ClickStack deployment over the custom cluster or claim integration was executed.
Log Viewer Comparison
| Viewer | Fit to evaluate |
|---|---|
| Grafana + ClickHouse plugin | SQL, existing dashboards, alerting and cross-datasource workflows |
| HyperDX / ClickStack | Observability search and correlation with explicitly configured sources/schema |
| SigNoz | Its own observability ingestion/model and UI; it also uses ClickHouse |
Compare the actual ingestion schema, authentication, query workflow, supported release and license for each component. An existing ClickHouse database does not make every observability UI a drop-in interchangeable frontend.
Performance Optimization
Table Design Optimization
Choose ORDER BY for frequent selective filters and locality; it is not a universal rule to put every frequently queried column first. LowCardinality(String) can help repeated namespace/service/level values; assess dictionary size and query behavior rather than enforcing a fixed universal distinct-value cutoff.
Partition for manageable retention and merges, not maximum possible granularity. Hourly partitioning over 90 days can retain roughly 2,160 hourly partitions, not only 24–48. Late events can also write into old partitions.
Parts Optimization
SELECT partition, count() AS active_parts,
       sum(rows) AS rows, sum(bytes_on_disk) AS bytes_on_disk
FROM system.parts
WHERE active AND database = 'logs' AND table = 'application_logs'
GROUP BY partition ORDER BY partition;

SELECT database, table, is_readonly, is_session_expired,
       queue_size, absolute_delay
FROM system.replicas
WHERE database = 'logs';

SELECT database, table, is_blocked, error_count, last_exception
FROM system.distribution_queue WHERE database = 'logs';
These system-table queries describe the connected server. Inspect every relevant replica/shard for cluster-wide operations. Track part creation/merges, replication lag and Distributed queues. Batch small inserts; a particular part count or target part size is not a universal threshold. Avoid routine OPTIMIZE FINAL as a substitute for fixing excessive small inserts.
Query Optimization
Filter timestamp and leading sort-key columns where appropriate, select only needed columns, and inspect EXPLAIN/query-log read rows and bytes. A lower-cardinality label is not always the best leading key; test the actual query mix.
The main log table does not define a sampling expression, so appending SAMPLE 0.1 to it is invalid. A separate demonstration table can define a deterministic unsigned sampling key included in its primary/sort key:
CREATE TABLE logs.sample_demo
(
    event_id UInt64,
    message String
)
ENGINE = MergeTree
ORDER BY cityHash64(event_id)
SAMPLE BY cityHash64(event_id);

SELECT count() * 10 AS estimated_events
FROM logs.sample_demo SAMPLE 0.1;
The fraction is a sampling-key interval, not a promise of exactly 10% of a finite set of rows. Scale additive counts as appropriate; do not multiply averages or percentiles by ten. Sampling must also be representative for the question being asked.
System Configuration Optimization
max_threads and max_memory_usage are query/user-profile settings. Put them in profiles or per-query settings, not arbitrary top-level server XML. Server caches and background pools consume additional resources outside a single query limit. Account for concurrent queries, merges and ingest buffers before setting a Pod memory limit.
Use bounded test workloads and observe CPU throttling, memory, I/O, merge backlog and failure recovery before changing settings. A low query limit does not cap the whole process.
Resource Guidelines
Size from daily ingested bytes, measured compression, retained days, replication, query concurrency and peak merge/ingest overhead. For illustration, a measured 5:1 reduction of 1TB/day produces about 200GB/day of compressed data; 90 days is about 18TB before replication and operational headroom. Two replicas roughly double stored copies. This arithmetic is not a measured capacity result or an AWS bill.
On EKS, include EBS provisioned performance/capacity, cross-AZ traffic, node architecture, failure-domain placement and replacement capacity. Fargate does not provide the same host-log/volume topology as a node-based collector/ClickHouse deployment.
S3 Archiving and Long-term Retention
Archiving Pipeline
Separate two designs:
- Cold table storage: ClickHouse manages its own parts and metadata on a configured S3 disk/volume. Preserve local metadata and use distinct object namespaces per replica as required by the selected disk design. Do not manually lifecycle-delete objects that a live ClickHouse table still owns.
- Independent archive: Export selected rows to versioned, inventoried Parquet objects. Define completeness, late-arrival handling, access control and restore/query tests separately.
For cold storage, configure the server's storage policy with a cold volume and explicitly select that policy on the table:
-- Separate example: the server must already define the logs_tiered policy.
CREATE TABLE logs.tiered_example
(
    timestamp DateTime,
    message String
)
ENGINE = MergeTree
ORDER BY timestamp
TTL timestamp + INTERVAL 7 DAY TO VOLUME 'cold',
    timestamp + INTERVAL 90 DAY DELETE
SETTINGS storage_policy = 'logs_tiered';
logs_tiered must exist before this example is created. TTL work is asynchronous; it is not an exact per-row deletion deadline. A TTL clause cannot create S3 permissions or the storage policy. This review exercised a local-disk analogue of the policy, not an S3 deployment.
Use the server workload's AWS identity and bucket/prefix-scoped permissions, private bucket controls, encryption and the applicable KMS permissions. Merely setting use_environment_credentials does not create a ServiceAccount identity association or prove that your credential provider is supported by the selected ClickHouse build.
Direct S3 Archiving
The following historical January 2025 range illustrates syntax; it is not a benchmark or a claim those records still exist under a 90-day TTL. Replace the bucket, range and RUN_ID with your owned archive job's values.
-- Historical January 2025 example; replace range and the unique owned export prefix.
INSERT INTO FUNCTION s3(
    'https://EXAMPLE-ARCHIVE.s3.ap-northeast-2.amazonaws.com/logs/export-RUN_ID/{_partition_id}.parquet',
    'Parquet'
)
PARTITION BY toYYYYMMDD(timestamp)
SELECT timestamp, level, namespace, service, pod_name, container_name,
       node_name, message, trace_id, raw_json
FROM logs.application_logs_distributed
WHERE timestamp >= toDateTime64('2025-01-01 00:00:00', 3, 'UTC')
  AND timestamp < toDateTime64('2025-02-01 00:00:00', 3, 'UTC')
SETTINGS s3_truncate_on_insert = 0,
         s3_create_new_file_on_insert = 0,
         output_format_parquet_compression_method = 'zstd';
PARTITION BY supplies the {_partition_id} replacement. The Distributed source covers the intended shards; exporting one local replica alone does not cover a sharded cluster. Use a new reserved prefix per execution, never an uncontrolled shared filename. The settings reject overwrite/automatic extra files; they do not implement a distributed lock or make a partial export atomic.
Select one authoritative copy per shard through the intended Distributed topology; do not union all replicas and double-count. Validate exported row counts, timestamp bounds, schema, representative aggregates and readable objects before declaring success or changing source retention.
Watermark-based Progress Tracking
A watermark is a progress record, not proof of completeness. A plain MergeTree table does not enforce a unique job key or compare-and-swap lock. Use a single owner or external transactional lease/state store for concurrent jobs.
Record the job ID, source cluster/table/schema version, exclusive time range, shard coverage, output prefix/object manifest and validation result. Mark completion only after all expected outputs are checked. Retry partial exports under an explicit ownership policy; deduplicate overlapping ranges when reading them.
Choose any late-arrival delay from actual data. A fixed “merge after three days” assumption neither closes old partitions to writes nor guarantees that all delayed events arrived. Handle corrections/replays explicitly and retain the previous successful watermark after a failed export.
Querying Archived Data Directly
SELECT namespace, service, count() AS log_events
FROM s3(
    'https://EXAMPLE-ARCHIVE.s3.ap-northeast-2.amazonaws.com/logs/export-RUN_ID/*.parquet',
    'Parquet'
)
WHERE timestamp >= toDateTime64('2025-01-01 00:00:00', 3, 'UTC')
  AND timestamp < toDateTime64('2025-02-01 00:00:00', 3, 'UTC')
GROUP BY namespace, service;
Only query completed, validated export prefixes. Archive classes that require restore must be restored before ordinary S3 reads. Estimate cost using the selected Region, stored bytes, storage class, request/retrieval charges, replication and retention. A universal “90% compression” or “$2.3 per raw TB-month” figure would hide these assumptions.
References and Validation Scope
- ClickHouse LTS release
- Altinity Operator release
- Buffer engine and limitations
- Kafka engine
- Sampling
- S3 table function
- Vector ClickHouse sink
- Vector Kubernetes source
- Vector secret backends
- Grafana ClickHouse configuration
- Grafana ClickHouse alerting
- HyperDX source
Native local checks cover SQL parsing, synthetic schema/query behavior, Vector transforms, operator chart rendering and schema/configuration contracts. They do not establish cluster compatibility, HA/failover, actual Kafka/S3 ingestion, IAM, TLS or production capacity. Validate those against the deployed environment before using this design.
Quiz
Test your understanding with the ClickHouse quiz.