Observability
Supported Versions: Istio 1.31 Last Updated: September 11, 2026
Istio proxies generate telemetry for traffic they observe. Metrics scraping, access logging, trace providers and storage must be configured. Applications must propagate trace context between incoming and outgoing requests to connect spans; application-internal spans and exceptions need application instrumentation/logging.
Table of Contents
- Observability Overview
- Three Pillars of Observability
- Observability Architecture
- Golden Signals
- Detailed Documentation
- Observability Best Practices
- Next Steps
Observability Overview
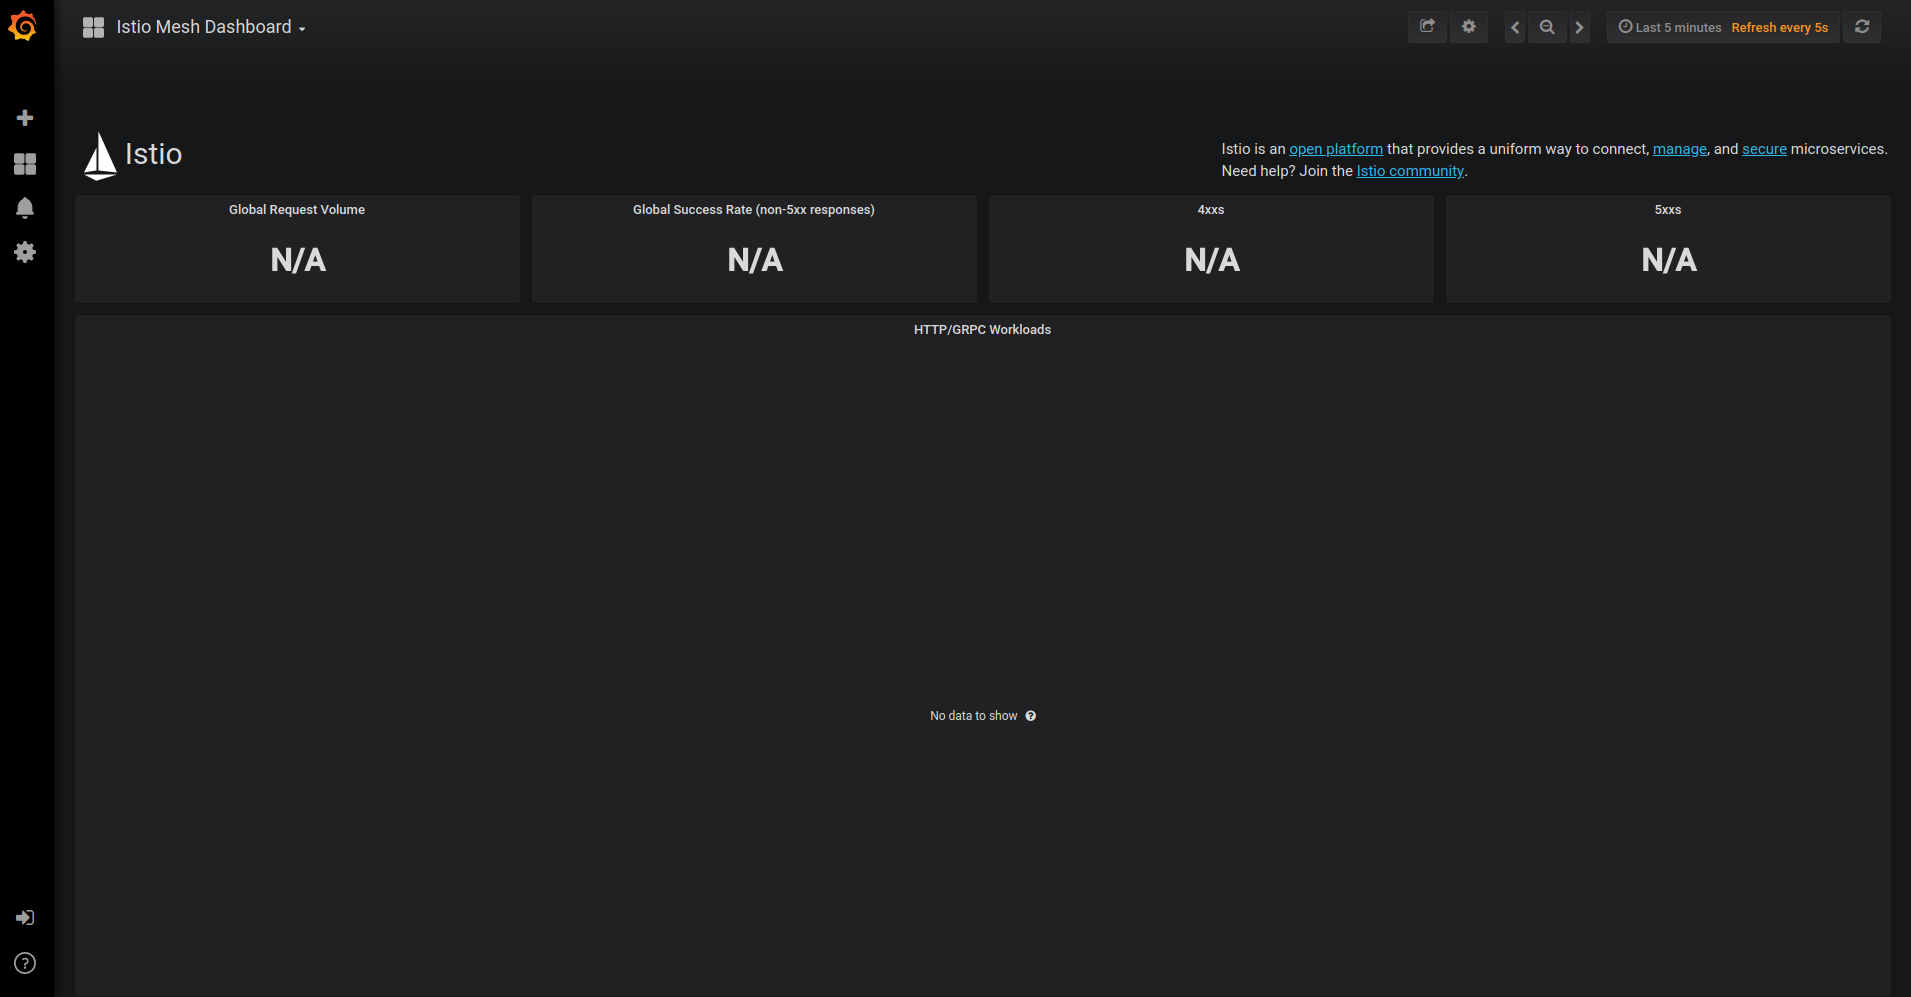
Sidecars and waypoints can report HTTP metrics, spans and access logs without adding proxy instrumentation to application code. Ambient ztunnel provides L4 telemetry; HTTP-level observation requires a waypoint. CPU, memory and packet-level host metrics come from Kubernetes/node exporters rather than Istio request metrics. The screenshot illustrates a configured dashboard, not a component installed automatically with Istio.
Three Pillars of Observability
The Three Elements of Observability
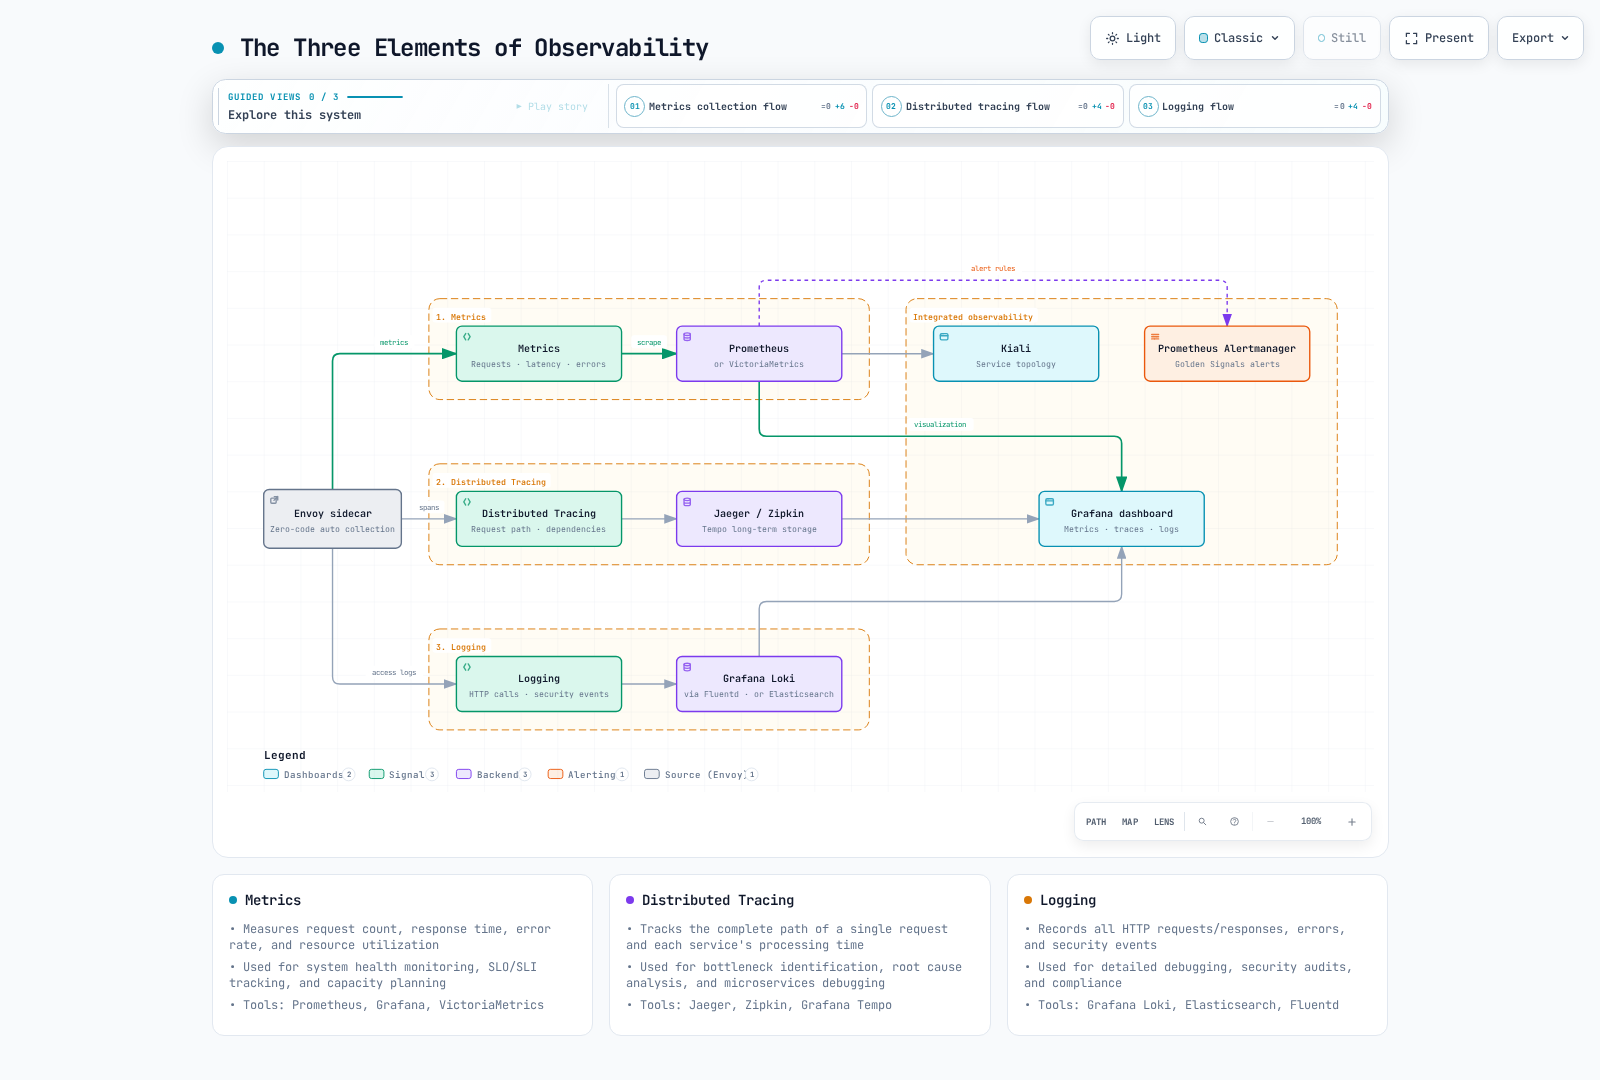
1. Metrics
What is measured?
- Request count, response time, error rate
- Resource utilization (CPU, memory)
- Network traffic (Bytes, Packets)
When to use?
- System health monitoring
- SLO/SLI tracking
- Capacity planning
Key Tools: Prometheus, Grafana, VictoriaMetrics
2. Distributed Tracing
What is tracked?
- Complete path of a single request
- Processing time for each service
- Service dependencies
When to use?
- Performance bottleneck identification
- Root cause analysis of failures
- Microservices debugging
Key Tools: Jaeger, Zipkin, Grafana Tempo
3. Logging
What is recorded?
- Configured HTTP access metadata (not full request/response bodies)
- Proxy errors; application exceptions need application logs
- Security events
When to use?
- Detailed debugging
- Security audits
- Compliance requirements
Key Tools: Grafana Loki, Elasticsearch, Fluentd
Observability Architecture
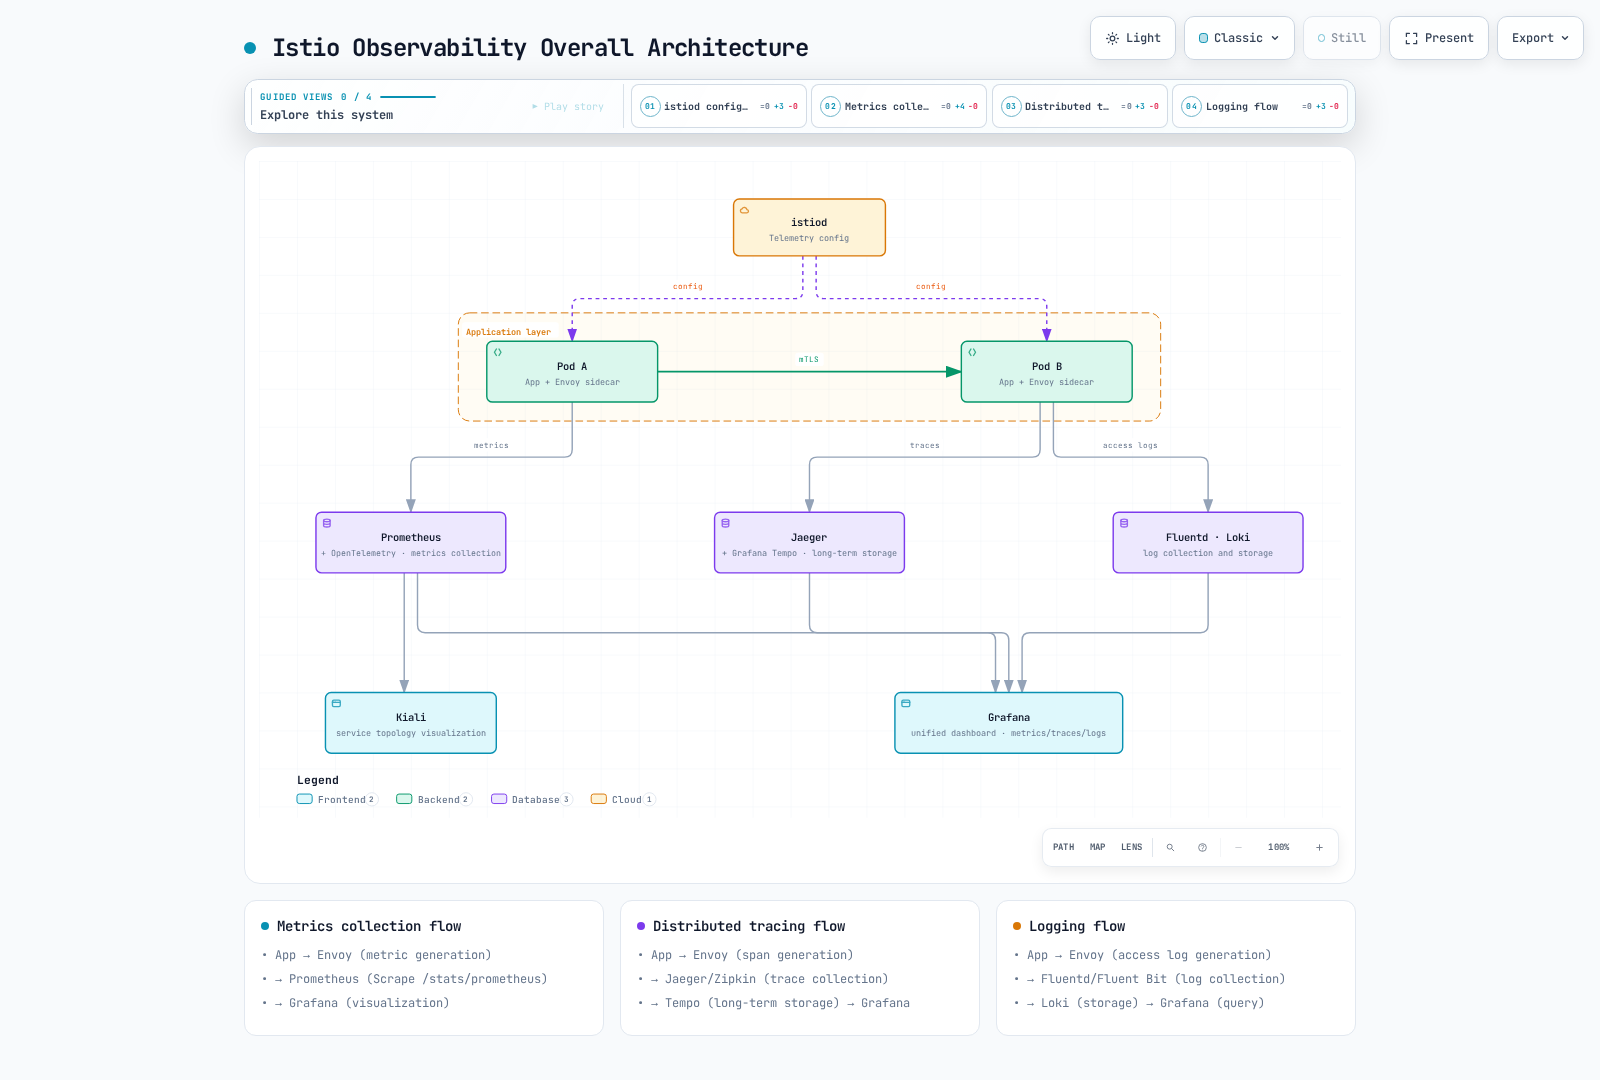
Overall Architecture
Data Flow
1. Metrics Collection Flow:
App → Envoy (metric generation)
    → Prometheus (Scrape /stats/prometheus)
    → Grafana (visualization)
2. Distributed Tracing Flow:
App propagates context → Envoy generates spans
    → configured collector/protocol (for example OpenTelemetry/OTLP)
    → one chosen backend: Jaeger, Zipkin or Tempo
    → backend UI or configured Grafana datasource
3. Logging Flow:
App → Envoy (Access Log generation)
    → Fluentd/Fluent Bit (log collection)
    → Loki (log storage)
    → Grafana (log query and visualization)
Golden Signals
Core signals following Google SRE principles. The HTTP queries select reporter="destination" to avoid counting both source and destination observations of the same mesh hop. They measure service hops, not unique user transactions. Analyze external/gateway traffic without a destination reporter separately; gRPC application failures also require grpc_response_status. Latency values below are milliseconds.
1. Latency
# P50 latency
histogram_quantile(0.50,
  sum(rate(istio_request_duration_milliseconds_bucket{reporter="destination"}[5m])) by (le)
)

# P95 latency
histogram_quantile(0.95,
  sum(rate(istio_request_duration_milliseconds_bucket{reporter="destination"}[5m])) by (le)
)

# P99 latency
histogram_quantile(0.99,
  sum(rate(istio_request_duration_milliseconds_bucket{reporter="destination"}[5m])) by (le)
)
2. Traffic
# Requests per second (RPS)
sum(rate(istio_requests_total{reporter="destination"}[5m]))

# Traffic by service
sum(rate(istio_requests_total{reporter="destination"}[5m])) by (destination_service)
3. Errors
# Error rate (%)
sum(rate(istio_requests_total{reporter="destination",response_code=~"5.."}[5m]))
/
sum(rate(istio_requests_total{reporter="destination"}[5m]))
* 100

# 4xx vs 5xx errors
sum(rate(istio_requests_total{reporter="destination",response_code=~"4.."}[5m])) by (response_code)
sum(rate(istio_requests_total{reporter="destination",response_code=~"5.."}[5m])) by (response_code)
4. Saturation
# CPU consumption in cores (not percent), one series per application container.
sum by (namespace, pod, container) (
  rate(container_cpu_usage_seconds_total{container!="",container!="POD"}[5m])
)

# Memory working set / configured limit (%); containers without limits omitted.
100 * max by (namespace, pod, container) (
  container_memory_working_set_bytes{container!="",container!="POD"}
)
/ on (namespace, pod, container)
(max by (namespace, pod, container) (
  kube_pod_container_resource_limits{resource="memory",unit="byte"}
) > 0)
These require kubelet/cAdvisor and kube-state-metrics scraping; they are not Istio metrics. Avoid duplicate scrape targets and include cluster labels in multi-cluster aggregations. Usage relative to a limit is only one capacity signal; also inspect throttling, queueing and pending work.
Observability Best Practices
1. Use Standard Metrics
Recommended:
- Prioritize using Istio standard metrics
- Add custom metrics only when necessary
- Minimize labels considering cardinality
Avoid:
- Excessive custom metrics
- High cardinality labels (user_id, request_id, etc.)
2. Trace Sampling
Set appropriate sampling rates for production environments:
An OTLP collector Service must already exist at the address below and export to the selected backend. Merge the provider into existing installation settings, then configure sampling through the Telemetry API:
# istioctl install -f input, not kubectl apply
apiVersion: install.istio.io/v1alpha1
kind: IstioOperator
spec:
  meshConfig:
    enableTracing: true
    extensionProviders:
    - name: otel
      opentelemetry:
        service: otel-collector.observability.svc.cluster.local
port: 4317apiVersion: telemetry.istio.io/v1
kind: Telemetry
metadata:
name: mesh-tracing
namespace: istio-system
spec:
tracing:
- providers:
- name: otel
randomSamplingPercentage: 1.01.0 means 1%, not 100%. Choose sampling based on traffic volume, investigation needs and collector/backend capacity; 100% may suit a small test environment, while lower rates need validation in production. Context propagation is still required. Do not add a second selector-free Telemetry resource in the same namespace: merge tracing/access logging into one resource when using both examples.
3. Access Log Optimization
The following filters requests, not fields. Configure field selection/redaction in the access-log provider. This HTTP filter omits successful requests, so it cannot serve as a complete access audit:
apiVersion: telemetry.istio.io/v1
kind: Telemetry
metadata:
  name: mesh-default
  namespace: istio-system
spec:
  accessLogging:
  - providers:
    - name: envoy
    filter:
      expression: response.code >= 400  # Record only errors
4. Metrics Retention Policy
Example retention ranges to adapt to operational needs, storage cost and actual retention requirements (not regulatory defaults):
- Real-time metrics: 1-7 days (high resolution)
- Long-term metrics: 30-90 days (downsampled)
- Traces: 7-30 days
- Logs: Defined by the actual retention policy; 30–365 days is only an example
Prometheus local TSDB does not automatically downsample old data. Use an explicitly configured backend supporting downsampling/long-term storage if needed.
5. Alert Configuration
Thresholds below are examples; prefer service SLOs and sustained error-budget burn with minimum traffic volume to reduce noise.
Critical Alerts (immediate response):
- Error rate > 5%
- P99 latency > threshold
- Service down
Warning Alerts (monitoring):
- Error rate > 1%
- P95 latency increase
- Resource utilization > 80%
Detailed Documentation
Detailed guides for each area of observability:
1. Metrics
Learn the following in the Metrics Guide:
- Istio standard metrics
- Prometheus integration
- OpenTelemetry integration
- Adding custom metrics
- Metrics optimization
Key Topics:
istio_requests_total: Total request countistio_request_duration_milliseconds: Request latencyistio_request_bytes/istio_response_bytes: Request / response size histograms- Circuit Breaker metrics
- Telemetry API customization
2. Distributed Tracing
Learn the following in the Distributed Tracing Guide:
- Jaeger integration
- Zipkin integration
- Trace sampling
- Context propagation
- Performance analysis
Key Topics:
- Trace Context propagation (W3C Trace Context)
- Span creation and management
- Backend selection (Jaeger, Zipkin, Tempo)
- Sampling strategies
- Trace analysis
3. Logging
Learn the following in the Logging Guide:
- Access Log configuration
- Log format customization
- Grafana Loki integration
- Log filtering
- Log aggregation
Key Topics:
- Envoy Access Log format
- JSON structured logs
- Log level configuration
- Log collection (Fluentd, Fluent Bit)
- Log queries (LogQL)
4. Dashboards
Learn the following in the Dashboards Guide:
- Grafana dashboards
- Kiali service graph
- Custom dashboard creation
- Alert rule configuration
Key Topics:
- Istio standard dashboards
- Service Mesh dashboard
- Workload dashboard
- Kiali traffic visualization
- SLO dashboards
Next Steps
- Metrics: Prometheus metric collection and queries
- Distributed Tracing: Jaeger/Zipkin trace analysis
- Logging: Access Log and Loki integration
- Dashboards: Grafana and Kiali dashboards
References
Official Documentation
Related Projects
Standards and Specifications
Quiz
To test your knowledge from this chapter, try the Istio Observability Quiz.