Grafana Dashboards
Supported versions: Grafana 13.2.1 · Community Helm chart 13.2.2
Last Updated: September 13, 2026
Introduction
Grafana queries Prometheus, Loki, Tempo, CloudWatch and other data sources, and provides dashboards and alerting. Its metadata database is separate from the backends that retain metrics, logs and traces. The runnable examples connect to existing backends in one cluster. See the observability stack lab for backend deployment.
Architecture
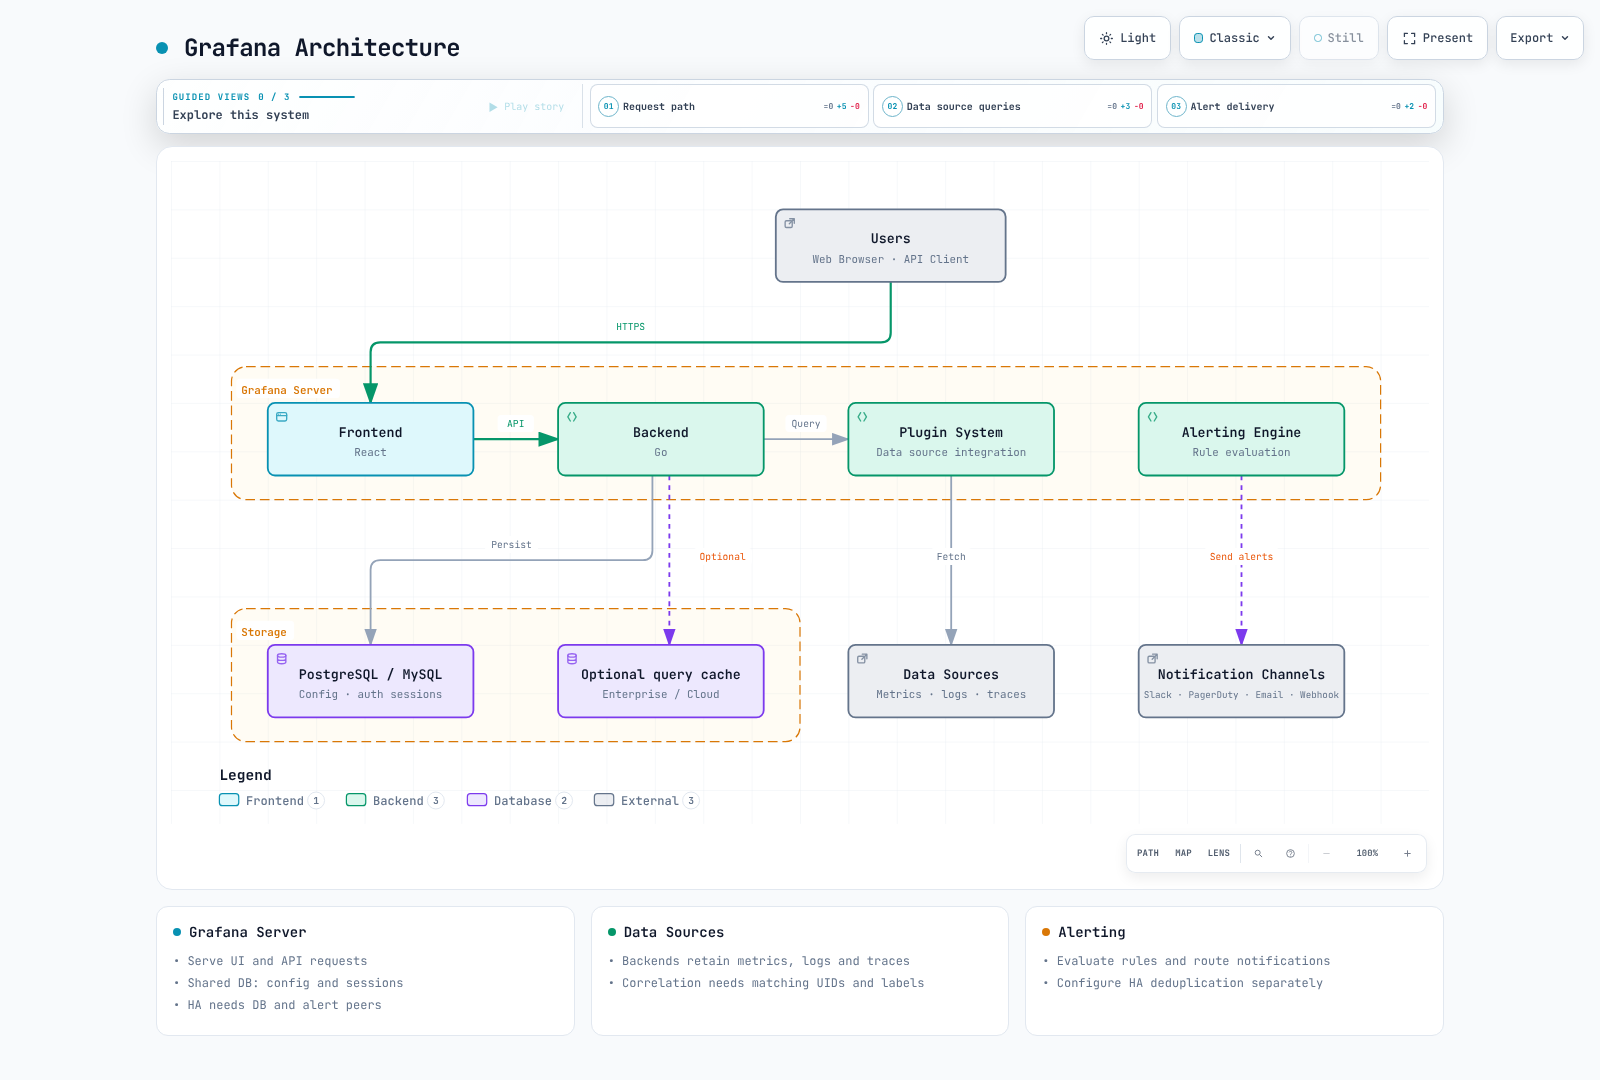
| Component | Responsibility |
|---|---|
| Grafana database | Users, dashboards, configuration and authentication sessions; shared PostgreSQL/MySQL for HA |
| Data sources | Actual metric, log and trace queries and retention |
| Grafana Alerting | Evaluation and notification routing; notification deduplication needs separate HA configuration |
| Optional query cache | Supported Enterprise/Cloud capability; Redis is not a required session store |
Helm Deployment
Basic Installation
The default profile uses one replica, SQLite, a RWO PVC and Recreate updates. It requires the gp3 StorageClass and CSI driver and can be unavailable during upgrades. HA is a separate profile. The chart comes from the community repository; its version and the image digest are pinned.
Check out this repository and edit all three URLs in endpoints.yaml to match actual Services and ports. The Tempo 3.x example uses HTTP API port 3200, which differs from OTLP ingestion ports. The placeholder service names do not create backends. If the lab backends require mTLS, add their CA/client certificate configuration to the data sources; plain HTTP cannot bypass it.
These commands are for a new installation. Rotate existing credentials through your established process instead of overwriting Secrets. Read the generated private password file locally when logging in; keep its contents out of Git, values files and terminal logs.
helm repo add grafana-community https://grafana-community.github.io/helm-charts
helm repo update grafana-community
kubectl create namespace monitoring --dry-run=client -o yaml | kubectl apply -f -
cd examples/observability/grafana

umask 077
GRAFANA_STATE=$(mktemp -d "$PWD/.grafana-private.XXXXXX")
printf '%s' admin > "$GRAFANA_STATE/admin-user"
python3 -c 'import secrets; print(secrets.token_hex(24), end="")' > "$GRAFANA_STATE/admin-password"
python3 -c 'import secrets; print(secrets.token_hex(32), end="")' > "$GRAFANA_STATE/secret-key"
python3 -c 'import secrets; print(secrets.token_hex(24), end="")' > "$GRAFANA_STATE/metrics-password"
kubectl -n monitoring create secret generic grafana-admin-credentials \
  --from-file=admin-user="$GRAFANA_STATE/admin-user" \
  --from-file=admin-password="$GRAFANA_STATE/admin-password"
kubectl -n monitoring create secret generic grafana-runtime \
  --from-file=secret-key="$GRAFANA_STATE/secret-key" \
  --from-file=metrics-password="$GRAFANA_STATE/metrics-password"

kubectl apply -f endpoints.yaml
kubectl -n monitoring create configmap grafana-datasources --from-file=datasources.yaml
kubectl -n monitoring create configmap grafana-alerts --from-file=alerts.yaml
kubectl -n monitoring create configmap grafana-docs-dashboards --from-file=dashboard.json
helm upgrade --install grafana grafana-community/grafana --version 13.2.2 \
  --namespace monitoring --values values.yaml --wait
kubectl -n monitoring port-forward service/grafana 3000:80 --address 127.0.0.1
Open http://localhost:3000. The Service is ClusterIP and port forwarding binds only to loopback. Before exposing Grafana, configure authentication, TLS and approved network/access policies.
values.yaml Configuration
replicas: 1
deploymentStrategy:
  type: Recreate
persistence:
  enabled: true
  type: pvc
  storageClassName: gp3
  size: 10Gi
  accessModes:
  - ReadWriteOnce
admin:
  existingSecret: grafana-admin-credentials
  userKey: admin-user
  passwordKey: admin-password
serviceAccount:
  create: true
  name: grafana
  automountServiceAccountToken: false
The full file connects Secret mounts, fixed data source UIDs, dashboard files and a paused alert. For mounted ConfigMap provisioning, restart Pods in sequence after updating files so provisioning runs again. Supply each intended values file explicitly instead of retaining unknown historical settings with --reuse-values.
High Availability
values-ha.yaml adds two replicas, disables the shared PVC, and configures external PostgreSQL with verify-full, a headless Service and Alerting gossip. Prepare database HA, backups and recovery separately. Do not share one SQLite file between Grafana replicas.
The example database/user are grafana. Prepare a grafana-database Secret containing host (certificate-matching DNS:5432), password and ca.crt; mount the same grafana-runtime/secret-key on both Pods. Replace root_url with the real external HTTPS address and configure TLS termination. Moving existing SQLite data requires a separate migration and recovery check; changing the database type does not migrate it.
helm upgrade --install grafana grafana-community/grafana --version 13.2.2 \
  -n monitoring -f values.yaml -f values-ha.yaml --wait
Peer DNS assumes release grafana and namespace monitoring; update it if either changes. Permit TCP/UDP 9094 between Grafana Pods and only required DNS, database and backend connectivity. Authentication sessions are stored in the shared Grafana database, so Redis sessions or load-balancer affinity are not required for login continuity.
Alerting HA requires peer connectivity and deduplication configuration. Account for evaluation on each node under the default configuration. Version 13.2.1 also has ha_single_node_evaluation, but this example keeps its default. Deduplication does not guarantee exactly-once notification delivery under network partitions. Native validation used one Grafana instance and did not execute database failover for this HA profile.
Data Source Integration
File Provisioning and UIDs
datasources.yaml fixes Prometheus=prometheus, Loki=loki and Tempo=tempo. Dashboards, alerts and correlation links must use matching UIDs. Environment variables supply values inside provisioning files; setting variables alone does not create data source objects.
apiVersion: 1
datasources:
- name: Prometheus
  type: prometheus
  uid: prometheus
  url: $PROMETHEUS_URL
  access: proxy
  isDefault: true
  editable: false
  jsonData:
    httpMethod: POST
    exemplarTraceIdDestinations:
    - name: trace_id
      datasourceUid: tempo
- name: Loki
  type: loki
  uid: loki
  url: $LOKI_URL
  access: proxy
  editable: false
  jsonData:
    derivedFields:
    - name: TraceID
      matcherRegex: '"trace_id"\s*:\s*"([a-f0-9]{32})"'
      url: $${__value.raw}
      datasourceUid: tempo
- name: Tempo
  type: tempo
  uid: tempo
  url: $TEMPO_URL
  access: proxy
  editable: false
  jsonData:
    tracesToLogsV2:
      datasourceUid: loki
      tags:
      - key: service.name
        value: service_name
      spanStartTimeShift: -5m
      spanEndTimeShift: 5m
      customQuery: true
      query: '{$${__tags}} | json | trace_id="$${__span.traceId}"'
    tracesToMetrics:
      datasourceUid: prometheus
      tags:
      - key: service.name
        value: service
      queries:
      - name: Request rate
        query: sum(rate(lab_http_requests_total{$${__tags}}[5m]))
    serviceMap:
      datasourceUid: prometheus
    nodeGraph:
      enabled: true
These links use the lab application's service.name, Loki's service_name, the metric label service, and JSON log field trace_id. Adapt them to actual labels for other pipelines. $${...} preserves Grafana's ${...} link macros through file provisioning. ${__tags} expands to matchers such as service="..."; wrapping it again inside service="${__tags}" creates an invalid selector.
Exemplars connect selected metric observations to traces; they do not contain every request's trace. Exporter support, Prometheus exemplar ingestion and trace retention must align. serviceMap requires service graph metrics from Tempo's metrics-generator in Prometheus. Merely configuring a UID does not generate service graphs.
CloudWatch IRSA
Attach an approved IRSA role to Grafana's ServiceAccount and restrict its OIDC trust to the exact namespace/ServiceAccount and aud. Verify token projection and SDK credential acquisition in the Pod. Data source authType: default uses that credential chain. Do not redundantly set assumeRoleArn to the same role; use it for a deliberate additional role assumption with the necessary trust and sts:AssumeRole permissions.
Start with cloudwatch:ListMetrics and cloudwatch:GetMetricData for metric queries. Add Logs, EC2, tag or X-Ray permissions only for features you use. For actions without resource-level permissions, constrain Resource: "*" with applicable Region conditions; scope Logs access to actual log groups. Do not combine all AWS read actions in one unconditional wildcard statement. The default example creates no AWS credentials or resources.
Dashboard Design Patterns
dashboard.json is complete JSON with eight panels. Application panels use lab_http_* from the MSA lab. Node panels require node-exporter; the CrashLoop panel requires kube-state-metrics.
| Method | Signals | Interpretation |
|---|---|---|
| RED: Rate, Errors, Duration | Request rate, 5xx percentage, histogram p99 | Do not turn missing or zero request traffic into 100% success |
| USE: Utilization, Saturation, Errors | CPU/memory use, disk queue pressure, network errors | Weighted I/O time is not a disk error counter |
| Four Golden Signals | Latency, Traffic, Errors, Saturation | Availability is an important separate SLI, not one of these four names |
Only fill a missing error series with zero when the corresponding request series exists:
((sum by (service) (rate(lab_http_requests_total{status=~"5.."}[5m])) or 0 * sum by (service) (rate(lab_http_requests_total[5m]))) / (sum by (service) (rate(lab_http_requests_total[5m])) > 0)) * 100The denominator excludes zero traffic. Show missing collection and no traffic separately. rate(node_disk_io_time_weighted_seconds_total[5m]) estimates average I/O queue pressure; increase(...) does not count disk errors. node_load1 includes runnable tasks and I/O waits and is not a pure measure of CPU saturation.
The dashboard assumes one cluster. When combining clusters in a central backend, consistently attach cluster labels and include them in selectors, grouping and joins. Pod metric joins need at least namespace and pod. Add cluster/namespace variables only when those labels exist. Multi/all selections need regex matchers and ${variable:regex} escaping. Variables and folders are not data source access controls.
Dashboard Provisioning
Sidecar
The default mounted-file profile requires no Kubernetes API token/RBAC. Add values-sidecar.yaml when you need dynamic ConfigMap watching. This optional profile uses a namespaced Role, reads only ConfigMaps in monitoring, and selects grafana_dashboard: "true". The label/value are configurable, not universal Grafana requirements. Anyone able to write matching ConfigMaps can change the provisioned content.
The chart's default namespaced Role also reads Secrets. Create the ConfigMap-only Role in sidecar-role.yaml first and reference it with useExistingRole.
kubectl apply -f sidecar-role.yaml
helm upgrade grafana grafana-community/grafana --version 13.2.2 \
  -n monitoring -f values.yaml -f values-sidecar.yaml
This provider uses a separate Sidecar folder; data source and alert sidecars remain disabled. Do not copy searchNamespace: ALL and broad Secret access as routine defaults. To retain changes to a read-only provisioned dashboard, update its source file.
Grafana Operator
An Operator deployment first needs the matching controller/CRDs and a Grafana instance selected by its GrafanaDashboard/GrafanaDatasource resources. Do not let a separate Helm deployment and Operator compete for ownership. This chapter validates Helm file provisioning, not an Operator installation. Ellipses such as panels: [...] are not valid deployable JSON; use the complete dashboard.json as dashboard content.
Alert Rules (Grafana Alerting)
Use [unified_alerting] in 13.2.1; do not enable the removed legacy [alerting] configuration. The example retains labels through A=CPU range query, B=last reduction and C=>80 threshold. classic_conditions is unsuitable when you need multidimensional alert labels.
apiVersion: 1
groups:
- orgId: 1
  name: grafana-docs
  folder: Observability
  interval: 1m
  rules:
  - uid: docs-high-cpu
    title: Sustained CPU usage
    condition: C
    data:
    - refId: A
      relativeTimeRange:
        from: 300
        to: 0
      datasourceUid: prometheus
      model:
        refId: A
        expr: 100 * (1 - avg by (instance) (rate(node_cpu_seconds_total{mode="idle"}[5m])))
        instant: false
        range: true
        intervalMs: 15000
        maxDataPoints: 43200
    - refId: B
      relativeTimeRange:
        from: 0
        to: 0
      datasourceUid: __expr__
      model:
        refId: B
        type: reduce
        expression: A
        reducer: last
    - refId: C
      relativeTimeRange:
        from: 0
        to: 0
      datasourceUid: __expr__
      model:
        refId: C
        type: threshold
        expression: B
        conditions:
        - type: query
          evaluator:
            type: gt
            params:
            - 80
          operator:
            type: and
          query:
            params:
            - C
          reducer:
            type: last
            params: []
    noDataState: NoData
    execErrState: Error
    for: 5m
    isPaused: true
    annotations:
      summary: High CPU on {{ $labels.instance }}
    labels:
      severity: warning
The rule installs paused. Validate real data, evaluation results, notification policy and contacts before unpausing it. for: 5m is pending duration; interval: 1m is evaluation frequency. Do not hide NoData/Error as normal. Frequent restarts do not prove a container is currently in CrashLoopBackOff; use the waiting-reason metric for that state.
Provision Slack/PagerDuty contacts using the documented schema and values from Secrets. Use a built-in notification template or explicitly define a custom template before referencing it; undefined names such as slack.title fail. A contact point alone does not establish routing: attach the receiver to a notification policy. Send real tests only to an approved destination. This audit sent no external notifications.
Grafana's Own Metrics
/metrics uses separate basic authentication. Install Prometheus Operator and match the ServiceMonitor release label to its selector. The password must match Grafana's mounted password:
printf '%s' metrics > "$GRAFANA_STATE/metrics-user"
kubectl -n monitoring create secret generic grafana-metrics-auth \
  --from-file=username="$GRAFANA_STATE/metrics-user" \
  --from-file=password="$GRAFANA_STATE/metrics-password"
helm upgrade grafana grafana-community/grafana --version 13.2.2 \
  -n monitoring -f values.yaml -f values-metrics.yaml
Authentication and Access
After confirming external HTTPS, the IdP callback (/login/generic_oauth), actual endpoints/JWKS and group claims, map this INI fragment to chart grafana.ini.auth.generic_oauth. Add the OAuth Secret file mount separately. These placeholder IdP endpoints are not a ready-to-run SSO installation.
[auth.generic_oauth]
enabled = true
name = Organization SSO
client_id = $__file{/run/grafana-oauth/client-id}
client_secret = $__file{/run/grafana-oauth/client-secret}
scopes = openid profile email groups
auth_url = https://sso.example.com/authorize
token_url = https://sso.example.com/token
api_url = https://sso.example.com/userinfo
use_pkce = true
validate_id_token = true
jwk_set_url = https://sso.example.com/actual-jwks-endpoint
role_attribute_strict = true
allow_assign_grafana_admin = false
role_attribute_path = contains(groups[*], 'grafana-admins') && 'Admin' || contains(groups[*], 'grafana-viewers') && 'Viewer'
allow_sign_up = true
Admin is an organization role, distinct from server-level GrafanaAdmin. Strict mapping rejects users outside the mapped groups; PKCE and ID-token signature validation are enabled. Verify real login, group changes and revocation in the target environment. Viewers can query data sources in their organization beyond queries on visible dashboards, so folder permissions alone do not restrict underlying data access.
Grafana Cloud vs Self-hosted Comparison
| Area | Self-hosted OSS | Grafana Cloud |
|---|---|---|
| Operations | Own DB, upgrades, backup and capacity | Managed service; check contract and limits |
| Availability | Design and verify it yourself | SLA depends on the actual plan/service agreement |
| Data source permissions/query cache | Do not assume these are OSS features | Check supported capabilities and plan |
| Data location | Chosen infrastructure/backends | Actual stack Region, retention and processing terms |
| Plugins | Verify compatibility, signatures and packaging | Supported catalog and stack policy |
Obtain Cloud Prometheus/Loki URLs and usernames from the stack's Connections page. Do not assume identical IDs or copy invented regional URLs. Use Cloud Access Policy tokens scoped to required metrics:read/logs:read access and supply secureJsonData.basicAuthPassword through a Secret. Grafana service-account tokens and Cloud data-access tokens serve different purposes.
Best Practices
Organize Overview, Infrastructure, Kubernetes, Applications and Alerts by purpose. Include units and missing-data states. Reduce query range, frequency and cardinality before increasing resources; use recording rules for repeated calculations. Replace retired Angular piechart/worldmap plugins with built-in Pie chart/Geomap panels. Pin compatible additional plugins and supply the same versions to every HA node.
[dashboards] min_refresh_interval = 10s limits browser refresh frequency, not alert evaluation. Size database pools against DB connection limits and replica count. An OSS [caching] enabled/ttl snippet does not provide Enterprise/Cloud query caching.
Validation Scope and References
The single-instance, HA, metrics and sidecar chart profiles were rendered. An actual Grafana 13.2.1 instance checked data sources, dashboards, paused alert provisioning, expression evaluation and metrics authentication. Expressions used synthetic Prometheus responses. These checks did not deploy EKS, validate real backend TLS, fail over a HA database, complete SSO/IRSA or deliver external notifications.
- Grafana HA
- Grafana 13.2.1 configuration defaults
- Community Helm chart
- Alerting file provisioning
- Generic OAuth
- Data source permissions and caching
- Tempo provisioning
- Loki configuration
Quiz
Test the configuration and operational distinctions with the Grafana quiz.