Observability lab series
Difficulty: Advanced Last Updated: September 13, 2026 Connect a runnable synthetic order application and its metrics/logs/traces across two EKS clusters. The baseline uses Prometheus, Loki, Tempo and Grafana with AWS SNS/SQS, Aurora and CloudWatch. Lab configuration is distinct from production HA/capacity validation.
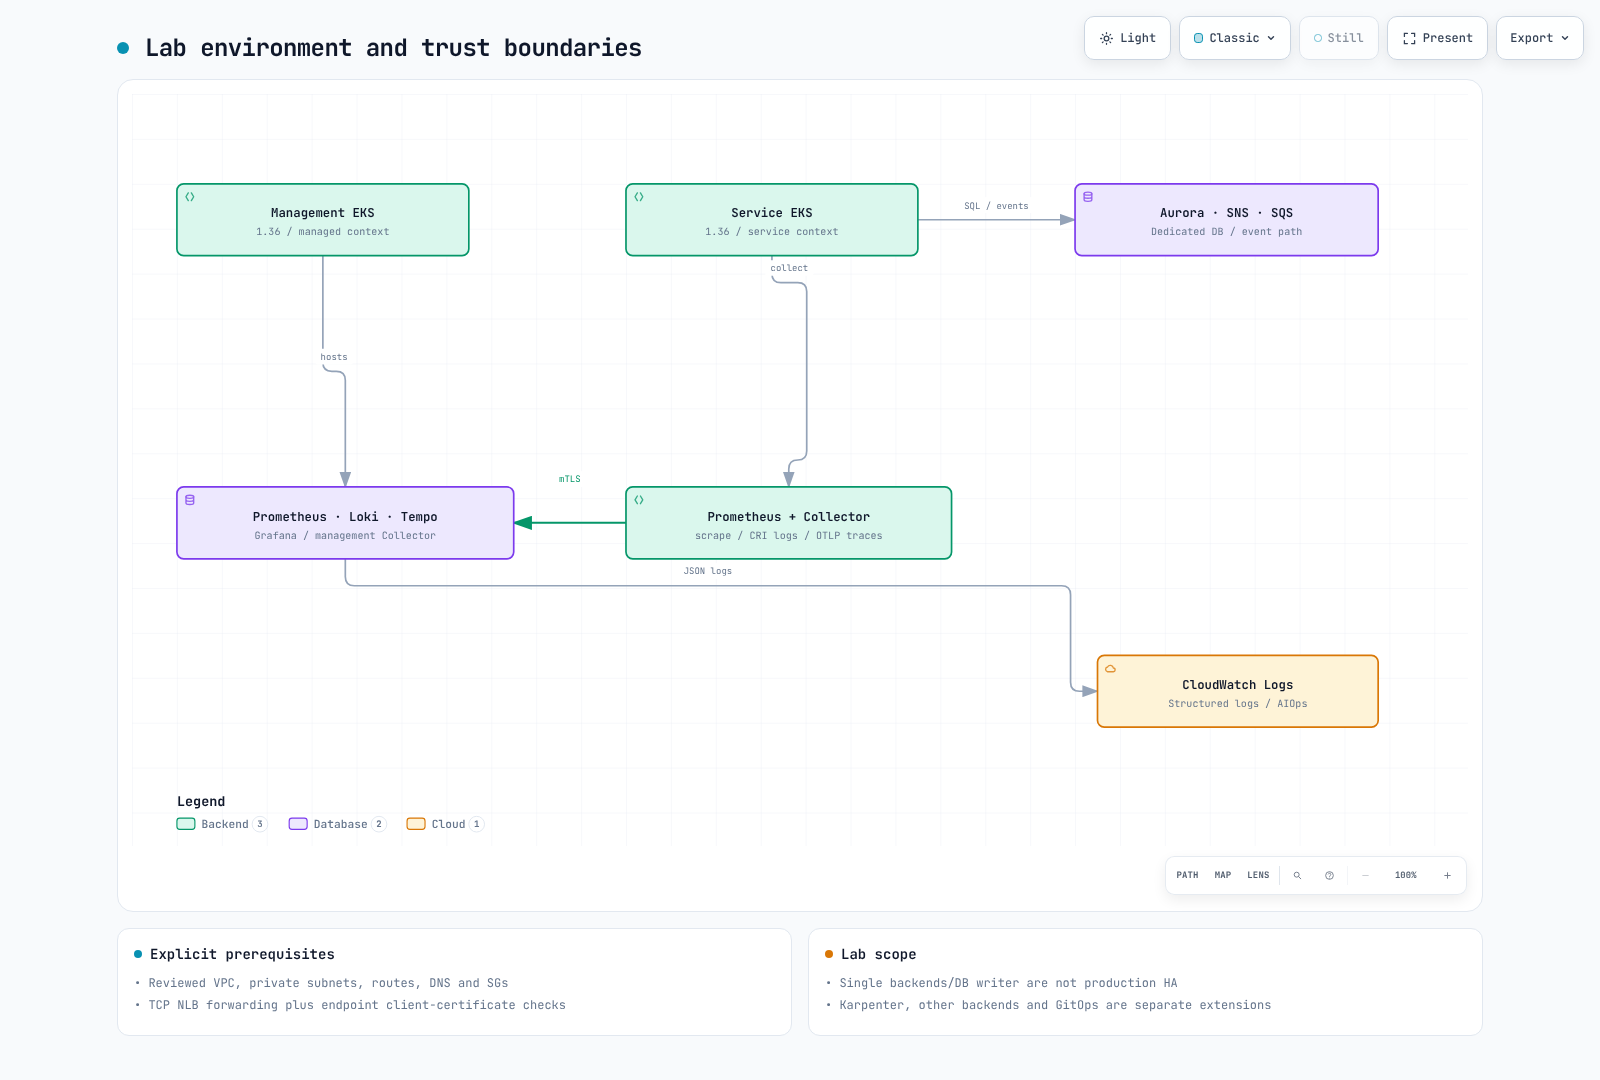
Prerequisites
Use an approved temporary AWS role, reviewed private VPC/subnets/routes/DNS/SGs, EBS CSI/gp3, a NetworkPolicy-capable CNI and AWS Load Balancer Controller. No blanket service FullAccess or long-lived access key is required. Recheck versions, permissions and quotas in each stage.
| Tool | Reviewed baseline |
|---|---|
| EKS / kubectl | 1.36 / 1.36.2 |
| eksctl / Helm | 0.229.0 / 3.21.3 |
| Python / AWS CLI | 3.12 / v2 |
| k6 / Locust | 2.2.0 / 2.46.5 |
| Application / controllers | Pinned requirements, image digest and chart versions in examples |
Runnable code and sequence
Use the application, stack, load-test and aiops examples from this repository. Pin a reviewed commit/tag and preserve private LAB_STATE; do not clone the old nonexistent example repository.
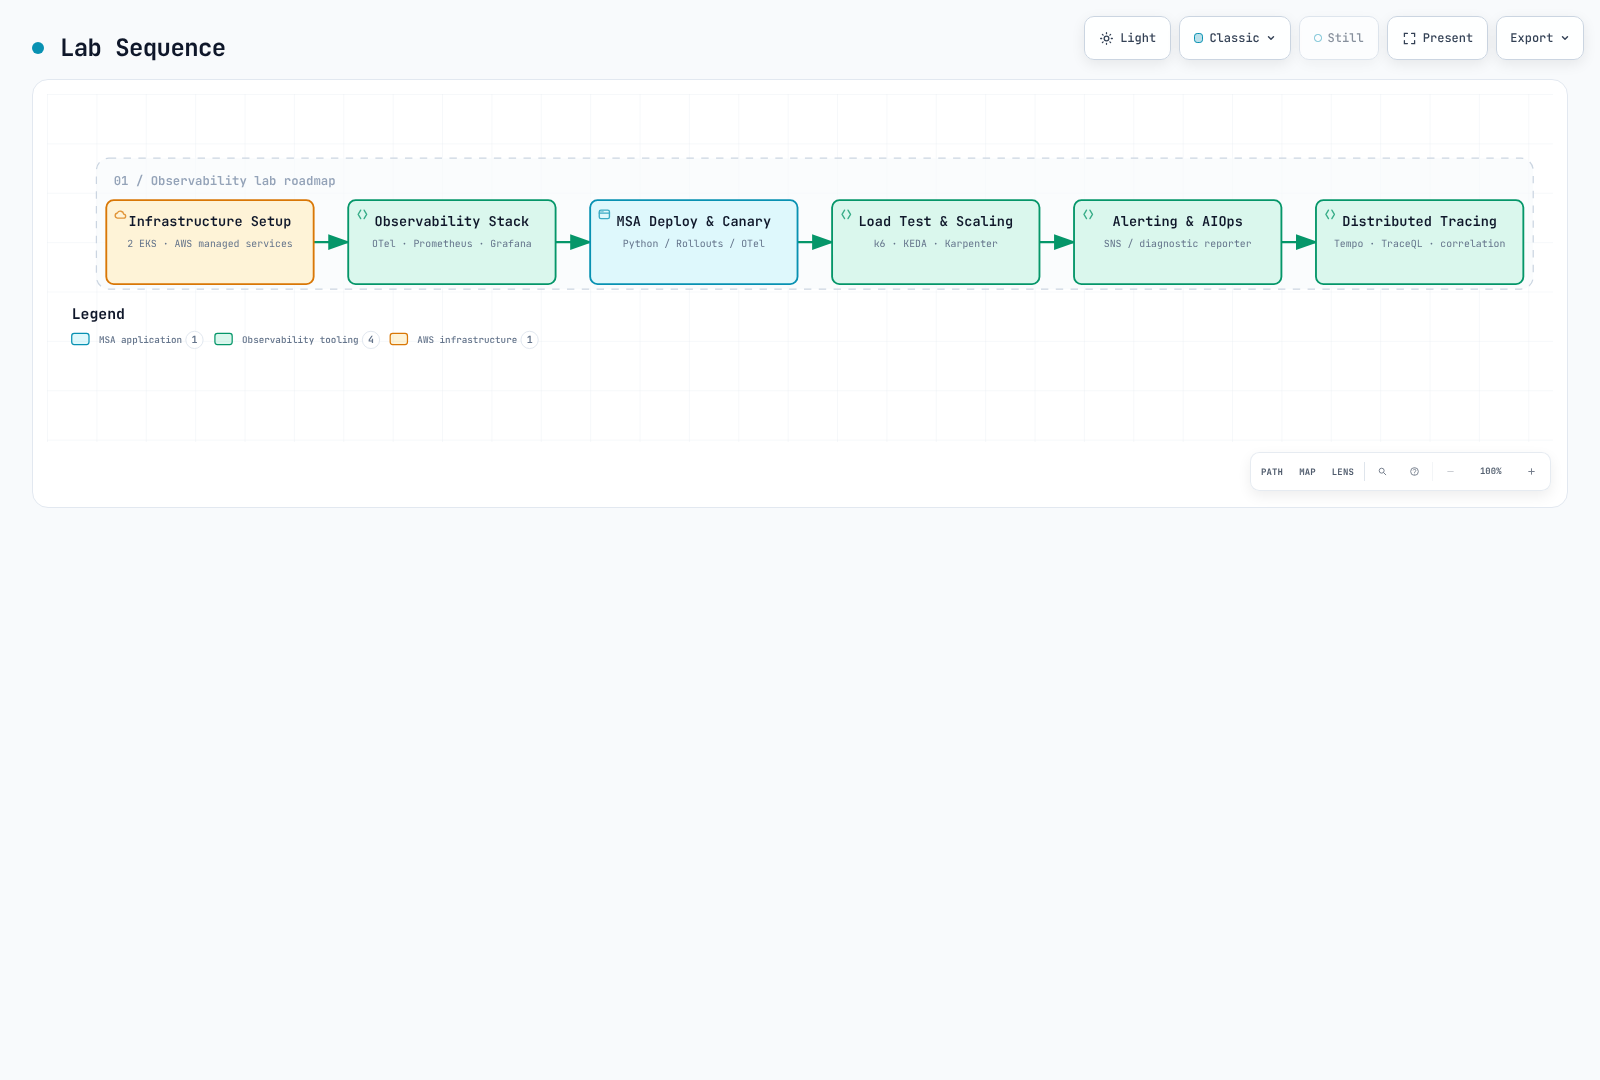
| Part | Stage | Outcome |
|---|---|---|
| 1 | Infrastructure | EKS, private DB, SNS fanout, scoped roles |
| 2 | Observability stack | mTLS collectors/remote-write, Loki/Tempo/Grafana |
| 3 | MSA/canary | Five runnable roles, outbox, revision-only analysis |
| 4 | Load/scaling | Measured requests and consumer/node observations |
| 5 | Alerting/AIOps | Separate-topic diagnostic reporter, human review |
| 6 | Distributed tracing | Actual metric/exemplar/trace/log correlation, cleanup |
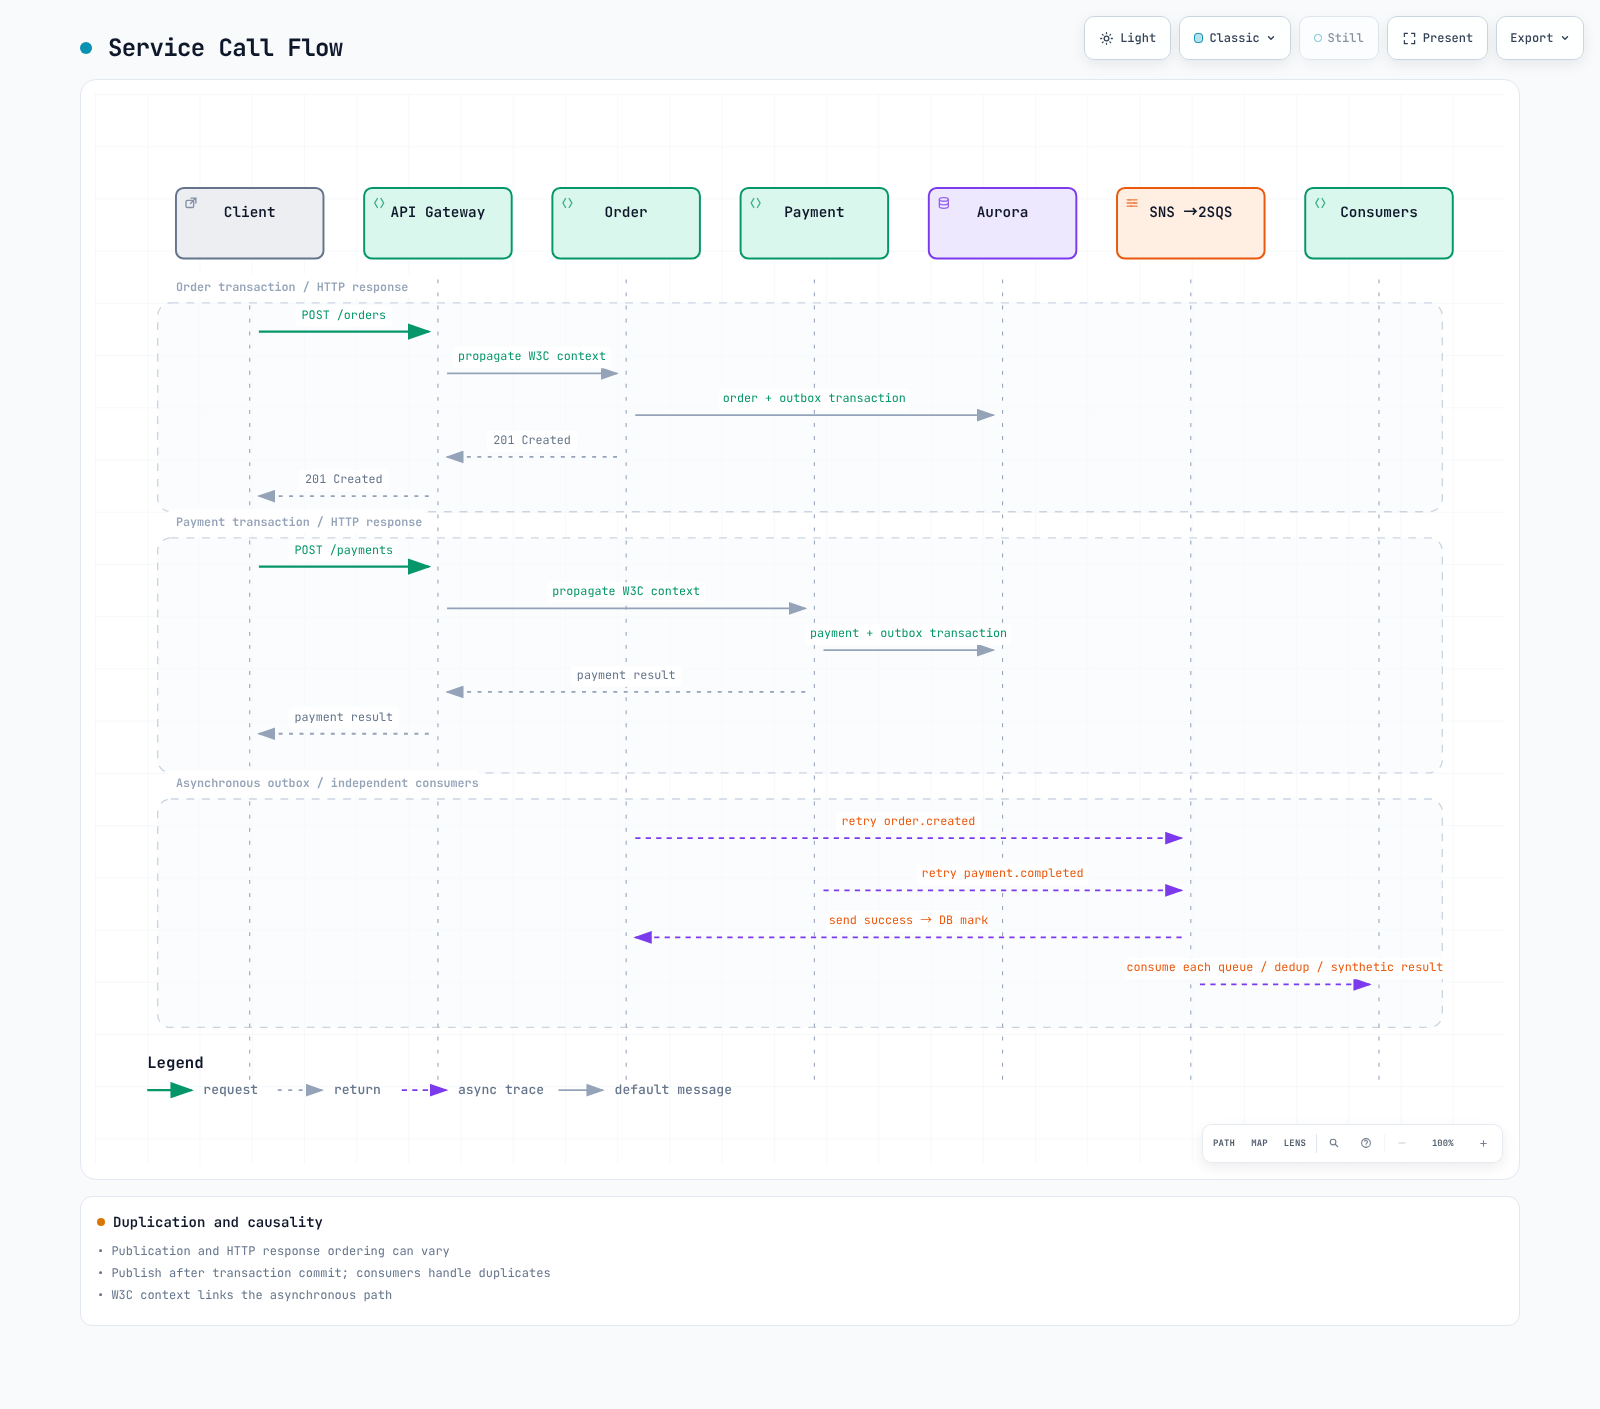
Application and data flow
One Python image runs as separate api-gateway, order-service, payment-service, notification and analytics roles. Payments/notifications are synthetic, with no real charge/email/SMS. Orders and outbox share a transaction; independent queues and event-ID deduplication serve notification/analytics. Gateway authentication, general rate limiting and a real payment gateway are not implemented or claimed.
Baseline versus optional extensions
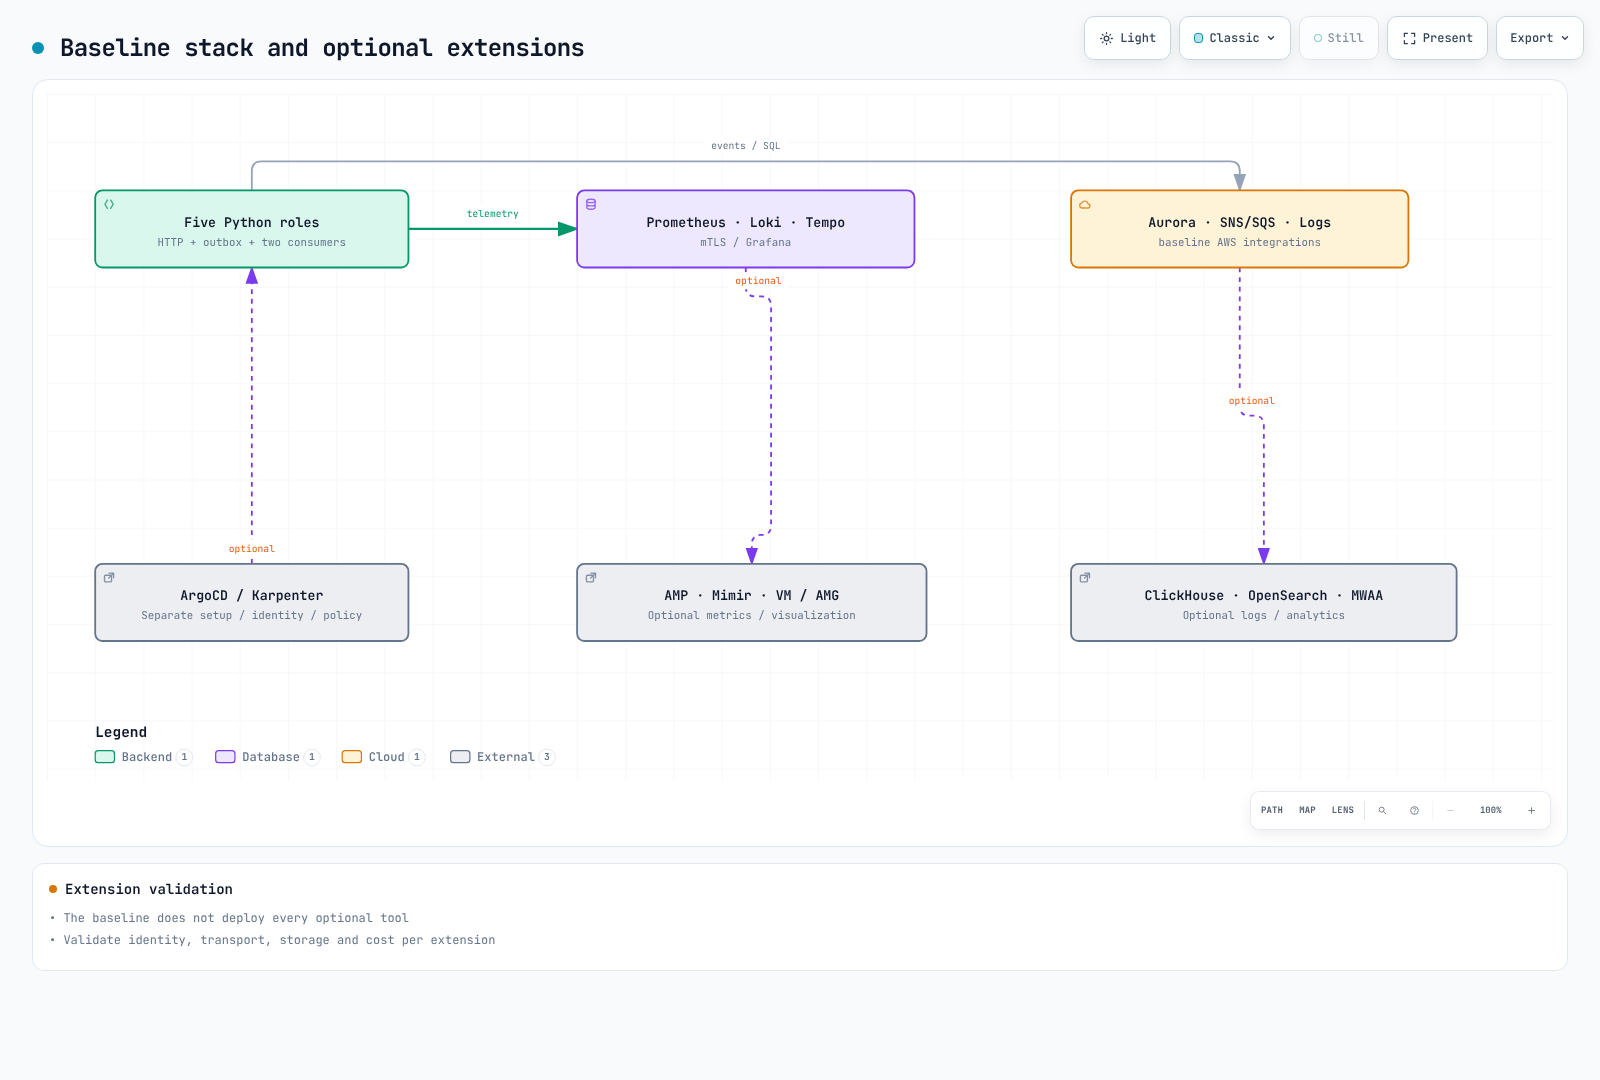
| Baseline | Optional separate integration |
|---|---|
| Prometheus / CloudWatch metrics | VictoriaMetrics, Mimir, AMP |
| Loki / CloudWatch Logs | ClickHouse, OpenSearch |
| OTel / Tempo | X-Ray, Dynatrace |
| Grafana | Amazon Managed Grafana, commercial tools |
| Alertmanager / SNS / diagnostic Lambda | Existing on-call platform, CloudWatch Investigations group |
| Synthetic event consumers | MWAA scheduling/batch analytics, production transaction systems |
Installation differs from verified ingestion, queries, permissions and costs. Consult the metrics, logging, tracing and Grafana guides for extensions. Part5 incorporates changes such as OnCall OSS archival.
Cost, verification and cleanup
Estimate Region-specific nodes, NAT, EBS, Aurora ACU/storage/I/O, log ingestion/retention, messages, KMS, LBs, transfer and model calls from real usage. Do not mix monthly per-user charges with hourly infrastructure in a fixed total. Single-writer/backend labs are not production-grade HA; replica limits are not absolute spending caps.
Distinguish local native/SDK/schema/browser validation from actual AWS results. Inventory resources, IAM attachments, snapshots, DNS and LBs/PVCs; clean up in Part6’s dependency order. Do not suppress every failure or delete clusters before their managed dependents.