Skip to content

Part 4: Load Testing and Autoscaling

Difficulty: Intermediate Estimated Time: 45 minutes Last Updated: February 22, 2026

Learning Objectives

  • Design and execute load test scenarios using k6 and Locust
  • Observe KEDA-driven Pod autoscaling in real-time
  • Monitor Karpenter Node autoscaling during load spikes
  • Build Grafana dashboards for scaling event visualization

Prerequisites

  • [ ] Completed Part 3: MSA Deployment
  • [ ] MSA services running with OTel instrumentation
  • [ ] KEDA and Karpenter configured
  • [ ] k6 installed locally (brew install k6 or apt install k6)

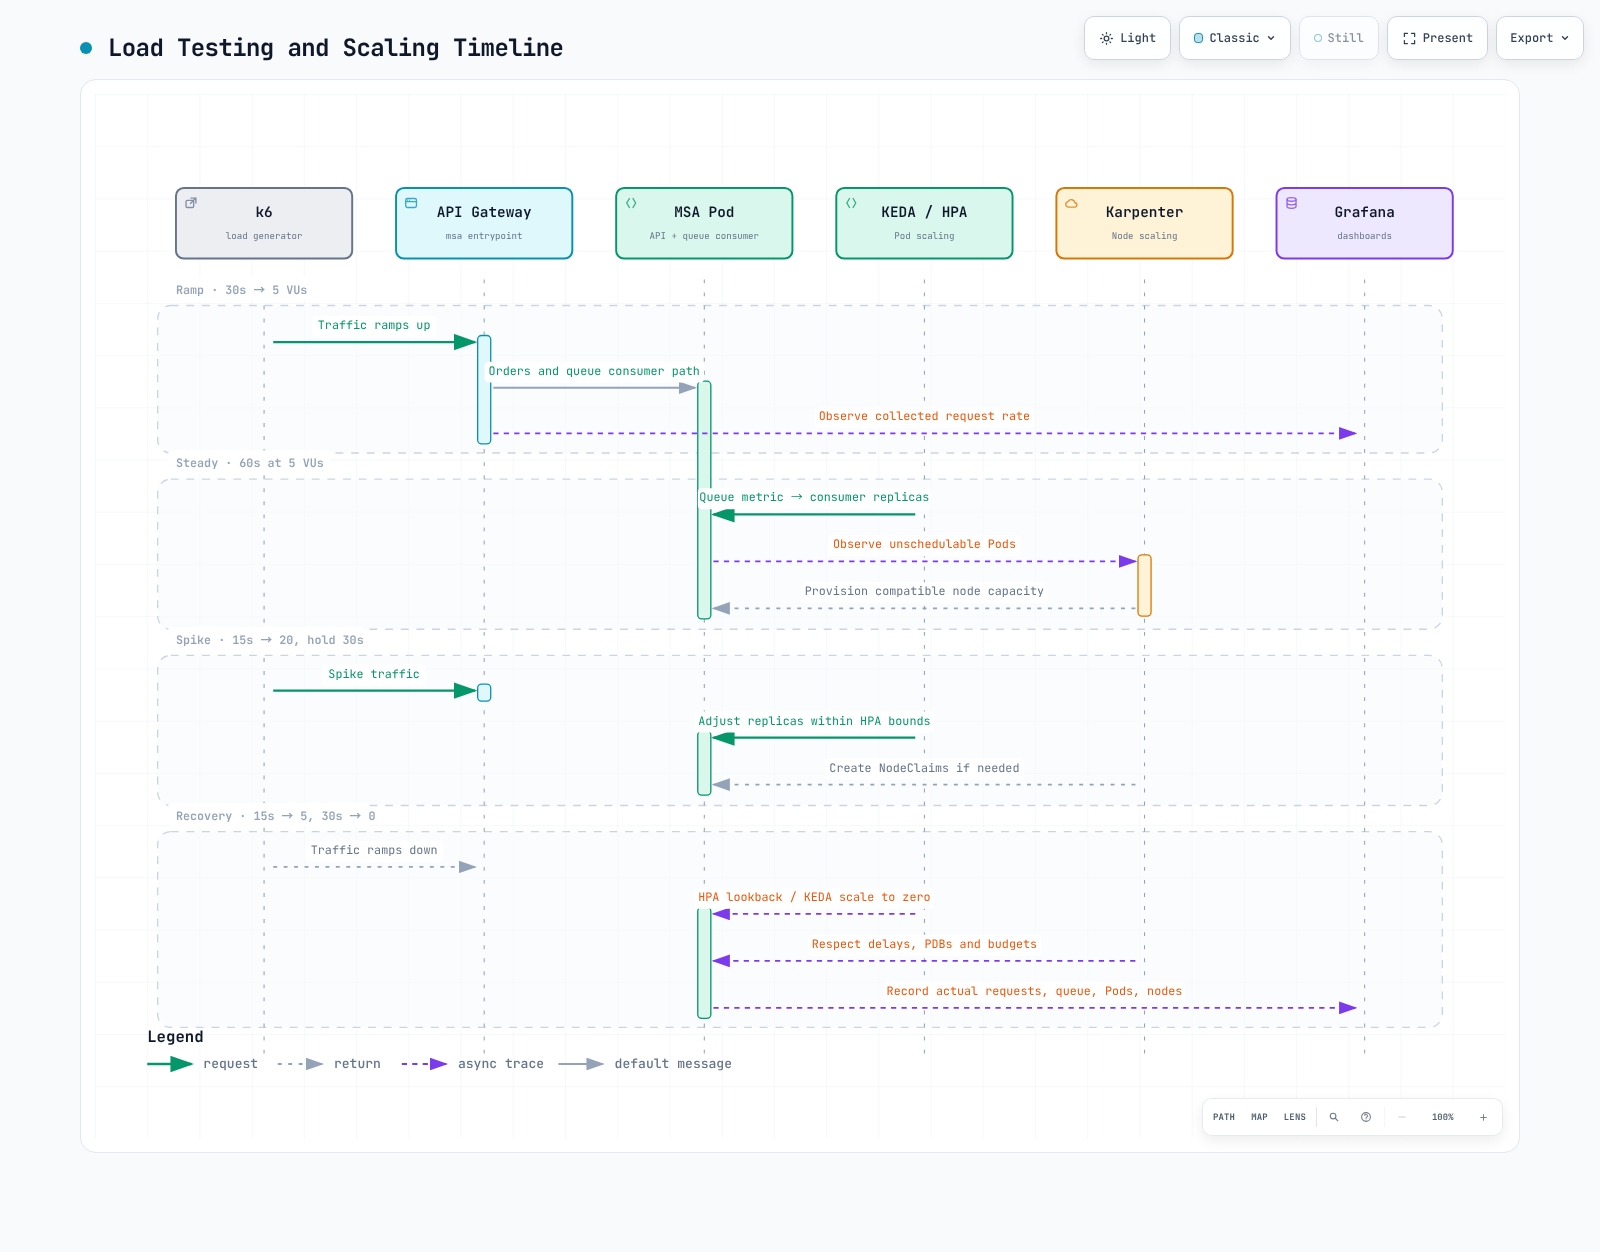
Load Testing and Scaling Timeline

Sequence diagram showing a k6 load test ramping virtual users against an API Gateway across four phases, with KEDA scaling pod counts in response to metrics and Karpenter provisioning or consolidating nodes when pod capacity demands it.


Exercise 1: k6 Load Test Scenario

Steps

Step 1.1: Create k6 load test script

bash
cat > ~/obs-lab/k6-load-test.js << 'EOF'
import http from 'k6/http';
import { check, sleep } from 'k6';
import { Rate, Trend } from 'k6/metrics';

// Custom metrics
const errorRate = new Rate('errors');
const orderLatency = new Trend('order_latency', true);

// Test configuration
export const options = {
  stages: [
    // Phase 1: Ramp-up
    { duration: '2m', target: 50 },   // Warm up
    { duration: '3m', target: 100 },  // Ramp to 100 VUs

    // Phase 2: Sustained load
    { duration: '10m', target: 100 }, // Hold at 100 VUs

    // Phase 3: Spike
    { duration: '2m', target: 300 },  // Spike to 300 VUs
    { duration: '3m', target: 500 },  // Peak at 500 VUs
    { duration: '2m', target: 500 },  // Hold peak

    // Phase 4: Cool-down
    { duration: '3m', target: 100 },  // Ramp down
    { duration: '2m', target: 50 },   // Further down
    { duration: '3m', target: 0 },    // Complete cool-down
  ],
  thresholds: {
    http_req_duration: ['p(95)<500', 'p(99)<1000'],
    errors: ['rate<0.1'],
    order_latency: ['p(95)<800'],
  },
};

const BASE_URL = __ENV.API_URL || 'http://api-gateway.msa.svc.cluster.local:8080';

// Test data
const products = ['PROD-001', 'PROD-002', 'PROD-003', 'PROD-004', 'PROD-005'];
const quantities = [1, 2, 3, 5, 10];

function randomItem(arr) {
  return arr[Math.floor(Math.random() * arr.length)];
}

function generateOrder() {
  return {
    customer_id: `CUST-${Math.floor(Math.random() * 10000)}`,
    product_id: randomItem(products),
    quantity: randomItem(quantities),
    payment_method: Math.random() > 0.5 ? 'credit_card' : 'debit_card',
  };
}

export default function () {
  // Scenario 1: Create Order (60% of traffic)
  if (Math.random() < 0.6) {
    const orderPayload = JSON.stringify(generateOrder());
    const orderStart = Date.now();

    const orderRes = http.post(`${BASE_URL}/api/v1/orders`, orderPayload, {
      headers: {
        'Content-Type': 'application/json',
        'X-Request-ID': `req-${Date.now()}-${Math.random().toString(36).substr(2, 9)}`,
      },
      tags: { name: 'CreateOrder' },
    });

    orderLatency.add(Date.now() - orderStart);

    const orderSuccess = check(orderRes, {
      'order created': (r) => r.status === 201,
      'order has id': (r) => r.json('order_id') !== undefined,
    });
    errorRate.add(!orderSuccess);
  }

  // Scenario 2: Get Order Status (30% of traffic)
  else if (Math.random() < 0.9) {
    const orderId = `ORD-${Math.floor(Math.random() * 100000)}`;
    const statusRes = http.get(`${BASE_URL}/api/v1/orders/${orderId}`, {
      tags: { name: 'GetOrderStatus' },
    });

    const statusSuccess = check(statusRes, {
      'status retrieved': (r) => r.status === 200 || r.status === 404,
    });
    errorRate.add(!statusSuccess);
  }

  // Scenario 3: List Orders (10% of traffic)
  else {
    const listRes = http.get(`${BASE_URL}/api/v1/orders?limit=10`, {
      tags: { name: 'ListOrders' },
    });

    const listSuccess = check(listRes, {
      'list retrieved': (r) => r.status === 200,
    });
    errorRate.add(!listSuccess);
  }

  // Think time
  sleep(Math.random() * 2 + 0.5);
}

export function handleSummary(data) {
  return {
    'stdout': textSummary(data, { indent: ' ', enableColors: true }),
    '/tmp/k6-summary.json': JSON.stringify(data),
  };
}
EOF

Step 1.2: Load test phases explained

PhaseDurationVUsPurpose
Ramp-up5 min10 → 100Gradual warm-up, trigger initial scaling
Sustained10 min100Steady state, observe stable metrics
Spike7 min100 → 500Stress test, trigger aggressive scaling
Cool-down8 min500 → 0Scale-in observation, resource cleanup

Step 1.3: Get API Gateway URL

bash
kubectl config use-context $(kubectl config get-contexts -o name | grep obs-service)

API_URL=$(kubectl -n msa get svc api-gateway \
  -o jsonpath='{.status.loadBalancer.ingress[0].hostname}')

echo "API Gateway URL: http://$API_URL:8080"

Step 1.4: Run k6 load test

bash
# Run load test
k6 run --env API_URL=http://$API_URL:8080 ~/obs-lab/k6-load-test.js

# Or run with output to Prometheus
k6 run --env API_URL=http://$API_URL:8080 \
  --out experimental-prometheus-rw \
  ~/obs-lab/k6-load-test.js

Exercise 2: Locust Alternative (Python-based)

Steps

Step 2.1: Create Locust deployment

bash
cat <<'EOF' | kubectl apply -f -
apiVersion: v1
kind: ConfigMap
metadata:
  name: locust-script
  namespace: msa
data:
  locustfile.py: |
    from locust import HttpUser, task, between
    import random
    import json

    class OrderUser(HttpUser):
        wait_time = between(0.5, 2)

        products = ['PROD-001', 'PROD-002', 'PROD-003', 'PROD-004', 'PROD-005']

        @task(6)
        def create_order(self):
            order = {
                'customer_id': f'CUST-{random.randint(1, 10000)}',
                'product_id': random.choice(self.products),
                'quantity': random.choice([1, 2, 3, 5, 10]),
                'payment_method': random.choice(['credit_card', 'debit_card']),
            }
            with self.client.post(
                '/api/v1/orders',
                json=order,
                headers={'Content-Type': 'application/json'},
                catch_response=True
            ) as response:
                if response.status_code == 201:
                    response.success()
                else:
                    response.failure(f'Status: {response.status_code}')

        @task(3)
        def get_order_status(self):
            order_id = f'ORD-{random.randint(1, 100000)}'
            self.client.get(f'/api/v1/orders/{order_id}')

        @task(1)
        def list_orders(self):
            self.client.get('/api/v1/orders?limit=10')
---
apiVersion: apps/v1
kind: Deployment
metadata:
  name: locust-master
  namespace: msa
spec:
  replicas: 1
  selector:
    matchLabels:
      app: locust
      role: master
  template:
    metadata:
      labels:
        app: locust
        role: master
    spec:
      containers:
        - name: locust
          image: locustio/locust:2.22.0
          ports:
            - containerPort: 8089
            - containerPort: 5557
          command:
            - locust
            - --master
            - --host=http://api-gateway:8080
          volumeMounts:
            - name: locust-script
              mountPath: /home/locust
          resources:
            requests:
              cpu: 100m
              memory: 256Mi
      volumes:
        - name: locust-script
          configMap:
            name: locust-script
---
apiVersion: apps/v1
kind: Deployment
metadata:
  name: locust-worker
  namespace: msa
spec:
  replicas: 4
  selector:
    matchLabels:
      app: locust
      role: worker
  template:
    metadata:
      labels:
        app: locust
        role: worker
    spec:
      containers:
        - name: locust
          image: locustio/locust:2.22.0
          command:
            - locust
            - --worker
            - --master-host=locust-master
          volumeMounts:
            - name: locust-script
              mountPath: /home/locust
          resources:
            requests:
              cpu: 500m
              memory: 512Mi
      volumes:
        - name: locust-script
          configMap:
            name: locust-script
---
apiVersion: v1
kind: Service
metadata:
  name: locust-master
  namespace: msa
spec:
  selector:
    app: locust
    role: master
  ports:
    - name: web
      port: 8089
      targetPort: 8089
    - name: master
      port: 5557
      targetPort: 5557
  type: LoadBalancer
EOF

Step 2.2: Access Locust Web UI

bash
LOCUST_URL=$(kubectl -n msa get svc locust-master \
  -o jsonpath='{.status.loadBalancer.ingress[0].hostname}')

echo "Locust UI: http://$LOCUST_URL:8089"

Exercise 3: Observe Autoscaling During Load

Steps

Step 3.1: Open multiple terminal windows for monitoring

bash
# Terminal 1: Watch Pod scaling
watch -n 2 'kubectl get pods -n msa -l app=order-service -o wide'

# Terminal 2: Watch HPA status
watch -n 5 'kubectl get hpa -n msa'

# Terminal 3: Watch Node scaling (Karpenter)
watch -n 10 'kubectl get nodes -l workload-type=msa'

# Terminal 4: Watch Karpenter logs
kubectl logs -n karpenter -l app.kubernetes.io/name=karpenter -f

Step 3.2: Observation points during load test

MetricWhere to ObserveExpected Behavior
Pod Countkubectl get pods -n msa2 → 8 → 30 → 2
HPA Metricskubectl get hpa -n msaCPU/Request rate increase
Node Countkubectl get nodesNew nodes provisioned
SQS Queue DepthAWS Console / CloudWatchSpike during peak
Prometheus MetricsGrafana ExploreRequest rate, latency
TracesTempo / GrafanaEnd-to-end latency

Step 3.3: KEDA scaling events

bash
# Watch KEDA events
kubectl get events -n msa --field-selector reason=KEDAScaleTargetActivated -w

# Check ScaledObject status
kubectl describe scaledobject -n msa order-service-scaler

Step 3.4: Karpenter provisioning events

bash
# Watch node provisioning
kubectl get events -A --field-selector reason=Provisioned -w

# Check NodePool status
kubectl describe nodepool msa-workloads

Exercise 4: Cool-down and Scale-in Observation

Steps

Step 4.1: Monitor scale-in after load test completes

bash
# Watch Pod termination
kubectl get pods -n msa -l app=order-service -w

# Watch node consolidation
kubectl get events -A --field-selector reason=Consolidated -w

Step 4.2: Scale-in timeline

Time After LoadPod CountNode CountNotes
0 min308+Peak state
2 min208+HPA cooldown starting
5 min106Pods terminating
10 min44Karpenter consolidating
15 min23Near baseline
20 min22Baseline restored

Step 4.3: Verify cost optimization

bash
# Check spot instance usage
kubectl get nodes -o custom-columns=NAME:.metadata.name,TYPE:.metadata.labels.karpenter\\.sh/capacity-type,INSTANCE:.metadata.labels.node\\.kubernetes\\.io/instance-type

# Expected: Mix of spot and on-demand instances

Exercise 5: Grafana Scaling Dashboard

Steps

Step 5.1: Create scaling dashboard panels

PanelMetric QueryVisualization
Pod Countsum(kube_deployment_status_replicas{namespace="msa"}) by (deployment)Time series
Node Countcount(kube_node_info{node=~".*msa.*"})Stat
CPU Usagesum(rate(container_cpu_usage_seconds_total{namespace="msa"}[5m])) by (pod)Time series
Memory Usagesum(container_memory_working_set_bytes{namespace="msa"}) by (pod)Time series
SQS Queue Depthaws_sqs_approximate_number_of_messages_visible_average{queue_name="obs-lab-orders"}Time series
Request Ratesum(rate(http_server_request_count{namespace="msa"}[1m])) by (service)Time series
Error Ratesum(rate(http_server_request_count{namespace="msa",http_status_code=~"5.."}[1m])) / sum(rate(http_server_request_count{namespace="msa"}[1m]))Gauge
P99 Latencyhistogram_quantile(0.99, sum(rate(http_server_request_duration_seconds_bucket{namespace="msa"}[5m])) by (le, service))Time series

Step 5.2: Import dashboard JSON

bash
cat > /tmp/scaling-dashboard.json << 'EOF'
{
  "dashboard": {
    "title": "MSA Scaling Dashboard",
    "tags": ["obs-lab", "scaling", "k6"],
    "timezone": "browser",
    "panels": [
      {
        "title": "Pod Replicas by Deployment",
        "type": "timeseries",
        "gridPos": {"h": 8, "w": 12, "x": 0, "y": 0},
        "targets": [{
          "expr": "sum(kube_deployment_status_replicas{namespace=\"msa\"}) by (deployment)",
          "legendFormat": "{{deployment}}"
        }]
      },
      {
        "title": "Node Count",
        "type": "stat",
        "gridPos": {"h": 4, "w": 6, "x": 12, "y": 0},
        "targets": [{
          "expr": "count(kube_node_info)"
        }]
      },
      {
        "title": "Request Rate",
        "type": "timeseries",
        "gridPos": {"h": 8, "w": 12, "x": 0, "y": 8},
        "targets": [{
          "expr": "sum(rate(http_server_request_count{namespace=\"msa\"}[1m])) by (service)",
          "legendFormat": "{{service}}"
        }]
      },
      {
        "title": "P99 Latency (ms)",
        "type": "timeseries",
        "gridPos": {"h": 8, "w": 12, "x": 12, "y": 8},
        "targets": [{
          "expr": "histogram_quantile(0.99, sum(rate(http_server_request_duration_seconds_bucket{namespace=\"msa\"}[5m])) by (le, service)) * 1000",
          "legendFormat": "{{service}}"
        }]
      }
    ]
  }
}
EOF

# Import via Grafana API
curl -X POST -H "Content-Type: application/json" \
  -u admin:ObsLab2026! \
  -d @/tmp/scaling-dashboard.json \
  "http://$GRAFANA_URL/api/dashboards/db"

Step 5.3: Create annotations for scaling events

bash
# Add Prometheus recording rules for scaling events
cat <<'EOF' | kubectl apply -f -
apiVersion: monitoring.coreos.com/v1
kind: PrometheusRule
metadata:
  name: scaling-events
  namespace: monitoring
spec:
  groups:
    - name: scaling-events
      rules:
        - record: scaling:pod_scale_up
          expr: |
            changes(kube_deployment_status_replicas{namespace="msa"}[5m]) > 0
            and
            delta(kube_deployment_status_replicas{namespace="msa"}[5m]) > 0

        - record: scaling:pod_scale_down
          expr: |
            changes(kube_deployment_status_replicas{namespace="msa"}[5m]) > 0
            and
            delta(kube_deployment_status_replicas{namespace="msa"}[5m]) < 0

        - record: scaling:node_added
          expr: |
            changes(kube_node_created{node=~".*msa.*"}[10m]) > 0
EOF

Verification

bash
# Open Grafana dashboard
echo "Grafana URL: http://$GRAFANA_URL"
echo "Dashboard: MSA Scaling Dashboard"

# Verify metrics are populated
curl -s -u admin:ObsLab2026! \
  "http://$GRAFANA_URL/api/datasources/proxy/1/api/v1/query?query=kube_deployment_status_replicas" | jq

Summary

In this lab, you have:

TaskStatus
k6 Load Test ScriptCreated
Locust DeploymentDeployed
Pod Autoscaling (KEDA)Observed
Node Autoscaling (Karpenter)Observed
Scale-in BehaviorVerified
Scaling DashboardCreated

Key Observations

MetricBaselinePeakRecovery
Order Service Pods2302
Total Nodes38+3
Request Rate0500+ RPS0
P99 Latency<100ms<500ms<100ms
Error Rate0%<1%0%

Cleanup

Cleanup will be performed in Part 6.

Troubleshooting

k6 cannot reach API Gateway
  • Verify LoadBalancer has external IP: kubectl get svc -n msa api-gateway
  • Check security groups allow inbound traffic
  • Test connectivity: curl http://$API_URL:8080/health
Pods not scaling
  • Check HPA status: kubectl describe hpa -n msa
  • Verify KEDA ScaledObject: kubectl describe scaledobject -n msa
  • Check metrics availability: kubectl top pods -n msa
Nodes not provisioning
  • Check Karpenter logs: kubectl logs -n karpenter -l app.kubernetes.io/name=karpenter
  • Verify NodePool limits: kubectl describe nodepool msa-workloads
  • Check EC2 instance limits in AWS account

Next Steps

Continue to Part 5: Alerting and AIOps to configure alerting and AI-powered incident response.

References