Part 3: Deploying MLflow on EKS
Review baseline: MLflow 3.16.0 · community chart 1.11.7; latest patch 3.16.1 checked · 2026-10-12
Lab Environment Setup
Prepare a supported EKS Kubernetes version, compatible kubectl, Helm 3, metadata database, and artifact storage. A lower bound such as kubectl >=1.34 does not establish compatibility with every API server. Check the client/server version-skew policy for the actual cluster.
This chapter is based on a downloaded chart, native Helm rendering, and MLflow 3.16.0 server source. It does not establish successful AWS provisioning, RDS connectivity, S3 uploads, or EKS deployment. See Part 1 for local SQLite/API checks and Part 2 for Registry checks.
Why Run MLflow's Tracking Server on EKS
You can reuse Kubernetes deployment, observability, and IAM patterns while taking responsibility for servers, databases, artifacts, access control, backups, and upgrades. SageMaker MLflow Apps and other managed registries are alternatives; their supported versions, authentication, features, and cost are not necessarily identical.
Sharing with a team does not automatically require provisioning separate new RDS and S3 resources. Small SQLite/PVC exercises are possible; choose production architecture from concurrency, durability, and recovery requirements.
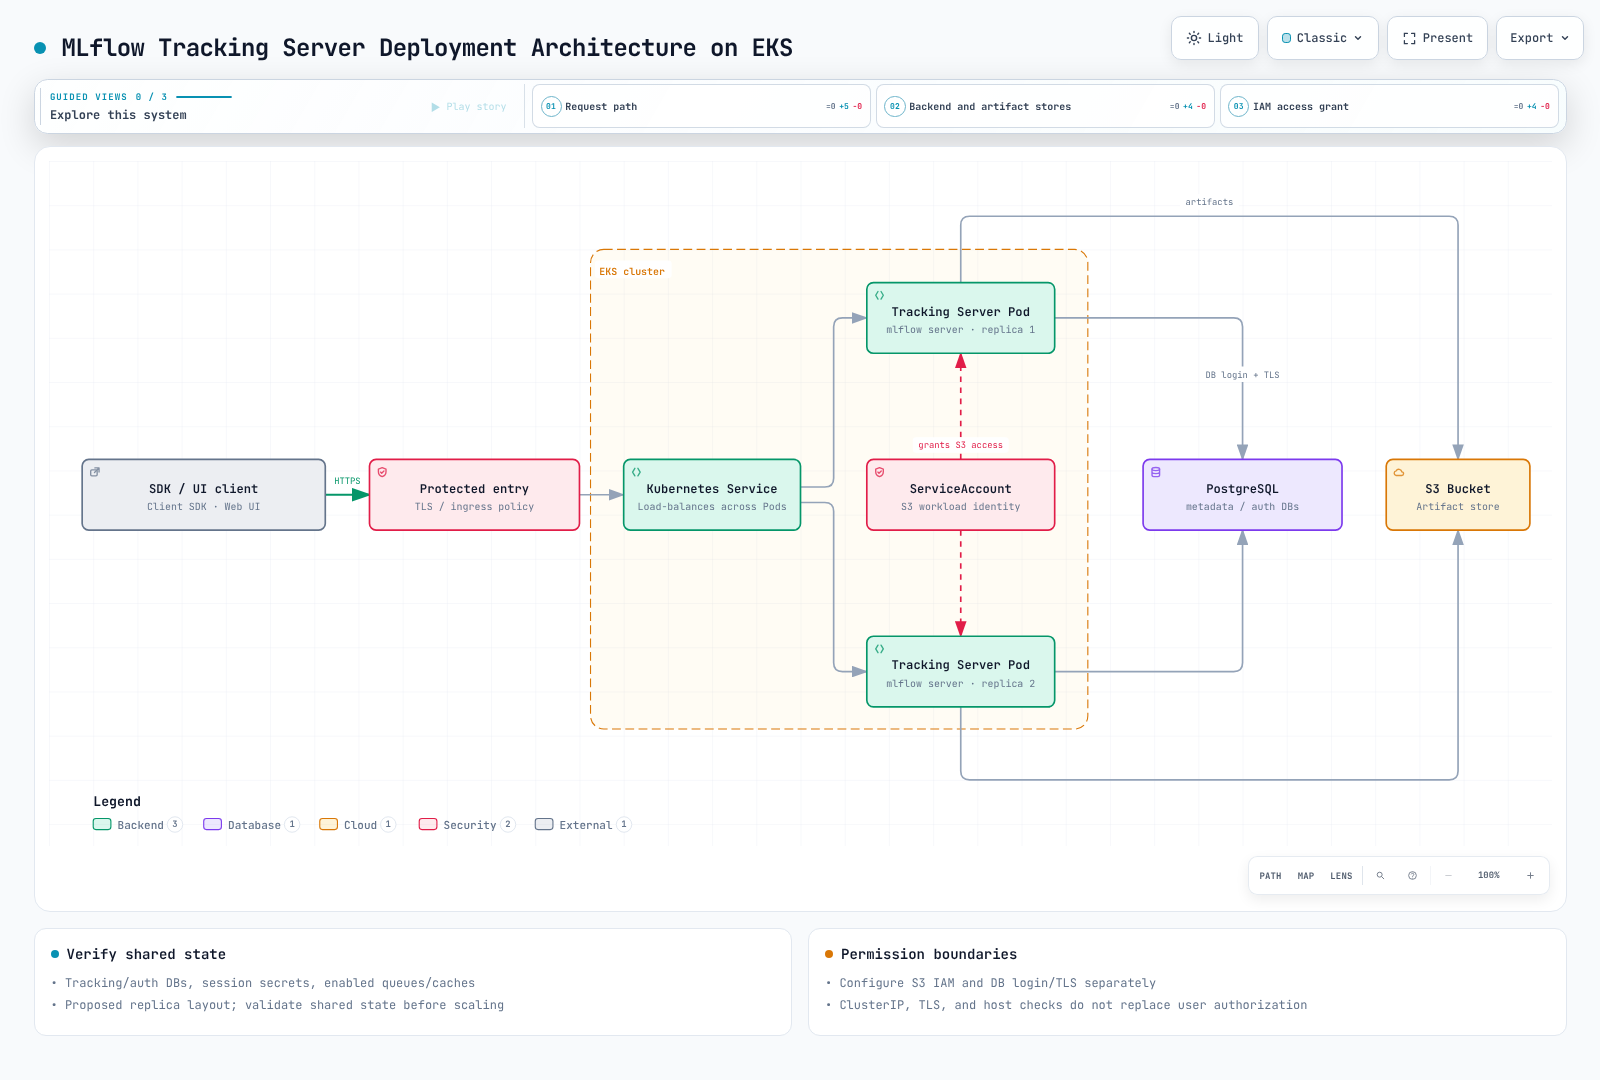
Architecture
| Layer | Responsibility and state to inspect |
|---|---|
| HTTP server | SDK APIs, UI, artifact proxy; authentication, authorization, host/CORS policy, workers |
| Metadata database | experiment/run/metric/model/registry metadata; pools, migrations, backups |
| Artifact store | model/data/plot files; bucket/prefix, IAM, encryption, retention |
| Authentication store | user/permission database, session/signing secrets, cache for the selected auth mechanism |
| Optional feature state | queues, caches, and temporary files used by enabled jobs, tracing/evaluation, or gateway features |
PostgreSQL plus S3 does not make every feature stateless. For example, Pod-local basic-auth SQLite databases can leave replicas with different users or permissions. Check OIDC-plugin caches and job storage separately.
SQLite is a relational database and supports multiple processes with serialized writes. It does not immediately fail when a second user connects. However, separate Pod-local SQLite files are not a shared database; even shared files have writer, filesystem-locking, and recovery constraints. Relate production PostgreSQL selection to those requirements.
Installation Approaches and Version Pins
| Route | What was verified |
|---|---|
| Community chart | downloaded/rendered community-charts/mlflow 1.11.7; appVersion 3.16.0, default image burakince/mlflow |
| MLflow repository chart | v3.16.0/charts contains chart 0.1.1 with appVersion 3.15.2; source tag, chart version, and image version differ |
| Direct manifests | an option when file-based credential delivery, networking, authentication, or migration policies need direct control |
Source in the upstream repository does not prove an identically versioned OCI package is published. The official OCI chart 0.1.1 pull returned not found during review, so it is not presented here as a verified installation command.
These commands inspect chart defaults through discovery, download, and rendering. Prepare production values separately using the checks below.
helm repo add community-charts https://community-charts.github.io/helm-charts
helm repo update community-charts
helm show chart community-charts/mlflow --version 1.11.7
helm pull community-charts/mlflow --version 1.11.7 --untar --untardir ./vendor
helm show values community-charts/mlflow --version 1.11.7 > values.reference.yaml
helm template mlflow ./vendor/mlflow --namespace mlflow -f values.reference.yaml > rendered.yaml
Inspect the rendered image/digest, ServiceAccount, credential delivery, CLI arguments, probes, Service, and Ingress before applying. The chart defaults to a community image rather than the upstream MLflow image; verify its database drivers, AWS SDK, and authentication plugins too.
Important Chart 1.11.7 Defaults
- Defaults include
replicaCount: 1,auth.enabled: false, andingress.enabled: false. backendStore.defaultSqlitePath: ":memory:"configures in-memory metadata. This differs from the upstream CLI's new SQLite-file default. A default chart installation is not a durable production service.- External PostgreSQL uses
backendStore.postgres.*; credential references usebackendStore.existingDatabaseSecret.*. - Check
artifactRoot.s3.*together withartifactRoot.proxiedArtifactStorage: true. Native rendering produced--artifacts-destination=s3://...and--serve-artifacts. - Basic-auth database settings are separate under
auth.postgres.*. Changing the tracking database does not automatically share authentication state. backendStore.databaseMigration: trueadds a Pod init-container path. Plan backups, one coordinated migration phase, and compatibility checks before allowing several replicas to migrate concurrently.
Filling in names without real values and Secrets does not finish production setup. Some database/authentication references in this chart are delivered through container environment variables. SecretKeyRef avoids plaintext values in Git but does not remove process-environment exposure. Where policy prohibits secret values in environments, prepare credential files supplied from Secrets Manager/SSM or an equivalent store and a deployment that consumes those files. Do not put static AWS keys in Helm values or images.
IAM and Database Authentication
Scope S3 permissions to the intended bucket/prefix. Depending on the actual operations, check GetObject, PutObject, listing, multipart, and KMS permissions. Proxy mode uses server AWS permissions; direct artifact mode uses client permissions. Existing experiment URIs are not rewritten merely by changing server flags.
EKS Pod Identity requires the Agent, association, and supported SDK, and targets Linux EC2 workers. It is not universally available to Fargate or Windows Pods. IRSA remains another choice within its supported configurations. Specifying a ServiceAccount name or one annotation does not complete IAM trust, association, and SDK setup.
An IAM role for S3 does not automatically authorize PostgreSQL login. Verify database network access, TLS validation, users/credentials, or separately configured IAM database authentication. Review IMDS and SDK configuration to prevent unintended node-role credential fallback.
Server Access and Health Checks
ClusterIP, private ALBs, and TLS provide networking or transport controls; they do not replace per-user MLflow permissions. Use the organization's protected ingress architecture rather than assuming direct public ALB exposure.
Configure MLflow 3.16.0 allowed_hosts and CORS origins for actual callers. In this community chart, set the corresponding CLI arguments through extraArgs.allowedHosts and extraArgs.corsAllowedOrigins. Host/CORS restrictions do not replace login or authorization.
Basic-auth changed to fail-closed authorization by default in 3.16.0. Version 3.16.1 removed the shipped default administrator password, so do not rely on default credentials. Explicitly configure an approved administrator password and auth settings before startup. This chapter's chart and MLflow 3.16.0 combination was not revalidated on 3.16.1.
The verified health endpoint is /health, implemented as a return of "OK", 200. It checks HTTP process responsiveness, not continuous RDS/S3 connectivity or user authorization. This release exempts health endpoints from host validation. Check actual service paths when using static-prefix, ingress rewrites, or plugins.
Operational Notes
Before scaling replicas, share or externalize metadata/auth databases, session secrets, and enabled queues/caches; test failover. Then apply topology spread, PDBs, readiness, and resource limits. Two Pods alone do not guarantee high availability.
One API call is not always one SQL write. Measure batch logging, transactions, trace payloads, metric history, and per-worker connection pools together. Pools across replicas/workers add up; one pool's configuration does not describe total database connection demand.
Aurora Serverless v2 operates within configured capacity ranges and connection, I/O, and transaction constraints. It does not absorb unlimited bursts or guarantee lower cost. Compare it with provisioned RDS/Aurora against measured load and recovery requirements.
Back up metadata/auth databases and artifacts together and test restoration. Review permanent deletion tools such as mlflow gc against retention policy instead of adding them as routine cleanup. Model alias changes and serving redeployment are also separate operations.