Observability Quiz
Last Updated: October 12, 2026
Versions: Istio 1.31, which supports Kubernetes 1.32–1.37. See the installation and dashboard chapters for EKS and Kiali compatibility limits.
This quiz covers configured sidecar/waypoint telemetry. Each worked example is independent and assumes the stated backends, namespaces, permissions and traffic exist. YAML/API/query checks are not production or live-cluster tests; ztunnel L4, native sidecars and HA deployments need their specific collection configuration.
Multiple Choice Questions (1-5)
Question 1: Prometheus Metrics
Which is not an Istio standard service-metric name/family?
A. istio_requests_total (total request count)
B. istio_request_duration_milliseconds (request latency)
C. istio_request_bytes (request size)
D. istio_pod_cpu_usage (Pod CPU usage)
Show Answer
Answer: D
Istio standard service metrics describe traffic; Envoy also exposes internal proxy statistics. Prometheus obtains container CPU usage from kubelet/cAdvisor (or the runtime resource pipeline). Metrics Server serves resource metrics for autoscaling and kubectl top; kube-state-metrics exposes object state and configured requests/limits, not measured CPU consumption.
Explanation:
Metrics collected by Istio:
- istio_requests_total (A - O)
# Request rate by service (per second)
sum(rate(istio_requests_total{reporter="destination"}[5m])) by (destination_service_name, destination_service_namespace)- istio_request_duration_milliseconds (B - O)
# P95 latency
histogram_quantile(0.95,
  sum(rate(istio_request_duration_milliseconds_bucket{reporter="destination"}[5m])) by (le)
)- istio_request_bytes (C - O)
# Request body byte rate (bytes/second), not mean request size
sum(rate(istio_request_bytes_sum{reporter="destination"}[5m])) by (destination_service_name, destination_service_namespace)- istio_pod_cpu_usage (D - X)
- This is not an Istio metric
- Kubernetes metric:
container_cpu_usage_seconds_total - Scrape kubelet/cAdvisor; kube-state-metrics is useful when comparing usage with configured limits
Istio Metric Categories:
| Category | Example Metric | Description |
|---|---|---|
| Request | istio_requests_total | Request count, response codes |
| Duration | istio_request_duration_milliseconds | Latency distribution |
| Size | istio_request_bytes, istio_response_bytes | Traffic size |
| TCP | istio_tcp_connections_opened_total | TCP connections |
Golden Signals Examples:
# 1. Latency
histogram_quantile(0.95,
  sum(rate(
    istio_request_duration_milliseconds_bucket{reporter="destination",
      destination_service_name="reviews", destination_service_namespace="default"
    }[5m]
  )) by (le)
)

# 2. Traffic
sum(rate(
  istio_requests_total{reporter="destination",
    destination_service_name="reviews", destination_service_namespace="default"
  }[5m]
))

# 3. Errors (error rate)
sum(rate(
  istio_requests_total{reporter="destination",
    destination_service_name="reviews", destination_service_namespace="default",
    response_code=~"5.."
  }[5m]
))
/
sum(rate(
  istio_requests_total{reporter="destination",
    destination_service_name="reviews", destination_service_namespace="default"
  }[5m]
))

# 4. Saturation - Uses Kubernetes metrics
sum(rate(
  container_cpu_usage_seconds_total{
    namespace="default", container="istio-proxy", pod=~"reviews-.*"
  }[5m]
))
Checking Metrics:
# Check metrics via Envoy Admin API
istioctl x envoy-stats <pod-name>.default --output prom

# Check in Prometheus
kubectl port-forward -n istio-system svc/prometheus 9090:9090
# Query at http://localhost:9090
Reference:
Question 2: Distributed Tracing
With a working tracing provider/backend, which application responsibility is required to join proxy spans across service calls?
A. The application must generate trace IDs
B. The application must propagate HTTP headers
C. Jaeger client must be installed on all services
D. Envoy automatically handles everything
Show Answer
Answer: B
Configured proxies can generate spans and trace IDs, but the application must propagate trace context to its outbound calls. An SDK should inject the active context, so child span IDs may change while the trace ID stays the same. Transparent applications without their own spans can forward the selected propagation headers.
Explanation:
How Distributed Tracing Works:
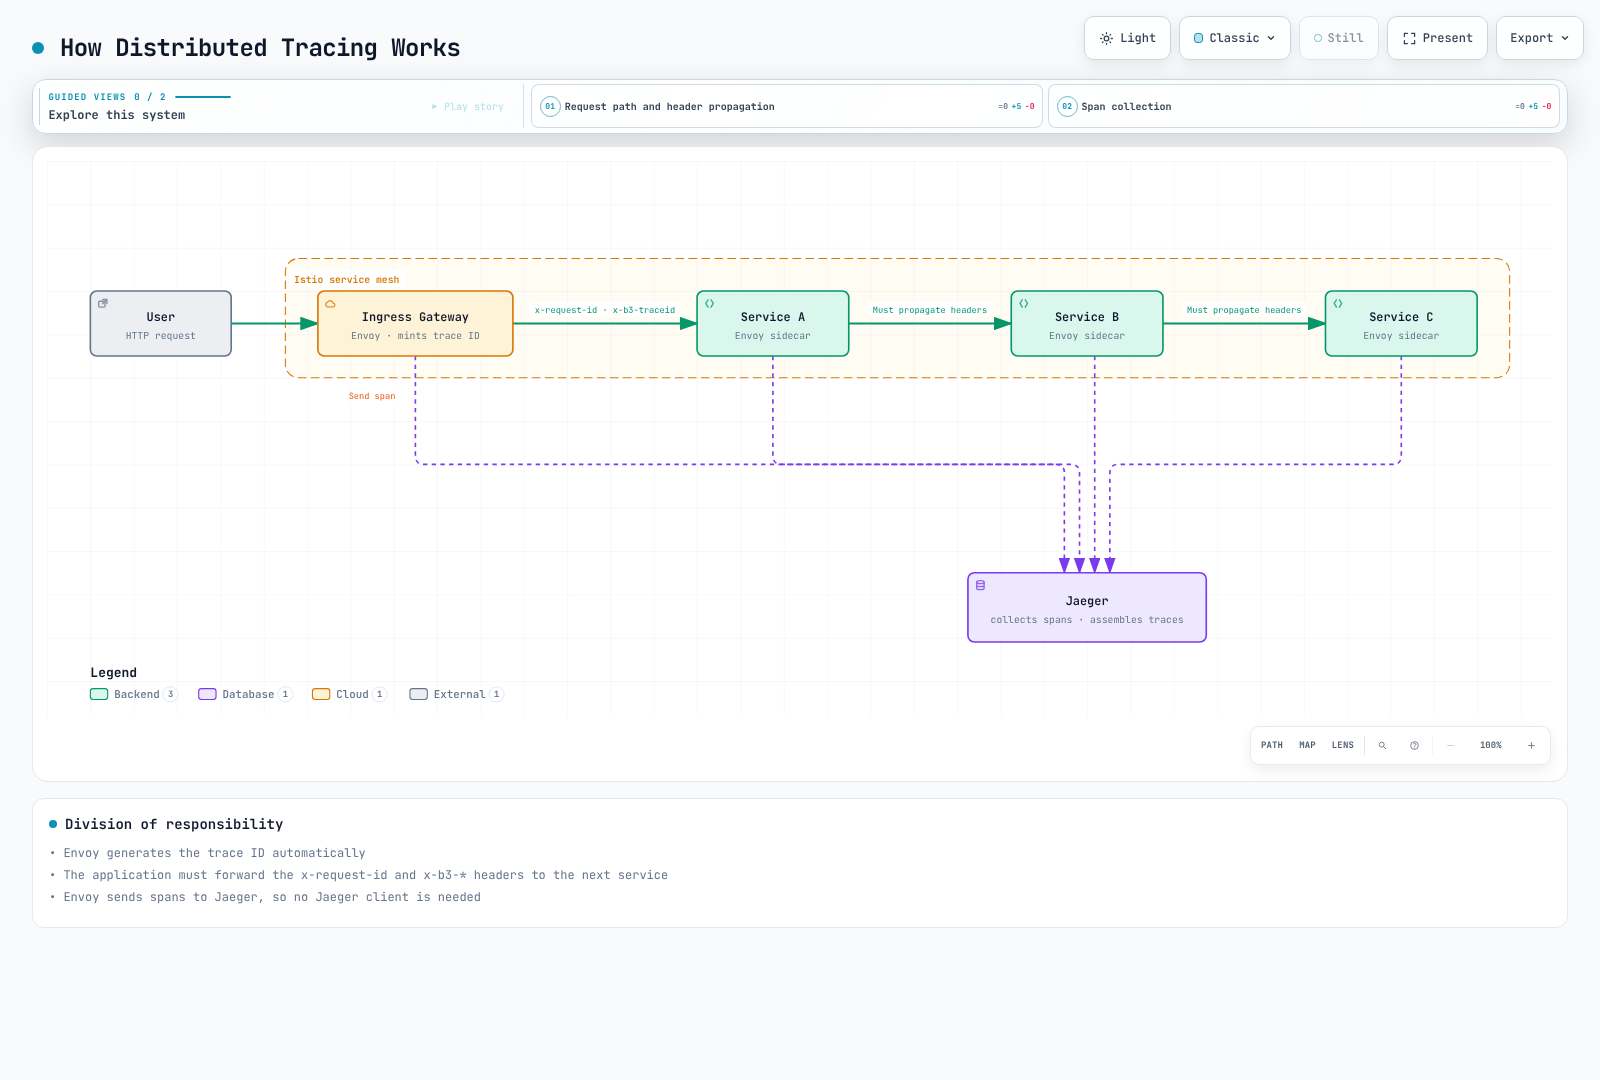
The diagram illustrates B3 propagation to a configured Jaeger backend. W3C propagation and an intermediate OpenTelemetry Collector are also supported; instrumented applications inject their active span context instead of copying every header unchanged.
HTTP Headers to Propagate:
W3C: traceparent, tracestate
B3 (if configured): b3 OR x-b3-traceid, x-b3-spanid, x-b3-parentspanid, x-b3-sampled
Istio correlation: x-request-id
B3 debug flag: x-b3-flags (do not force debug sampling on ordinary traffic)
Application Code Examples:
# Python Flask example
from flask import Flask, request
import requests

app = Flask(__name__)

@app.route('/api/users')
def get_users():
    # 1. Extract received headers
    headers = {}
    for header in ['x-request-id', 'traceparent', 'tracestate', 'b3', 'x-b3-traceid', 'x-b3-spanid',
                   'x-b3-parentspanid', 'x-b3-sampled', 'x-b3-flags']:
        if header in request.headers:
            headers[header] = request.headers[header]

    # 2. Propagate headers when calling next service
    response = requests.get(
        'http://user-service/users',
        headers=headers, timeout=3  # Selected propagation format
    )

    response.raise_for_status()
return response.json()// Node.js Express example
const express = require('express');
const axios = require('axios');
const app = express();
app.get('/api/users', async (req, res) => {
// 1. Extract received headers
const tracingHeaders = {};
['x-request-id', 'traceparent', 'tracestate', 'b3', 'x-b3-traceid', 'x-b3-spanid',
'x-b3-parentspanid', 'x-b3-sampled', 'x-b3-flags'].forEach(header => {
if (req.headers[header]) {
tracingHeaders[header] = req.headers[header];
}
});
// 2. Propagate headers when calling next service
try {
const response = await axios.get('http://user-service/users', {
headers: tracingHeaders, timeout: 3000
});
res.json(response.data);
} catch (error) {
res.status(502).json({error: 'Downstream request failed'});
}
});Analysis of Each Option:
- A (X): Envoy automatically generates trace IDs
- B (O): Application must propagate HTTP headers (required)
- C (X): Jaeger client not needed, Envoy sends Spans
- D (X): Envoy creates/sends Spans, but header propagation is application's responsibility
Sampling Configuration:
This assumes the otel-tracing provider from the tracing chapter. 1.0 means 1%, not 100%; provider/exporter setup and context propagation are separate requirements.
apiVersion: telemetry.istio.io/v1
kind: Telemetry
metadata:
  name: tracing-sample
  namespace: default
spec:
  tracing:
  - providers:
    - name: otel-tracing
    randomSamplingPercentage: 1.0
Accessing Jaeger:
kubectl port-forward -n observability svc/jaeger-query 16686:16686Reference:
Question 3: Kiali Visualization
Which feature is NOT provided by Kiali?
A. Service topology visualization
B. Traffic flow analysis
C. Automatic Canary deployment execution
D. Istio configuration validation
Show Answer
Answer: C
Kiali is an observation and analysis tool, while deployment execution is handled by tools like Argo Rollouts.
Explanation:
Kiali's Main Features:
1. Service Topology Visualization (A - O)
# Open Kiali dashboard
istioctl dashboard kiali

# Features:
# - Real-time service connection display
# - Traffic flow direction display
# - Service status (healthy/error)
# - Response time display
Graph View Example:
Frontend → Backend → Database
   ↓
External API

Color codes:
- Green: Normal
- Red: Error
- Gray: No traffic
2. Traffic Flow Analysis (B - O)
Kiali displays:
- Request count (RPS)
- Error rate (%)
- P50/P95/P99 latency
- TCP connection count
3. Automatic Canary Deployment Execution (C - X)
- Kiali can display traffic and, with permission, edit Istio configuration/use traffic wizards
- It does not replace an automated progressive-delivery controller
- Deployment execution: Argo Rollouts, Flagger
4. Istio Configuration Validation (D - O)
Examples from the Kiali validation catalog:
- VirtualService: undefined subset (
KIA1107). - DestinationRule: overlapping host/subset definitions (
KIA0201). - AuthorizationPolicy: referenced namespace not found (
KIA0101), or principal not associated with a discovered workload ServiceAccount (KIA0106).
Checks depend on Kiali's version, discovery scope and access. Inspect the actual code/message and effective proxy policy; Kiali does not prove that arbitrary policies conflict or that every certificate and runtime route works.
Kiali Installation:
Follow the dashboard chapter for the pinned operator, authentication and current compatibility limits. Kiali is installed separately; sample addons are demos, and a Helm install without backend/RBAC configuration is not a production setup.
Kiali Main Menus:
1. Overview: Service summary by Namespace
2. Graph: Service topology
3. Applications: Application list
4. Workloads: Deployment, StatefulSet, etc.
5. Services: Kubernetes Service
6. Istio Config: VirtualService, DestinationRule, etc.
Kiali vs Other Tools:
| Tool | Role | Automated progressive delivery |
|---|---|---|
| Kiali | Visualization, analysis, validation | No |
| Argo Rollouts | Progressive Delivery | Yes |
| Flagger | Automatic Canary deployment | Yes |
| Grafana | Metrics dashboard | No |
| Jaeger | Distributed tracing | No |
Practical Usage Example:
# 1. Check service topology in Kiali
istioctl dashboard kiali

# 2. Detect anomalies in Graph view
#    - reviews service error rate 5%
#    - productpage → reviews latency increase

# 3. Check details in Workload view
#    - Check reviews-v2 Pod logs
#    - Check Envoy metrics

# 4. Validate configuration in Istio Config view
#    - Found typo in VirtualService
#    - Fix and redeploy
Reference:
Question 4: Access Log Configuration
How do you configure Access Log output in JSON format in Istio?
A. Set meshConfig.accessLogEncoding to JSON in IstioOperator
B. Directly modify Envoy ConfigMap
C. Add annotation to each Pod
D. Convert to JSON via Prometheus query
Show Answer
Answer: A
A is a valid MeshConfig method: use accessLogEncoding: JSON with logging enabled in an istioctl install -f input. This is not an in-cluster operator resource. A custom envoyFileAccessLog.logFormat.labels provider is another supported method, described in the logging chapter.
Explanation:
JSON Format Access Log Configuration:
apiVersion: install.istio.io/v1alpha1
kind: IstioOperator
spec:
  meshConfig:
    # Enable Access Log
    accessLogFile: /dev/stdout

    # Output in JSON format
    accessLogEncoding: JSON

    # Define custom JSON format
    accessLogFormat: |
      {
        "log_type": "access",
        "start_time": "%START_TIME%",
        "method": "%REQ(:METHOD)%",
        "path": "%REQ_WITHOUT_QUERY(X-ENVOY-ORIGINAL-PATH?:PATH)%",
        "protocol": "%PROTOCOL%",
        "response_code": "%RESPONSE_CODE%",
        "response_flags": "%RESPONSE_FLAGS%",
        "bytes_received": "%BYTES_RECEIVED%",
        "bytes_sent": "%BYTES_SENT%",
        "duration": "%DURATION%",
        "upstream_service_time": "%RESP(X-ENVOY-UPSTREAM-SERVICE-TIME)%",
        "x_forwarded_for": "%REQ(X-FORWARDED-FOR)%",
        "user_agent": "%REQ(USER-AGENT)%",
        "request_id": "%REQ(X-REQUEST-ID)%",
        "authority": "%REQ(:AUTHORITY)%",
        "upstream_host": "%UPSTREAM_HOST%",
        "upstream_cluster": "%UPSTREAM_CLUSTER%",
        "upstream_local_address": "%UPSTREAM_LOCAL_ADDRESS%",
        "downstream_local_address": "%DOWNSTREAM_LOCAL_ADDRESS%",
        "downstream_remote_address": "%DOWNSTREAM_REMOTE_ADDRESS%",
        "requested_server_name": "%REQUESTED_SERVER_NAME%",
        "route_name": "%ROUTE_NAME%"
      }
Output Example:
{
  "log_type": "access",
  "start_time": "2025-01-20T10:30:00.123Z",
  "method": "GET",
  "path": "/api/users",
  "protocol": "HTTP/1.1",
  "response_code": 200,
  "response_flags": "-",
  "bytes_received": 0,
  "bytes_sent": 1234,
  "duration": 42,
  "upstream_service_time": "40",
  "x_forwarded_for": "192.168.1.100",
  "user_agent": "Mozilla/5.0",
  "request_id": "abc-123-def",
  "authority": "example.com",
  "upstream_host": "10.0.1.20:8080",
  "upstream_cluster": "outbound|8080||backend.default.svc.cluster.local",
  "upstream_local_address": "10.0.1.10:54321",
  "downstream_local_address": "10.0.1.10:8080",
  "downstream_remote_address": "10.0.1.5:12345",
  "requested_server_name": "-",
  "route_name": "default"
}
Per-Namespace Configuration:
For this alternative, define mesh-json as in the logging chapter first. Telemetry selects the provider/scope; it does not itself change a provider's format.
apiVersion: telemetry.istio.io/v1
kind: Telemetry
metadata:
  name: access-logging
  namespace: production
spec:
  accessLogging:
  - providers:
    - name: mesh-json
    # Select the already-defined JSON provider
Envoy Format Variables:
# Key variables:
%START_TIME%: Request start time
%REQ(HEADER)%: Request header
%RESP(HEADER)%: Response header
%RESPONSE_CODE%: HTTP response code
%DURATION%: Total duration (ms)
%BYTES_RECEIVED%: Bytes received
%BYTES_SENT%: Bytes sent
%UPSTREAM_HOST%: Upstream server address
%DOWNSTREAM_REMOTE_ADDRESS%: Client address
CloudWatch Logs Integration:
This is only an output fragment for an already-deployed Fluent Bit agent with matching input tags, CRI/JSON parsing, IAM credentials and log mounts. A ConfigMap alone does not collect logs. EKS Fargate needs its supported log-router configuration.
apiVersion: v1
kind: ConfigMap
metadata:
  name: fluent-bit-config
  namespace: istio-system
data:
  output.conf: |
    [OUTPUT]
        Name cloudwatch_logs
        Match *
        region us-east-1
        log_group_name /aws/eks/istio/access-logs
        log_stream_prefix istio-
        auto_create_group true
Checking Logs:
# Check Pod's Access Log
kubectl logs <pod-name> -c istio-proxy

# Real-time monitoring
kubectl logs -f <pod-name> -c istio-proxy | jq -R 'fromjson?'

# Filter specific response codes
kubectl logs <pod-name> -c istio-proxy | \
  jq -R 'fromjson? | select((.response_code | tonumber?) == 500)'
TEXT Format vs JSON Format:
| Item | TEXT | JSON |
|---|---|---|
| Readability | High (human) | Low (human) |
| Parsing | Difficult | Easy (machine) |
| Size | Small | Large |
| Structure | Unstructured | Structured |
| Querying | Difficult | Easy (jq, etc.) |
TEXT Format Example:
[2025-01-20T10:30:00.123Z] "GET /api/users HTTP/1.1" 200 - "-" "-" 0 1234 42 40 "192.168.1.100" "Mozilla/5.0" "abc-123-def" "example.com" "10.0.1.20:8080" outbound|8080||backend.default.svc.cluster.local 10.0.1.10:54321 10.0.1.10:8080 10.0.1.5:12345 - defaultReference:
Question 5: Grafana Dashboards
Which dashboard is not part of Istio's published Grafana dashboard set?
A. Istio Service Dashboard
B. Istio Workload Dashboard
C. Istio Performance Dashboard
D. Istio Cost Dashboard
Show Answer
Answer: D
D. Istio publishes traffic/control-plane dashboards, but Grafana itself is a separate addon; installing Istio does not automatically install these dashboards.
Explanation:
The 1.31 catalog includes Service7636, Workload7630, Mesh7639, Performance11829, Control Plane7645, Wasm13277 and Ztunnel21306. Performance focuses on resource/data usage; xDS/webhook panels belong primarily to Control Plane. Mesh includes global traffic and component versions, not every latency panel previously listed here. Select the revision matching the installed Istio release.
Cost cannot be computed by multiplying istio_requests_total by a GB transfer price: requests are not bytes, and source_cluster/destination_cluster identify clusters rather than Availability Zones. Proxy memory is usage, not a bill. Network costing needs billable byte measurements and actual source/destination location/service rules; resource cost allocation needs node prices, time and an explicit allocation model. Reconcile estimates with AWS billing/CUR data and the applicable pricing instead of asserting a fixed formula.
Use the dashboard chapter for verified catalog revisions and complete custom JSON/provisioning examples. ConfigMaps and labels alone do not install a dashboard loader or resolve datasource inputs.
Short Answer Questions (6-10)
Question 6: Golden Signals Monitoring
Explain how to monitor Google SRE's Golden Signals (Latency, Traffic, Errors, Saturation) using Istio and Prometheus. Include Prometheus queries and alerting rules for each signal.
Show Answer
Use one reporter per service-hop calculation and keep service namespace (plus cluster where relevant). Destination metrics measure requests received by the service; source metrics are needed for upstream failures that never arrive. HTTP5xx is only one error definition; gRPC failures require grpc_response_status and application-specific SLI rules. The following latency is milliseconds and rates are per second:
histogram_quantile(0.95, sum by (destination_service_name, destination_service_namespace, le) (rate(istio_request_duration_milliseconds_bucket{reporter="destination"}[5m])))

histogram_quantile(0.99, sum by (destination_service_name, destination_service_namespace, le) (rate(istio_request_duration_milliseconds_bucket{reporter="destination"}[5m])))

sum by (destination_service_name, destination_service_namespace) (rate(istio_requests_total{reporter="destination"}[5m]))

sum by (destination_service_name, destination_service_namespace) (rate(istio_requests_total{reporter="destination",response_code=~"5.."}[5m])) / sum by (destination_service_name, destination_service_namespace) (rate(istio_requests_total{reporter="destination"}[5m]))
For a single-cluster classic sidecar deployment, usage/limit ratios require kubelet/cAdvisor and kube-state-metrics. Exclude absent/zero limits. Native sidecars may report declared limits in init-container resource series instead; confirm the actual metric family before using these expressions:
sum by (namespace, pod, container) (rate(container_cpu_usage_seconds_total{container="istio-proxy"}[5m])) / on (namespace, pod, container) (max by (namespace, pod, container) (kube_pod_container_resource_limits{container="istio-proxy",resource="cpu",unit="core"}) > 0)

max by (namespace, pod, container) (container_memory_working_set_bytes{container="istio-proxy"}) / on (namespace, pod, container) (max by (namespace, pod, container) (kube_pod_container_resource_limits{container="istio-proxy",resource="memory",unit="byte"}) > 0)

envoy_cluster_upstream_cx_active
envoy_cluster_upstream_rq_pending_active
envoy_cluster_circuit_breakers_default_cx_open
The _cx_open metric is a 0/1 state gauge; dividing active connections by it is not utilization. Inspect configured circuit-breaker thresholds when capacity ratios are needed. CPU rate is cores before division; memory working set is bytes before division. A method breakdown requires adding a bounded request_method Telemetry label first.
The following PrometheusRule must be selected by the installed Prometheus Operator. Thresholds and comparison windows are illustrative; traffic seasonality, no-data, scrape failure and a minimum volume condition need environment-specific handling. A previous one-hour window is not a learned normal baseline.
apiVersion: monitoring.coreos.com/v1
kind: PrometheusRule
metadata:
  name: istio-golden-signals
  namespace: monitoring
spec:
  groups:
  - name: golden-signals
    rules:
    - alert: HighLatency
      expr: histogram_quantile(0.95, sum by (destination_service_name, destination_service_namespace,
        le) (rate(istio_request_duration_milliseconds_bucket{reporter="destination"}[5m]))) > 500
      for: 5m
      labels:
        severity: warning
      annotations:
        summary: P95 request duration exceeds500ms
    - alert: TrafficSpike
      expr: sum by (destination_service_name, destination_service_namespace) (rate(istio_requests_total{reporter="destination"}[5m]))
        > 2 * sum by (destination_service_name, destination_service_namespace) (rate(istio_requests_total{reporter="destination"}[1h]
        offset 1h))
      for: 5m
      labels:
        severity: warning
      annotations:
        summary: Traffic exceeds the previous comparison window
    - alert: HighErrorRate
      expr: sum by (destination_service_name, destination_service_namespace) (rate(istio_requests_total{reporter="destination",response_code=~"5.."}[5m]))
        / sum by (destination_service_name, destination_service_namespace) (rate(istio_requests_total{reporter="destination"}[5m]))
        > 0.01
      for: 5m
      labels:
        severity: warning
      annotations:
        summary: HTTP5xx fraction exceeds1%
    - alert: HighEnvoyCPU
      expr: sum by (namespace, pod, container) (rate(container_cpu_usage_seconds_total{container="istio-proxy"}[5m]))
        / on (namespace, pod, container) (max by (namespace, pod, container) (kube_pod_container_resource_limits{container="istio-proxy",resource="cpu",unit="core"})
        > 0) > 0.8
      for: 5m
      labels:
        severity: warning
      annotations:
        summary: Proxy CPU consumption exceeds80% of its configured limit
    - alert: HighEnvoyMemory
      expr: max by (namespace, pod, container) (container_memory_working_set_bytes{container="istio-proxy"})
        / on (namespace, pod, container) (max by (namespace, pod, container) (kube_pod_container_resource_limits{container="istio-proxy",resource="memory",unit="byte"})
        > 0) > 0.8
      for: 5m
      labels:
        severity: warning
      annotations:
        summary: Proxy working set exceeds80% of its configured limit
    - alert: ConnectionBreakerAtCapacity
      expr: envoy_cluster_circuit_breakers_default_cx_open == 1
      for: 5m
      labels:
        severity: warning
      annotations:
        summary: Connection breaker at capacity
Create separate panels for request rate, error fraction, latency and resource units using the checked dashboard template. Do not place CPU cores and memory bytes on an unlabeled shared scale.
Question 7: Finding Performance Bottlenecks with Jaeger
Explain how to use the distributed tracing tool Jaeger to find performance bottlenecks in a microservices architecture. Include Trace analysis methods and practical debugging scenarios.
Show Answer
Start with the Jaeger2/OTLP tracing setup, a configured Telemetry provider and application context propagation. Do not assume an old Jaeger addon/Zipkin port or a sampling value alone deploys tracing. Application/database spans require SDK or agent instrumentation; proxy spans cannot reveal a database query's internals.
- Locate the affected service/time window with a namespace-scoped Prometheus latency query, then find representative slow and normal traces in Jaeger. A Prometheus histogram query returns aggregate statistics, not trace IDs.
- Follow the critical path and distinguish parent duration from exclusive time. A long parent includes its children; it is not automatically the cause.
- Compare errors, retries, connection wait, query execution and parallelism. Trace timing, sampling and missing spans limit conclusions.
histogram_quantile(0.99, sum by (destination_service_name, destination_service_namespace, le) (rate(istio_request_duration_milliseconds_bucket{reporter="destination"}[5m]))) > 2000kubectl port-forward -n observability svc/jaeger-query 16686:16686These are hypothetical debugging scenarios, not benchmark results or literal Jaeger API responses:
| Observation | What to verify | Appropriate response |
|---|---|---|
| 2.1s request, with1.8s instrumented database operation | Separate pool wait, query time, locks and network delay; verify DB execution plan | Fix the measured cause. A ConfigMap named redis.conf does not add application caching |
| ~10s request with connection-pool timeout | Inspect the application's DB client pool, concurrency and DB capacity | Tune the application/DB pool and fix leaks; an Envoy DestinationRule does not configure the application pool, and HTTP pool settings do not tune PostgreSQL |
| Independent2s+2s+1s calls run sequentially | Confirm dependencies, load limits and tracing context | Parallelize only independent I/O with real async clients or bounded threads; expected time can approach the longest call plus overhead, not a guaranteed2s |
For existing synchronous I/O callbacks, this Python3.9+ fragment preserves return ordering and uses worker threads. The application must provide callbacks and enforce their own timeouts; cancelling the awaiting task does not stop an already-running thread:
import asyncio

async def get_user_data(user_id):
    # Application-owned synchronous I/O functions; each must enforce its timeout.
    profile, orders, recommendations = await asyncio.gather(
        asyncio.to_thread(call_backend_a, user_id),
        asyncio.to_thread(call_backend_b, user_id),
        asyncio.to_thread(call_backend_c, user_id),
    )
    return merge(profile, orders, recommendations)
Timeouts bound waiting; they do not repair a slow database, and retries can amplify load. When showing a VirtualService timeout, include the actual route destination and use retries only with idempotency/load considerations. Persistent Jaeger dependency maps may require additional aggregation; a single trace waterfall and a global dependency map are different views. Validate a suspected fix with repeat traffic and metrics/traces, not only one attractive trace.
Question 8: Service Mesh Troubleshooting with Kiali
Explain how to diagnose and resolve common problems (configuration errors, traffic anomalies, security policy conflicts) in the Istio service mesh using Kiali.
Show Answer
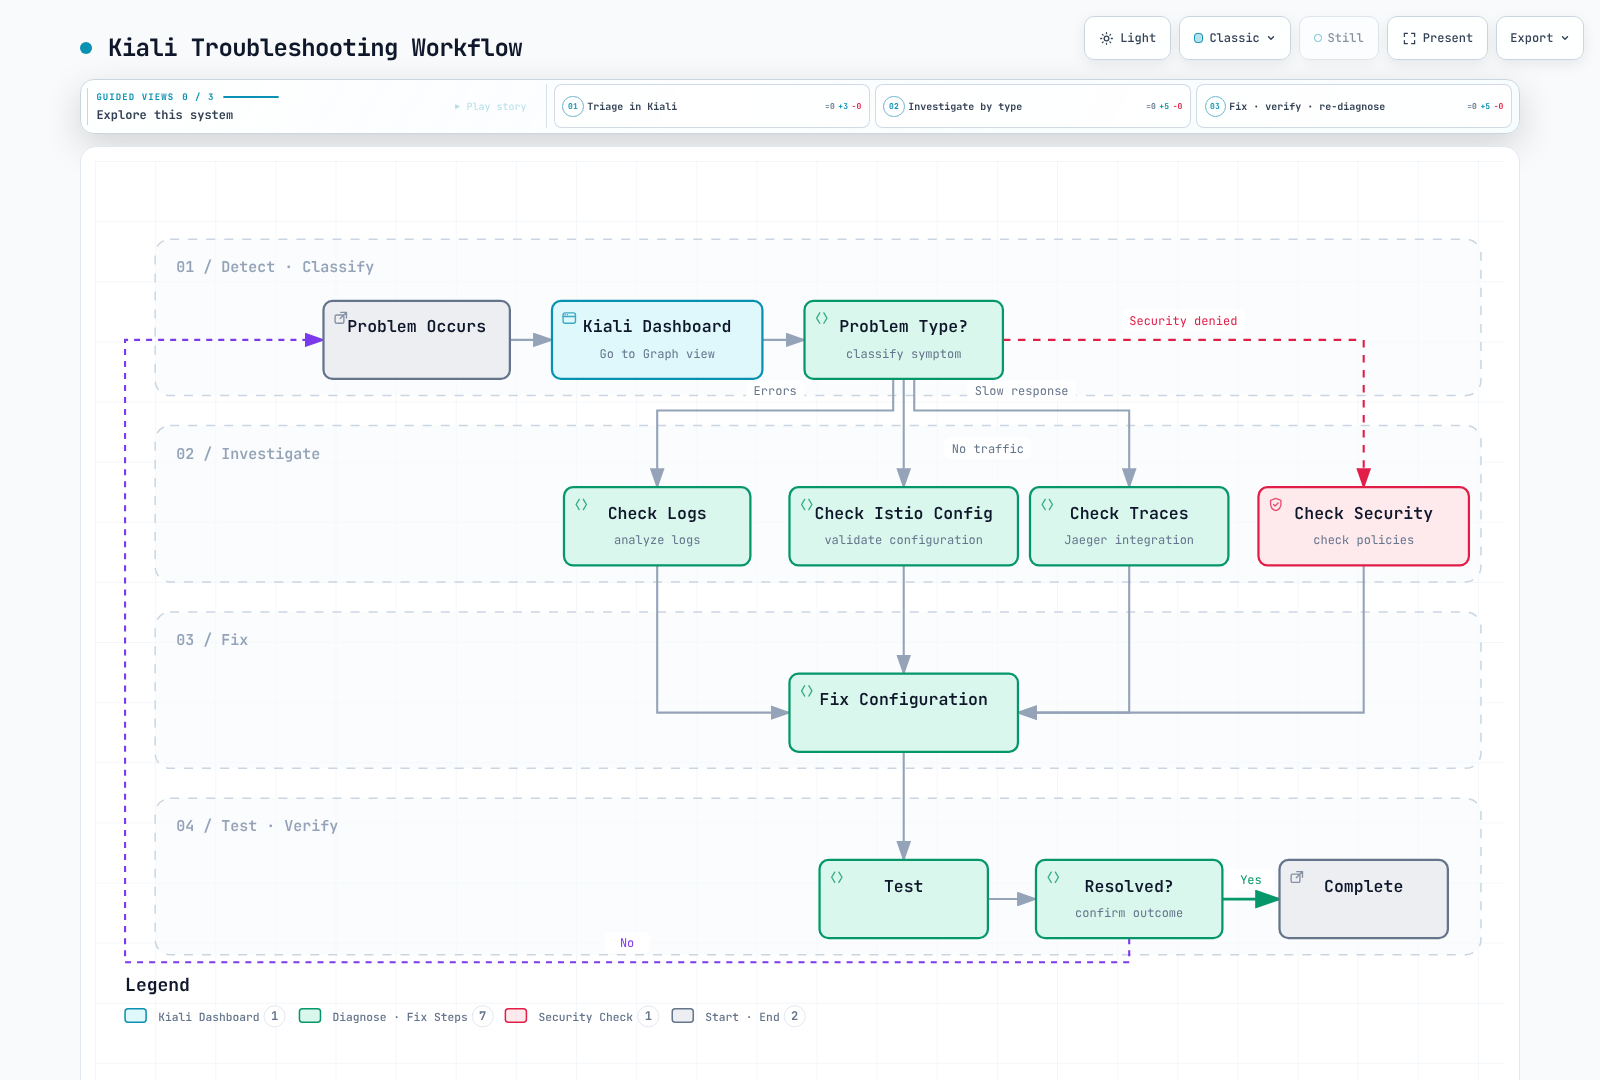
Use Kiali's configuration checks, observed traffic, pod logs and traces as evidence, then verify the effective proxy configuration. The dashboard chapter documents version/authentication prerequisites. Do not invent a Kiali warning from a graph shape or treat a green icon as a runtime guarantee.
| Symptom | Correct interpretation and checks |
|---|---|
| Missing service/subset | In default, reviews and reviews.default.svc.cluster.local resolve to the same host. Shortening the name does not create a missing Service. KIA1107 identifies an undefined subset; check Service/EndpointSlice, DestinationRule and actual pod labels |
| Subset label mismatch | The label value1.0 is not inherently wrong; match the intended Deployment labels with the subset. Include metadata, host and document separators when writing complete DestinationRules |
| Observed90/10 instead of configured50/50 | Check effective weights, matching rules, connection affinity, retries, endpoint/ejection state and the time window. Fewer ready replicas alone do not redefine VirtualService subset weights or guarantee a later50/50 split |
| A↔B cycle | A bidirectional graph is not proof of recursive calls, deadlock or an automatic Kiali alert. Use a trace to identify an actual unintended cycle before redesigning the application |
| HTTP403 | Inspect the enforcing proxy's policy, identity and response details. Empty-spec AuthorizationPolicy is an ALLOW policy with no matching rules; another ALLOW can provide an exception. It is not an overriding DENY |
| mTLS failure | PeerAuthentication describes the receiver. Check sender TLS settings, receiver policy, enrollment, certificate/trust and port protocol for the specific direction. Different receiver modes are not automatically a conflict; blanket STRICT is a migration decision, not a generic fix |
A scoped default-deny baseline with a frontend exception is valid, assuming mTLS supplies the named frontend principal and no earlier CUSTOM/DENY rejects the request:
apiVersion: security.istio.io/v1
kind: AuthorizationPolicy
metadata:
  name: backend-default-deny
  namespace: default
spec:
  selector:
    matchLabels:
      app: backend
---
apiVersion: security.istio.io/v1
kind: AuthorizationPolicy
metadata:
  name: backend-allow-frontend
  namespace: default
spec:
  selector:
    matchLabels:
      app: backend
  action: ALLOW
  rules:
  - from:
    - source:
        principals:
- cluster.local/ns/default/sa/frontendkubectl get service reviews -n default
kubectl get endpointslice -n default -l kubernetes.io/service-name=reviews
kubectl get pods -n default -l app=reviews --show-labels
istioctl analyze -n default
istioctl proxy-config clusters <source-pod> -n default --fqdn reviews.default.svc.cluster.local -o json
istioctl x authz check <backend-pod>.defaultTraffic animation summarizes a selected window; it is not byte-accurate packet inspection. Repeat the diagnosis/configuration/test loop if the hypothesis fails rather than blindly restarting workloads.
Question 9: Production Observability Stack Setup
Explain how to deploy the Istio observability stack (Prometheus, Grafana, Jaeger, Kiali) in High Availability (HA) configuration for a production Kubernetes cluster. Include persistent storage, scaling, and backup strategies.
Show Answer
A production HA stack is an environment-specific design and verification task. The following covers the main requirements; it is not a production-tested deployment bundle. Pin compatible Kubernetes/Istio/operator/chart/backend versions, review the chart values actually used, and validate failure and restore behavior before rollout. The dashboard chapter records the current Kiali compatibility gap; do not infer compatibility from latest releases.
| Component | State and HA requirements |
|---|---|
| Prometheus | Run independent replicas with a PVC per replica, cluster labels shared by that cluster’s replicas and distinct replica labels (other labels must match for deduplication). Distribute failure domains and size retention for observed ingest. A load balancer does not merge their histories |
| Thanos | Sidecars expose StoreAPI and optionally upload blocks; Query discovers real StoreAPI endpoints and deduplicates the configured replica label. Store Gateway reads object storage; Compactor handles block compaction/retention with appropriate single-writer/sharding ownership |
| Grafana | Two replicas require a shared HA PostgreSQL/MySQL database, consistent provisioning/plugins/secret configuration and a load balancer. Two replicas sharing SQLite or one EBS ReadWriteOnce volume across nodes is not Grafana HA |
| Alertmanager | Replicas need peer/notification deduplication configuration, persistent state and secured receiver credentials; placing a Slack webhook in chart values is not a complete secret/notification design |
| Jaeger2/collector | Use stateless query/collector replicas with a supported durable backend and its own HA/TLS/credentials. Tail samplers need trace-ID affinity; multiple replicas behind a random Service do not receive complete traces |
| Kiali | Use a compatible operator/server, shared configuration/session-secret behavior and appropriate pod placement. Protect backend APIs and user namespace permissions. Token strategy is single-cluster; choose documented multi-cluster authentication when needed |
Storage and object-store wiring:
- Keep local Prometheus persistence even with object storage: recent head/WAL data may not yet have been uploaded. For sidecar uploads, follow the installed Thanos version's local-compaction/block-duration requirements.
- S3 bucket, regional endpoint, encryption, retention and IAM permissions must exist. Bind the credential-bearing ServiceAccount to the pods that actually run sidecar/Store/Compactor. A YAML comment saying “IRSA” does not create credentials. Current Thanos S3 configuration can use
aws_sdk_auth: truewith the supported AWS SDK credential chain. - In current kube-prometheus-stack values, an existing object-store Secret is selected under
prometheus.prometheusSpec.thanos.objectStorageConfig.existingSecretwith the real name/key. Mounting keythanos.yamldoes not create a file calledobjstore.yaml. Verify file paths, named gRPC Service ports and DNS-SRV targets. - Current Thanos Query uses
--endpointand--query.replica-labelfor its endpoint/deduplication configuration. Do not carry over an old--storeexample without checking the chosen release. Kiali querying a Prometheus-compatible backend may also need its documentedthanos_proxysettings. - Each Deployment/StatefulSet needs matching selectors/pod labels and Services; the original incomplete resources could not form a working StoreAPI topology. On EKS, EBS-backed state needs supported EC2 placement/CSI configuration; Fargate does not mount EBS or run arbitrary DaemonSets.
Configuration, backup and proof:
- Configure actual monitor/rule selectors and scrape targets. In kube-prometheus-stack,
alertmanager.configis a sibling ofalertmanager.alertmanagerSpec; verify the pinned chart schema. Keep passwords/webhooks in supported Secret references. - Back up Grafana's database/configuration/provisioned dashboards/plugins, Prometheus state as required, and Jaeger's storage using application-consistent procedures. Object-store retention alone is not a restore strategy for all components.
- Velero PVC/PV manifests alone do not prove volume data was captured. Configure the supported CSI snapshot/data-mover or filesystem backup path, snapshot classes/plugins, credentials and the resources needed to restore workloads. Inspect backup status and perform isolated restores.
- A backup Job must have a tested image containing its required tools, correct source URL, scoped identity, destination bucket and failure handling. The old AWS CLI image/assumed curl+jq/S3 CronJob was not a verified backup solution.
- Monitor receiver/exporter failures, queueing, scrape health and actual PVC capacity metrics.
prometheus_tsdb_storage_blocks_bytes_totalis not a valid capacity denominator. A stack cannot reliably report its own total outage; use an independent heartbeat/observer and handle missing-series/no-data separately fromup == 0. - Test loss of a replica/node/zone, storage interruption, backend/authentication failure, rollout and restoration. PDBs help planned disruption; they do not create database or zone-level HA. Record RPO/RTO and observed capacity rather than claiming them from replica counts.
See Grafana HA, Thanos Sidecar, Thanos Query, Thanos storage, and Velero CSI backup.
Question 10: Custom Metrics and Dashboard Creation
Explain how to collect business metrics (e.g., order count, payment success rate) beyond the default metrics collected by Istio Envoy, and create a Grafana custom dashboard.
Show Answer
Define the business event and counting boundary before choosing metrics. Envoy knows requests, not whether an order was durably created or a payment settled. The following integration fragments count completed processing attempts, not unique orders or accounting revenue. The application must supply its processing functions/error contract, idempotency and validation. For a true payment-success metric, instrument payment outcomes at the payment boundary and derive a ratio from outcome counters; an unmaintained Gauge is not a success rate.
Use bounded category/status labels, a Counter for attempts and Histograms for nonnegative amounts/duration. Observe duration in finally so failures are included. Do not label metrics with order IDs, user IDs or raw URLs. These examples are single-process; multi-worker aggregation needs the client library's supported setup.
Python/Flask (application supplies process_order and PaymentException):
from flask import Flask, request, jsonify, Response
from prometheus_client import Counter, Histogram, generate_latest, CONTENT_TYPE_LATEST
import time

# Integration fragment: your application supplies process_order and PaymentException.
# process_order returns a validated nonnegative USD amount and category after processing.
app = Flask(__name__)
CATEGORIES = {"books", "electronics", "other"}
STATUSES = ("success", "payment_failed", "error")
orders_total = Counter("orders_total", "Completed order-processing attempts", ["status", "product_category"])
order_amount = Histogram("order_amount_dollars", "Observed amounts of successful attempts in USD",
                         buckets=[10, 50, 100, 500, 1000, 5000])
order_duration = Histogram("order_processing_duration_seconds", "Order attempt duration, including failures",
                           buckets=[0.1, 0.5, 1.0, 2.0, 5.0])
for status in STATUSES:
    for category in CATEGORIES:
        orders_total.labels(status=status, product_category=category).inc(0)

@app.post("/api/orders")
def create_order():
    payload = request.get_json()
    started = time.perf_counter()
    try:
        order = process_order(payload)
        category = order["category"] if order["category"] in CATEGORIES else "other"
        orders_total.labels(status="success", product_category=category).inc()
        order_amount.observe(order["amount"])
        return jsonify(order), 201
    except PaymentException:
        orders_total.labels(status="payment_failed", product_category="other").inc()
        return jsonify({"error": "Payment failed"}), 400
    except Exception:
        orders_total.labels(status="error", product_category="other").inc()
        return jsonify({"error": "Order processing failed"}), 500
    finally:
        order_duration.observe(time.perf_counter() - started)

@app.get("/metrics")
def metrics():
    return Response(generate_latest(), content_type=CONTENT_TYPE_LATEST)

# Use the application's server lifecycle. Do not treat a Flask development server
# or process-local counters as a production accounting system.Node.js/Express: the maintained package is @prometheus-io/client (example API checked with 0.16.1 on Node 22). prom-client is deprecated in favor of this package; existing projects must review the migration changelog. Configure JSON middleware and await register.metrics():
const express = require('express');
const client = require('@prometheus-io/client'); // Example verified with 0.16.1, Node 22
const app = express();
app.use(express.json());
const register = new client.Registry();
const categories = new Set(['books', 'electronics', 'other']);
const ordersTotal = new client.Counter({
  name: 'orders_total', help: 'Completed order-processing attempts',
  labelNames: ['status', 'product_category'], registers: [register]
});
const orderAmount = new client.Histogram({
  name: 'order_amount_dollars', help: 'Observed successful attempt amounts in USD',
  buckets: [10, 50, 100, 500, 1000, 5000], registers: [register]
});
const orderDuration = new client.Histogram({
  name: 'order_processing_duration_seconds', help: 'Order attempt duration, including failures',
  buckets: [0.1, 0.5, 1, 2, 5], registers: [register]
});
for (const status of ['success', 'payment_failed', 'error']) {
  for (const product_category of categories) ordersTotal.inc({status, product_category}, 0);
}
// The application supplies async processOrder with validated amount/category output.
app.post('/api/orders', async (req, res) => {
  const end = orderDuration.startTimer();
  try {
    const order = await processOrder(req.body);
    const product_category = categories.has(order.category) ? order.category : 'other';
    ordersTotal.inc({status: 'success', product_category});
    orderAmount.observe(order.amount);
    res.status(201).json(order);
  } catch (error) {
    const status = error.code === 'PAYMENT_FAILED' ? 'payment_failed' : 'error';
    ordersTotal.inc({status, product_category: 'other'});
    res.status(status === 'payment_failed' ? 400 : 500).json({error: 'Order processing failed'});
  } finally {
    end();
  }
});
app.get('/metrics', async (req, res) => {
  try {
    res.set('Content-Type', register.contentType);
    res.end(await register.metrics());
  } catch (error) {
    res.status(500).end();
  }
});
// Integrate app.listen/shutdown with the application's server lifecycle.
Kubernetes collection: this sidecar lab uses Istio's merged endpoint so it does not assume a plaintext application scrape will pass STRICT mTLS. Merge these labels/annotations into the actual order-service Deployment in default; its image must contain the application and expose /metrics on8080. The mesh must have Prometheus merging enabled. The agent endpoint15020 is cleartext, so restrict network access. If an existing scraper already collects these business metrics, do not add a duplicate monitor.
spec:
  template:
    metadata:
      labels:
        app: order-service
      annotations:
        prometheus.io/scrape: 'true'
        prometheus.io/path: /metrics
        prometheus.io/port: '8080'
prometheus.istio.io/merge-metrics: 'true'apiVersion: v1
kind: Service
metadata:
name: order-service
namespace: default
labels:
app: order-service
spec:
selector:
app: order-service
ports:
- name: http
port: 8080
targetPort: 8080
- name: merged-metrics
port: 15020
targetPort: 15020
---
apiVersion: monitoring.coreos.com/v1
kind: ServiceMonitor
metadata:
name: order-service-metrics
namespace: istio-system
spec:
namespaceSelector:
matchNames:
- default
selector:
matchLabels:
app: order-service
targetLabels:
- app
endpoints:
- port: merged-metrics
path: /stats/prometheus
interval: 30s
metricRelabelings:
- sourceLabels:
- __name__
regex: orders_total|order_amount_dollars_(bucket|sum|count)|order_processing_duration_seconds_(bucket|sum|count)
action: keepThe Prometheus resource must select the ServiceMonitor in istio-system; it discovers the Service in default. Keeping only the business metric families avoids duplicating proxy metrics already scraped elsewhere. targetLabels explicitly adds the Service's app label. This is a sidecar example; ambient/direct TLS scraping needs its own supported design.
Queries (in order: interval attempt count, attempts/second, success fraction, observed amount P95, duration P99, category rate, payment-failure fraction among order attempts):
sum(increase(orders_total{namespace="default",app="order-service"}[5m]))

sum(rate(orders_total{namespace="default",app="order-service"}[5m]))

sum(rate(orders_total{namespace="default",app="order-service",status="success"}[5m])) / sum(rate(orders_total{namespace="default",app="order-service"}[5m]))

histogram_quantile(0.95, sum by (le) (rate(order_amount_dollars_bucket{namespace="default",app="order-service"}[5m])))

histogram_quantile(0.99, sum by (le) (rate(order_processing_duration_seconds_bucket{namespace="default",app="order-service"}[5m])))

sum by (product_category) (rate(orders_total{namespace="default",app="order-service"}[5m]))

sum(rate(orders_total{namespace="default",app="order-service",status="payment_failed"}[5m])) / sum(rate(orders_total{namespace="default",app="order-service"}[5m]))
increase estimates the interval total; rate is per second. Process restarts, retries and missed scrapes mean operational counters/amount sums are not an accounting ledger. For unique committed orders or revenue, reconcile with the durable business system rather than assuming telemetry is exactly-once.
Grafana: this complete dashboard object expects datasource UID prometheus and the labels from the monitor above. Save it without an API wrapper and use the documented dashboard file provisioning. A ConfigMap label alone does not configure a provider.
{
  "uid": "order-business-metrics",
  "title": "Order Processing Operational Metrics",
  "timezone": "browser",
  "panels": [
    {
      "id": 1,
      "title": "Completed Attempts per Minute",
      "type": "timeseries",
      "datasource": {
        "type": "prometheus",
        "uid": "prometheus"
      },
      "targets": [
        {
          "expr": "sum(rate(orders_total{namespace=\"default\",app=\"order-service\"}[5m])) * 60",
          "refId": "A"
        }
      ],
      "gridPos": {
        "x": 0,
        "y": 0,
        "w": 12,
        "h": 8
      }
    },
    {
      "id": 2,
      "title": "Attempt Success Fraction",
      "type": "gauge",
      "datasource": {
        "type": "prometheus",
        "uid": "prometheus"
      },
      "targets": [
        {
          "expr": "sum(rate(orders_total{namespace=\"default\",app=\"order-service\",status=\"success\"}[5m])) / sum(rate(orders_total{namespace=\"default\",app=\"order-service\"}[5m]))",
          "refId": "A"
        }
      ],
      "gridPos": {
        "x": 12,
        "y": 0,
        "w": 12,
        "h": 8
      },
      "fieldConfig": {
        "defaults": {
          "unit": "percentunit"
        }
      }
    },
    {
      "id": 3,
      "title": "Processing P95",
      "type": "timeseries",
      "datasource": {
        "type": "prometheus",
        "uid": "prometheus"
      },
      "targets": [
        {
          "expr": "histogram_quantile(0.95, sum by (le) (rate(order_processing_duration_seconds_bucket{namespace=\"default\",app=\"order-service\"}[5m])))",
          "refId": "A"
        }
      ],
      "gridPos": {
        "x": 0,
        "y": 8,
        "w": 12,
        "h": 8
      },
      "fieldConfig": {
        "defaults": {
          "unit": "s"
        }
      }
    },
    {
      "id": 4,
      "title": "Observed Successful Attempt Amount (Last Hour)",
      "type": "stat",
      "datasource": {
        "type": "prometheus",
        "uid": "prometheus"
      },
      "targets": [
        {
          "expr": "sum(increase(order_amount_dollars_sum{namespace=\"default\",app=\"order-service\"}[1h]))",
          "refId": "A"
        }
      ],
      "gridPos": {
        "x": 12,
        "y": 8,
        "w": 12,
        "h": 8
      },
      "fieldConfig": {
        "defaults": {
          "unit": "currencyUSD"
        }
      }
    }
  ],
  "time": {
    "from": "now-1h",
    "to": "now"
  },
  "refresh": "30s"
}Alerts: select this rule with the installed Prometheus Operator. The minimum traffic threshold avoids a ratio alert on no traffic; absence/scrape failure needs a separate signal. Thresholds are examples, not business SLO guarantees.
apiVersion: monitoring.coreos.com/v1
kind: PrometheusRule
metadata:
  name: business-metrics-alerts
  namespace: istio-system
spec:
  groups:
  - name: business-metrics
    rules:
    - alert: LowOrderAttemptSuccessFraction
      expr: (sum(rate(orders_total{namespace="default",app="order-service",status="success"}[5m])) / sum(rate(orders_total{namespace="default",app="order-service"}[5m]))
        < 0.95) and (sum(rate(orders_total{namespace="default",app="order-service"}[5m])) > 0.1)
      for: 5m
      labels:
        severity: warning
      annotations:
        summary: Order-processing attempt success fraction below95%
    - alert: SlowOrderProcessing
      expr: histogram_quantile(0.95, sum by (le) (rate(order_processing_duration_seconds_bucket{namespace="default",app="order-service"}[5m])))
        > 2
      for: 5m
      labels:
        severity: warning
      annotations:
        summary: P95 processing attempt duration exceeds2s
See the Python client and JavaScript client documentation for metric types, exposition and process models.
Score Calculation
- Multiple Choice 1-5: 10 points each (Total 50 points)
- Short Answer 6-10: 10 points each (Total 50 points)
- Total: 100 points
Evaluation Criteria:
- 90-100 points: Excellent understanding of these topics
- 80-89 points: Good understanding; deployment validation remains separate
- 70-79 points: Average (Additional learning recommended)
- 60-69 points: Below Average (Review of basic concepts needed)
- 0-59 points: Re-learning needed