Istio Dashboards
Review baseline: Istio 1.31; Kiali compatibility is qualified below. Last Updated: September 11, 2026
Use Grafana, Kiali and Prometheus to inspect configured telemetry. The examples are lab configuration patterns checked against official references and offline validation; they were not deployed or production-load tested. Backend availability, authentication, namespace permissions, storage and version compatibility are explicit prerequisites.
Table of Contents
- Dashboard Overview
- Kiali
- Grafana Dashboards
- Prometheus
- Creating Custom Dashboards
- Dashboard Integration
- Best Practices
Dashboard Overview
Observability Stack Architecture
Kiali reads Istio resources from the Kubernetes API and queries Prometheus; istiod configures proxies rather than pushing configuration to Kiali. Grafana queries the configured metrics/log/trace backends. Prometheus scrapes proxy metrics, collectors deliver access logs/spans, and tracing applications must propagate context.
Purpose by Tool
| Tool | Primary Use | Data Source |
|---|---|---|
| Kiali | Service topology, traffic analysis, configuration validation | Prometheus, Istio Config |
| Grafana | Metrics visualization, alerting, log analysis | Prometheus, Loki, Tempo |
| Prometheus | Metrics collection and querying | Envoy, istiod |
| Jaeger | Distributed trace analysis | Envoy spans |
Kiali
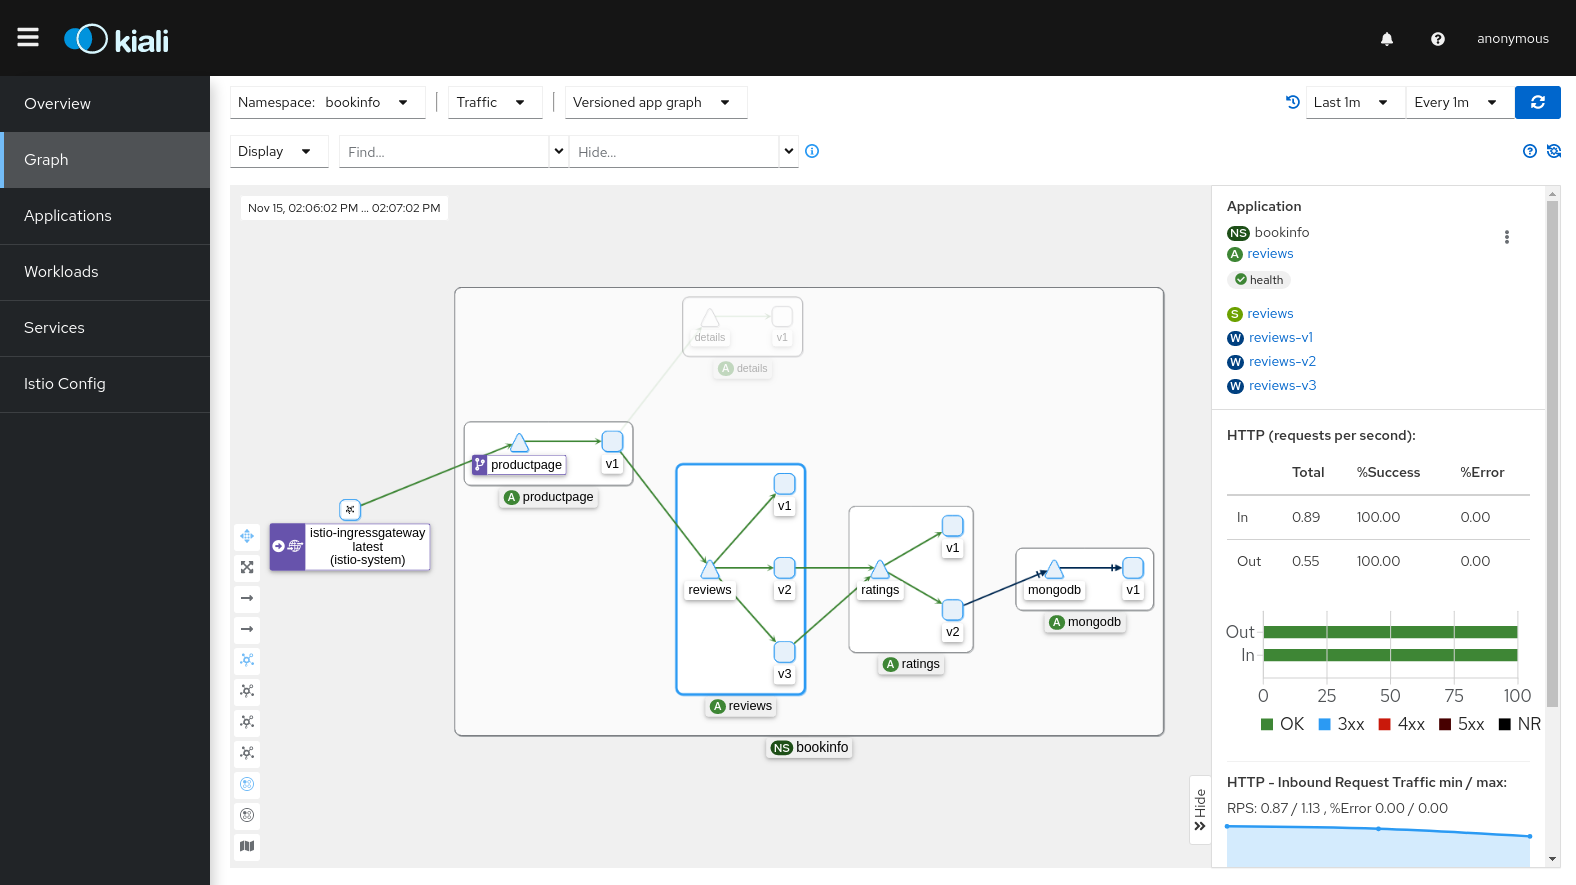
Kiali is an observability console for Istio service mesh. It visualizes service topology in real-time, analyzes traffic flow, and validates Istio configurations.
Kiali's Core Value
- Service Graph Visualization: Intuitively represents relationships and traffic flow between microservices
- Real-time Monitoring: View request rate, error rate, and response time in real-time
- Configuration Validation: Detect errors in Istio CRDs like VirtualService, DestinationRule
- mTLS Status Verification: Visually confirm mTLS application between services
- Distributed Tracing Integration: View traces directly from service graph with Jaeger integration
Installation Example and Compatibility
Kiali 2.31.0 and its operator were released on August 23, 2026. The published compatibility table currently lists Istio 1.30 with Kiali 2.26+ and Istio 1.29 with Kiali 2.21+; it does not yet explicitly list Istio 1.31. Treat the following as a Kiali 2.31 configuration example for a documented compatible Istio deployment. Confirm 1.31 compatibility with current maintainer guidance and a representative lab before using that combination; neither matching version numbers nor “latest” proves compatibility. Do not downgrade an existing mesh merely to follow this example.
1. Install the Kiali Operator
helm repo add kiali https://kiali.org/helm-charts
helm repo update kiali
helm install kiali-operator kiali/kiali-operator \
  --namespace kiali-operator --create-namespace --version 2.31.0
kubectl get pods -n kiali-operator
2. Create a Scoped, View-Only Kiali CR
A reachable Prometheus containing the Istio metrics must already exist; adapt the URL if its Service has a different name. The Prometheus Operator example later defines prometheus in istio-system. The operator gives Kiali access to its own namespace plus namespaces matched by discovery selectors. With cluster_wide_access: false, it creates namespaced access rather than granting the server cluster-wide access. End-user RBAC can narrow visible namespaces further.
apiVersion: kiali.io/v1alpha1
kind: Kiali
metadata:
  name: kiali
  namespace: istio-system
spec:
  deployment:
    cluster_wide_access: false
    discovery_selectors:
      default:
      - matchExpressions:
        - key: kubernetes.io/metadata.name
          operator: In
          values:
          - default
          - app
          - production
    view_only_mode: true
    replicas: 1
    resources:
      requests:
        cpu: 100m
        memory: 256Mi
      limits:
        cpu: 500m
        memory: 1Gi
  auth:
    strategy: token
  external_services:
    prometheus:
      url: http://prometheus.istio-system.svc.cluster.local:9090
    grafana:
      enabled: false
    tracing:
      enabled: false
Save this as kiali-cr.yaml, then apply it. Create the intended application namespaces before reconciliation. Kiali does not automatically inherit Istio's discovery selectors. The old accessible_namespaces field was removed in Kiali 2.0. Backend Grafana/tracing integrations are disabled until their endpoints, credentials and compatibility are configured.
kubectl apply -f kiali-cr.yaml
kubectl get kiali,pods -n istio-system
kubectl port-forward -n istio-system svc/kiali 20001:20001
For external access, configure a maintained ingress/gateway, TLS certificates, authentication and browser-reachable URLs separately. The example does not install an ingress controller, cert-manager issuer or public endpoint. Proxy-status features can depend on istiod's debug API; if it is intentionally disabled, set external_services.istio.istio_api_enabled: false and accept those feature limits rather than assuming every view is available.
Accessing Kiali
Open http://localhost:20001 after port-forwarding. Token authentication uses a Kubernetes ServiceAccount token and respects the account's namespace permissions. Use a dedicated viewer identity with the intended RBAC; do not use the Kiali server/operator ServiceAccount as a convenient administrator login. For an already-created and properly bound account:
kubectl create token kiali-viewer -n default --duration=1hThe API server determines the actual token lifetime. Token strategy supports a single cluster. Multi-cluster/OIDC deployments require their documented authentication setup, registered redirect URI and namespace authorization; a client ID and issuer URL alone are not a complete production configuration. See Kiali prerequisites and namespace management.
Kiali Key Features
1. Service Graph (Graph)
Overview:
- Visualize service topology by namespace
- Display traffic flow and request rate (RPS)
- Visualize error rate and response time
- Verify traffic distribution by version
Traffic animation illustrates traffic aggregated over the selected time window and refresh interval. It is not a packet capture or one dot per request. Use edge metrics for quantitative analysis.
Graph View Types:
| View Type | Description | Use Scenario |
|---|---|---|
| App Graph | Application level | Understanding service dependencies |
| Versioned App Graph | Application by version | Canary deployment monitoring |
| Workload Graph | Workload level | Deployment/StatefulSet level analysis |
| Service Graph | Service level | Kubernetes Service-centric view |
Graph Filter Options:
# Edge label display
- Request percentage: Traffic distribution rate (%)
- Request rate: Request rate (RPS)
- Response time: Selected latency statistic
- Throughput: Throughput (bytes/sec)

# Display options
- Traffic Animation: Real-time traffic flow
- Service Nodes: Show service nodes
- Traffic Distribution: Version-based traffic distribution
- Security: mTLS lock icon
- Circuit Breakers: Circuit breaker status
- Virtual Services: VirtualService icon
Find/Hide Feature:
# Find slow edges
Find: response time > 1s
Expression: rt > 1000

# Find unhealthy nodes
Find: unhealthy nodes
Expression: ! healthy

# Hide specific services
Hide: kube-system namespace
2. Applications View
Detailed information for each application:
- Overview: Overall status summary
- Traffic: Inbound/outbound traffic metrics
- Request volume (RPS)
- Request duration (P50, P95, P99)
- Request size / Response size
- Inbound Metrics: Incoming traffic analysis
- Source workloads
- Request protocols (HTTP/gRPC/TCP)
- Response codes
- Outbound Metrics: Outgoing traffic analysis
- Destination services
- Response times
- Error rates
3. Workloads View
Detailed information per workload (Deployment, StatefulSet, etc.):
- Pods: Pod list and status
- Services: Connected Service list
- Logs: Real-time pod logs (Envoy + Application)
- Metrics: Workload metrics
- Request volume
- Duration (P50/P95/P99)
- Error rate
- Traces: Distributed tracing with Jaeger integration
- Envoy: Envoy configuration verification
- Clusters
- Listeners
- Routes
- Bootstrap config
4. Services View
Detailed information per Kubernetes Service:
- Overview: Service metadata
- Traffic: Traffic metrics
- Inbound Metrics: Request analysis by client
- Traces: Service call tracing
5. Istio Configuration Validation (Istio Config)
Kiali validates supported Istio resources using available cluster state. The view-only example can inspect configuration; editing requires separately authorized permissions. A green check means the implemented checks passed, not proof of runtime correctness.
Validation Targets:
- VirtualService
- DestinationRule
- Gateway
- ServiceEntry
- Sidecar
- PeerAuthentication
- RequestAuthentication
- AuthorizationPolicy
- Telemetry
Validation Levels:
| Icon | Level | Description |
|---|---|---|
| ✅ | Valid | Available checks passed |
| ⚠️ | Warning | Potential issue (best practice violation) |
| ❌ | Error | Detected configuration error; API admission may still succeed |
Validation Example: KIA1107, Subset Not Found
In namespace default, short host reviews resolves to reviews.default.svc.cluster.local; using those two forms alone is not a host mismatch. KIA0101 means a referenced namespace was not found in an AuthorizationPolicy. The following deliberately broken example instead routes to v2 while only v1 is defined:
apiVersion: networking.istio.io/v1
kind: VirtualService
metadata:
  name: reviews
  namespace: default
spec:
  hosts:
  - reviews.default.svc.cluster.local
  http:
  - route:
    - destination:
        host: reviews.default.svc.cluster.local
        subset: v2
---
apiVersion: networking.istio.io/v1
kind: DestinationRule
metadata:
  name: reviews
  namespace: default
spec:
  host: reviews.default.svc.cluster.local
  subsets:
  - name: v1
    labels:
      version: v1
Define the referenced subset and deploy matching service endpoints, or route to the intended existing subset. Assuming both Bookinfo versions exist, this DestinationRule supplies both labels:
apiVersion: networking.istio.io/v1
kind: DestinationRule
metadata:
  name: reviews
  namespace: default
spec:
  host: reviews.default.svc.cluster.local
  subsets:
  - name: v1
    labels:
      version: v1
  - name: v2
    labels:
      version: v2
Kubernetes can accept a manifest that has semantic routing errors, so configuration warnings/errors are not identical to API admission failures.
6. Security
mTLS Status Verification
Use the graph's security indicators together with the selected traffic window and effective PeerAuthentication. Observed mTLS traffic does not prove that plaintext is forbidden: PERMISSIVE can carry entirely encrypted traffic during an observation window. Missing traffic/telemetry does not prove a service is secure, and a policy label alone does not establish authorization effectiveness. Confirm with configuration and allowed/denied traffic tests.
Security Dashboard:
- mTLS status by namespace
- PeerAuthentication policy application status
- AuthorizationPolicy effects
7. Distributed Tracing Integration
Kiali integrates with Jaeger to view traces directly from the service graph.
How to use:
- Click a service node in the graph
- Click "View Traces" link
- Automatically navigate to Jaeger UI to view traces for that service
Trace Details:
- Span duration (processing time for each service)
- Instrumented span attributes/events (headers are not captured automatically)
- Error details
- Service dependency map
Kiali Advanced Features
Traffic Shifting Visualization
apiVersion: networking.istio.io/v1
kind: VirtualService
metadata:
  name: reviews-canary
  namespace: default
spec:
  hosts:
  - reviews.default.svc.cluster.local
  http:
  - route:
    - destination:
        host: reviews.default.svc.cluster.local
        subset: v1
      weight: 90
    - destination:
        host: reviews.default.svc.cluster.local
        subset: v2
      weight: 10
---
apiVersion: networking.istio.io/v1
kind: DestinationRule
metadata:
  name: reviews
  namespace: default
spec:
  host: reviews.default.svc.cluster.local
  subsets:
  - name: v1
    labels:
      version: v1
  - name: v2
    labels:
      version: v2
The configured weights are 90/10; Kiali displays observed request rates for the selected window. Sampling variation, errors and routing conditions can make observed shares differ. This example assumes both subsets have matching endpoints.
Canary Deployment Monitoring:
- Observed request rate by version versus configured 90/10 weights
- Error rate comparison by version
- Response time by version (P50, P95, P99)
- Verify distribution with real-time traffic animation
Namespace Isolation and Access Control
This is an alternative selector configuration for the same Kiali instance, not an additional overlapping deployment. With cluster-wide access disabled, it limits server access to team-a plus its own control-plane namespace; user RBAC still applies. OpenID setup is a separate authentication task, and modern Keycloak defaults to /realms/... unless a custom /auth prefix is configured.
apiVersion: kiali.io/v1alpha1
kind: Kiali
metadata:
  name: kiali
  namespace: istio-system
spec:
  deployment:
    cluster_wide_access: false
    discovery_selectors:
      default:
      - matchLabels:
          kubernetes.io/metadata.name: team-a
    view_only_mode: true
    replicas: 1
    resources:
      requests:
        cpu: 100m
        memory: 256Mi
      limits:
        cpu: 500m
        memory: 1Gi
  auth:
    strategy: token
Grafana Dashboards
Official Istio Dashboards
The catalog below was checked against the downloaded Istio1.31.0 revisions, not just dashboard titles. Select the revision for the installed Istio release and map its Prometheus datasource when importing. A dashboard's newest revision is not automatically compatible with an older mesh.
| Dashboard | ID | Verified revision | Scope |
|---|---|---|---|
| Istio Mesh | 7639 | 330 | Global traffic, success/4xx/5xx, workload overview and component versions |
| Istio Service | 7636 | 329 | Client/server volume, duration, size, TCP traffic and source/destination workloads |
| Istio Workload | 7630 | 330 | Workload inbound/outbound HTTP and TCP metrics |
| Istio Performance | 11829 | 329 | Proxy/istiod vCPU, memory, disk, data rates and goroutines |
| Istio Control Plane | 7645 | 329 | Resources, xDS pushes/errors/timing, validation and injection webhooks |
| Istio Wasm Extension | 13277 | 287 | Wasm VM/runtime/cache/remote-loading state |
| Istio Ztunnel | 21306 | 97 | Ambient L4 connections, bytes, DNS, xDS and process resources |
The Service dashboard's service variable is a service host and its1.31 revision has srcns/dstns filters, rather than a generic namespace variable. The Workload dashboard has namespace and workload. Inspect the downloaded revision's variables before configuring deep links. IDs7636,11829 and13277 are respectively Service, Performance and Wasm, not Workload, generic Mesh and Gateway.
Import through Grafana's dashboard UI and choose the datasource. For a fresh test environment, Istio's pinned samples/addons/grafana.yaml bundles its dashboards; that sample is not production-hardened. For an existing deployment, use its documented provisioning mechanism rather than installing a second Grafana.
Community Loki Dashboard14876
The verified catalog entry is Grafana Loki Dashboard for Istio Service Mesh, revision3. It uses a pattern parser for a specific Envoy text format, with status_code and req_id, and variables for datasource/label/job/instance. Its panels include request/status counts, bytes, recent requests, duration and visitor/path/user-agent summaries. It does not establish mTLS security or provide every panel previously claimed here.
curl -fL -o istio-loki-dashboard.json \
  https://grafana.com/api/dashboards/14876/revisions/3/download
Review the file, then import it through the UI and bind its Loki datasource. Creating a labelled ConfigMap does not resolve datasource inputs or install a dashboard loader. This community revision is not directly compatible with the JSON provider/Alloy labels in this guide. Use the logging chapter's checked dashboard and queries for that format, or explicitly adapt the parser, fields and labels. Log-derived statistics describe retained logs and can be biased by filtering/sampling.
Metric Alert Rules
The following is a Prometheus Operator PrometheusRule, not Grafana-managed alert provisioning. Grafana-managed rules use query-data/condition/UID fields; configure them in Grafana and export the supported format when choosing that route. The Operator below selects rules in istio-system. Thresholds are examples to tune against SLOs and traffic volume; HTTP5xx is not the complete definition of a gRPC/application failure.
apiVersion: monitoring.coreos.com/v1
kind: PrometheusRule
metadata:
  name: istio-alerts
  namespace: istio-system
spec:
  groups:
  - name: istio-service-alerts
    rules:
    - alert: HighErrorRate
      expr: sum by (destination_service_name, destination_service_namespace) (rate(istio_requests_total{reporter="destination",response_code=~"5.."}[5m]))
        / sum by (destination_service_name, destination_service_namespace) (rate(istio_requests_total{reporter="destination"}[5m]))
        > 0.05
      for: 2m
      labels:
        severity: warning
      annotations:
        summary: High HTTP error fraction for {{ $labels.destination_service_name }}
        description: Error fraction is {{ $value | humanizePercentage }}
    - alert: HighLatency
      expr: histogram_quantile(0.95, sum by (destination_service_name, destination_service_namespace,
        le) (rate(istio_request_duration_milliseconds_bucket{reporter="destination"}[5m]))) > 1000
      for: 5m
      labels:
        severity: warning
      annotations:
        summary: P95 HTTP duration exceeds1000ms
    - alert: UpstreamOverflow
      expr: sum by (destination_service_name, destination_service_namespace) (rate(istio_requests_total{response_flags=~".*UO.*",reporter="source"}[5m]))
        > 0
      for: 1m
      labels:
        severity: warning
      annotations:
        summary: Source proxy reports upstream overflow
    - alert: PlaintextMeshTraffic
      expr: sum by (source_workload, source_workload_namespace, destination_workload, destination_workload_namespace)
        (rate(istio_requests_total{connection_security_policy="none",reporter="destination"}[5m])) > 0
      for: 5m
      labels:
        severity: warning
      annotations:
        summary: Observed plaintext traffic; inspect intended PeerAuthentication
The error expression remains a fraction, so humanizePercentage displays it correctly. Source reporting is used for upstream overflow that may never reach the destination. Missing plaintext metrics do not prove STRICT enforcement.
Prometheus
Prometheus Operator Lab Configuration
This assumes a separately installed, compatible Prometheus Operator/CRDs and a working gp3 StorageClass on EKS EC2 nodes (or the appropriate class on another platform). It does not install the operator, provision EBS, or configure a production storage/HA design. Memory/CPU/storage values are illustrative. Use this or an existing Prometheus deployment, not duplicate scrape stacks.
The ServiceMonitor, PodMonitor and PrometheusRule selectors below match all corresponding resources in this CR's namespace by default. They therefore include the monitors in the metrics chapter, which did not carry the old example's mismatching labels. Monitor resource selection and the workload namespaces each monitor discovers are separate settings. RBAC below is for Kubernetes target discovery; additional scrape types may need different permissions.
apiVersion: v1
kind: ServiceAccount
metadata:
  name: prometheus-istio
  namespace: istio-system
---
apiVersion: rbac.authorization.k8s.io/v1
kind: ClusterRole
metadata:
  name: prometheus-istio-discovery
rules:
- apiGroups:
  - ''
  resources:
  - services
  - endpoints
  - pods
  verbs:
  - get
  - list
  - watch
- apiGroups:
  - discovery.k8s.io
  resources:
  - endpointslices
  verbs:
  - get
  - list
  - watch
---
apiVersion: rbac.authorization.k8s.io/v1
kind: ClusterRoleBinding
metadata:
  name: prometheus-istio-discovery
roleRef:
  apiGroup: rbac.authorization.k8s.io
  kind: ClusterRole
  name: prometheus-istio-discovery
subjects:
- kind: ServiceAccount
  name: prometheus-istio
  namespace: istio-system
---
apiVersion: monitoring.coreos.com/v1
kind: Prometheus
metadata:
  name: istio
  namespace: istio-system
spec:
  replicas: 1
  retention: 15d
  retentionSize: 50GB
  serviceAccountName: prometheus-istio
  podMetadata:
    labels:
      monitoring-stack: istio
  serviceMonitorSelector: {}
  podMonitorSelector: {}
  ruleSelector: {}
  resources:
    requests:
      cpu: 1000m
      memory: 4Gi
    limits:
      cpu: 2000m
      memory: 8Gi
  storage:
    volumeClaimTemplate:
      spec:
        accessModes:
        - ReadWriteOnce
        resources:
          requests:
            storage: 100Gi
        storageClassName: gp3
---
apiVersion: v1
kind: Service
metadata:
  name: prometheus
  namespace: istio-system
spec:
  selector:
    monitoring-stack: istio
  ports:
  - name: http
    port: 9090
    targetPort: 9090
  type: ClusterIP
For long-term storage, merge a remote-write block only after deploying and securing the destination. The URL below assumes a VictoriaMetrics Service in observability; adapt it to the actual backend. Two Prometheus replicas scrape the same targets, so remote storage needs an intentional HA/deduplication design and replica labels. Merely changing replicas to2 does not make summed remote metrics correct. Verify persistence, failure behavior and capacity in the target environment.
spec:
  remoteWrite:
  - url: http://victoria-metrics.observability.svc.cluster.local:8428/api/v1/write
    queueConfig:
      capacity: 10000
      maxShards: 5
      minShards: 1
      maxSamplesPerSend: 5000
Prometheus Query Examples
Golden Signals
Latency is milliseconds. Saturation examples show active connections and a breaker state gauge; there is no standard cx_max metric for an automatic utilization denominator.
# 1. Latency
histogram_quantile(0.95,
  sum(rate(istio_request_duration_milliseconds_bucket{
    reporter="destination"
  }[5m])) by (destination_service_name, destination_service_namespace, le)
)

# 2. Traffic
sum(rate(istio_requests_total{reporter="destination"}[1m])) by (destination_service_name, destination_service_namespace)

# 3. Errors (error rate)
sum(rate(istio_requests_total{response_code=~"5..", reporter="destination"}[5m])) by (destination_service_name, destination_service_namespace)
/
sum(rate(istio_requests_total{reporter="destination"}[5m])) by (destination_service_name, destination_service_namespace)
* 100

# 4. Saturation
envoy_cluster_upstream_cx_active
envoy_cluster_circuit_breakers_default_cx_open
Creating Custom Dashboards
Grafana Dashboard JSON Template
This is a classic dashboard object for import/file provisioning. Supply an existing prometheus datasource UID. Every panel filters namespace and service; the per-source table also preserves source namespace.
{
  "title": "Custom Istio Service Dashboard",
  "tags": [
    "istio",
    "custom"
  ],
  "timezone": "browser",
  "version": 1,
  "panels": [
    {
      "id": 1,
      "title": "Request Rate",
      "type": "timeseries",
      "gridPos": {
        "h": 8,
        "w": 12,
        "x": 0,
        "y": 0
      },
      "targets": [
        {
          "expr": "sum(rate(istio_requests_total{reporter=\"destination\",destination_service_namespace=\"$namespace\",destination_service_name=\"$service\"}[5m])) by (response_code)",
          "legendFormat": "{{ response_code }}",
          "refId": "A",
          "datasource": {
            "type": "prometheus",
            "uid": "prometheus"
          }
        }
      ],
      "fieldConfig": {
        "defaults": {
          "color": {
            "mode": "palette-classic"
          },
          "custom": {
            "drawStyle": "line",
            "lineInterpolation": "linear",
            "fillOpacity": 10
          },
          "unit": "reqps"
        }
      },
      "datasource": {
        "type": "prometheus",
        "uid": "prometheus"
      }
    },
    {
      "id": 2,
      "title": "P95 Latency",
      "type": "gauge",
      "gridPos": {
        "h": 8,
        "w": 6,
        "x": 12,
        "y": 0
      },
      "targets": [
        {
          "expr": "histogram_quantile(0.95, sum(rate(istio_request_duration_milliseconds_bucket{reporter=\"destination\",destination_service_namespace=\"$namespace\",destination_service_name=\"$service\"}[5m])) by (le))",
          "refId": "A",
          "datasource": {
            "type": "prometheus",
            "uid": "prometheus"
          }
        }
      ],
      "fieldConfig": {
        "defaults": {
          "unit": "ms",
          "thresholds": {
            "mode": "absolute",
            "steps": [
              {
                "value": 0,
                "color": "green"
              },
              {
                "value": 500,
                "color": "yellow"
              },
              {
                "value": 1000,
                "color": "red"
              }
            ]
          },
          "max": 2000
        }
      },
      "options": {
        "showThresholdLabels": true,
        "showThresholdMarkers": true
      },
      "datasource": {
        "type": "prometheus",
        "uid": "prometheus"
      }
    },
    {
      "id": 3,
      "title": "Error Rate",
      "type": "stat",
      "gridPos": {
        "h": 8,
        "w": 6,
        "x": 18,
        "y": 0
      },
      "targets": [
        {
          "expr": "sum(rate(istio_requests_total{reporter=\"destination\",destination_service_namespace=\"$namespace\",destination_service_name=\"$service\", response_code=~\"5..\"}[5m])) / sum(rate(istio_requests_total{reporter=\"destination\",destination_service_namespace=\"$namespace\",destination_service_name=\"$service\"}[5m])) * 100",
          "refId": "A",
          "datasource": {
            "type": "prometheus",
            "uid": "prometheus"
          }
        }
      ],
      "fieldConfig": {
        "defaults": {
          "unit": "percent",
          "thresholds": {
            "mode": "absolute",
            "steps": [
              {
                "value": 0,
                "color": "green"
              },
              {
                "value": 1,
                "color": "yellow"
              },
              {
                "value": 5,
                "color": "red"
              }
            ]
          }
        }
      },
      "datasource": {
        "type": "prometheus",
        "uid": "prometheus"
      }
    },
    {
      "id": 4,
      "title": "Request by Source",
      "type": "table",
      "gridPos": {
        "h": 8,
        "w": 12,
        "x": 0,
        "y": 8
      },
      "targets": [
        {
          "expr": "sum(rate(istio_requests_total{reporter=\"destination\",destination_service_namespace=\"$namespace\",destination_service_name=\"$service\"}[5m])) by (source_workload, source_workload_namespace, response_code)",
          "format": "table",
          "instant": true,
          "refId": "A",
          "datasource": {
            "type": "prometheus",
            "uid": "prometheus"
          }
        }
      ],
      "transformations": [
        {
          "id": "organize",
          "options": {
            "excludeByName": {
              "Time": true
            },
            "indexByName": {
              "source_workload": 0,
              "response_code": 1,
              "Value": 2
            },
            "renameByName": {
              "source_workload": "Source",
              "response_code": "Code",
              "Value": "RPS"
            }
          }
        }
      ],
      "datasource": {
        "type": "prometheus",
        "uid": "prometheus"
      }
    },
    {
      "id": 5,
      "title": "Upstream Overflow and Retry Exhaustion",
      "type": "timeseries",
      "gridPos": {
        "h": 8,
        "w": 12,
        "x": 12,
        "y": 8
      },
      "targets": [
        {
          "expr": "sum(rate(istio_requests_total{reporter=\"source\",destination_service_namespace=\"$namespace\",destination_service_name=\"$service\", response_flags=~\".*UO.*\"}[5m]))",
          "legendFormat": "Upstream overflow",
          "refId": "A",
          "datasource": {
            "type": "prometheus",
            "uid": "prometheus"
          }
        },
        {
          "expr": "sum(rate(istio_requests_total{reporter=\"source\",destination_service_namespace=\"$namespace\",destination_service_name=\"$service\", response_flags=~\".*URX.*\"}[5m]))",
          "legendFormat": "Retry/connect attempts exhausted",
          "refId": "B",
          "datasource": {
            "type": "prometheus",
            "uid": "prometheus"
          }
        }
      ],
      "datasource": {
        "type": "prometheus",
        "uid": "prometheus"
      }
    }
  ],
  "templating": {
    "list": [
      {
        "name": "namespace",
        "type": "query",
        "query": "label_values(istio_requests_total, destination_service_namespace)",
        "datasource": {
          "type": "prometheus",
          "uid": "prometheus"
        },
        "current": {
          "selected": true,
          "text": "default",
          "value": "default"
        },
        "multi": false
      },
      {
        "name": "service",
        "type": "query",
        "query": "label_values(istio_requests_total{destination_service_namespace=\"$namespace\"}, destination_service_name)",
        "datasource": {
          "type": "prometheus",
          "uid": "prometheus"
        },
        "current": {},
        "multi": false
      }
    ]
  },
  "time": {
    "from": "now-1h",
    "to": "now"
  },
  "refresh": "30s",
  "uid": "custom-istio-service"
}
Dashboard File Provisioning
Save the complete JSON object above as custom-istio-service.json. Do not put an ellipsis or an HTTP API { "dashboard": ... } wrapper in a provisioned dashboard file.
kubectl create configmap grafana-dashboard-custom-istio \
  --from-file=custom-istio-service.json -n observability \
--dry-run=client -o yaml | kubectl apply -f -apiVersion: v1
kind: ConfigMap
metadata:
name: grafana-istio-provider
namespace: observability
data:
istio.yaml: |
apiVersion: 1
providers:
- name: istio
orgId: 1
folder: Istio
type: file
disableDeletion: false
editable: false
options:
path: /var/lib/grafana/istio-dashboardsMerge these mounts into the existing Grafana Deployment/Helm values, preserving its image, credentials, storage, probes and other containers. The container name must match the real Deployment. The provider mounted with subPath requires a controlled pod rollout when that provider file changes. If using an already-configured dashboard sidecar, follow its chart settings instead; a grafana_dashboard label alone does not install or configure a loader.
spec:
  template:
    spec:
      containers:
      - name: grafana
        volumeMounts:
        - name: istio-dashboards
          mountPath: /var/lib/grafana/istio-dashboards
          readOnly: true
        - name: istio-provider
          mountPath: /etc/grafana/provisioning/dashboards/istio.yaml
          subPath: istio.yaml
          readOnly: true
      volumes:
      - name: istio-dashboards
        configMap:
          name: grafana-dashboard-custom-istio
      - name: istio-provider
        configMap:
          name: grafana-istio-provider
Dashboard Integration
Kiali → Grafana and Trace Links
These are optional Kiali CR fragments to merge into the earlier example. internal_url must be reachable by the Kiali server; external_url must be reachable by the user's browser. Kiali must authenticate to Grafana's API and find the exact dashboard names. Configure credentials using Kiali's supported Secret references and trust the private CA when applicable; this fragment does not create credentials or a public endpoint.
spec:
  external_services:
    grafana:
      enabled: true
      internal_url: http://grafana.observability.svc.cluster.local:3000
      external_url: https://grafana.example.com
      datasource_uid: prometheus
      dashboards:
      - name: Istio Service Dashboard
        variables:
          datasource: var-datasource
          service: var-service
      - name: Istio Workload Dashboard
        variables:
          datasource: var-datasource
          namespace: var-namespace
          workload: var-workload
For the Jaeger HTTP query endpoint from the tracing chapter, the current configuration belongs under external_services.tracing, with use_grpc: false for port16686. Validate backend/API compatibility and authentication before enabling it; OAuth2 injection is supported only with HTTP transport. Jaeger and Tempo integration are optional, separate configurations. Kiali custom dashboards have their own schema; Grafana JSON cannot be inserted as an external_services.custom_dashboards list.
spec:
  external_services:
    tracing:
      enabled: true
      provider: jaeger
      internal_url: http://jaeger-query.observability.svc.cluster.local:16686
      external_url: https://jaeger.example.com
      use_grpc: false
Grafana → Jaeger Link
Merge exemplar mapping into an existing Prometheus datasource. The name must match an actual exemplar label (commonly trace_id) and jaeger must be an existing datasource UID; this does not generate exemplars.
# Prometheus datasource configuration
apiVersion: v1
kind: ConfigMap
metadata:
  name: grafana-datasources
data:
  prometheus.yaml: |
    apiVersion: 1
    datasources:
    - name: Prometheus
      type: prometheus
      jsonData:
        exemplarTraceIdDestinations:
        - datasourceUid: jaeger
          name: trace_id
Loki → Tempo Integration
Merge the following fields into the existing Loki datasource. They require the real trace_id log field, tracing enabled and the same trace retained in Tempo; request_id is not a trace ID.
# Loki datasource configuration
apiVersion: 1
datasources:
- name: Loki
  type: loki
  jsonData:
    derivedFields:
    - datasourceUid: tempo
      matcherRegex: '"trace_id"\s*:\s*"([0-9a-fA-F]{32})"'
      name: TraceID
      url: '$${__value.raw}'
      urlDisplayLabel: 'View Trace'
Best Practices
1. Dashboard Organization
Grafana Folder Structure:
├── Istio/
│   ├── Overview/
│   │   ├── Istio Mesh Dashboard
│   │   └── Istio Control Plane Dashboard
│   ├── Services/
│   │   ├── Istio Service Dashboard
│   │   └── Custom Service Dashboards
│   ├── Workloads/
│   │   └── Istio Workload Dashboard
│   ├── Gateways/
│   │   └── Istio Gateway Dashboard
│   └── Logs/
│       ├── Loki Istio Dashboard (#14876)
│       └── Access Log Analysis
2. Variable Usage
Use consistent variables across all dashboards:
{
  "templating": {
    "list": [
      {"name": "datasource", "type": "datasource"},
      {"name": "namespace", "type": "query"},
      {"name": "service", "type": "query"},
      {"name": "workload", "type": "query"},
      {"name": "interval", "type": "interval", "auto": true}
    ]
  }
}
3. Alert Management
- Tiered Alerting: Critical (PagerDuty) → Warning (Slack) → Info (Email)
- Alert Grouping: Group by service, namespace
- Silencing Rules: Mute alerts during maintenance
4. Performance Optimization
# Grafana configuration
[dashboards]
min_refresh_interval = 10s

[panels]
disable_sanitize_html = false

[dataproxy]
timeout = 30
Query Optimization:
- Use Recording Rules to pre-compute frequently used queries
- Use
$__rate_intervalfor Prometheus rate windows;$__intervalcontrols query step/bucketing - Use
rate()for per-second rate andincrease()for interval totals; both account for counter resets
5. Access Control
These settings disable anonymous access/sign-up and assign the default Viewer organization role; they are not a complete per-resource RBAC policy. Configure the existing deployment's administrator credential through a Kubernetes Secret and Grafana's documented secret mechanism before exposing it. This ConfigMap alone does not set a password.
# Grafana authentication and default organization role
apiVersion: v1
kind: ConfigMap
metadata:
  name: grafana-config
data:
  grafana.ini: |
    [auth]
    disable_login_form = false

    [auth.anonymous]
    enabled = false

    [auth.basic]
    enabled = true

    [users]
    allow_sign_up = false
    auto_assign_org = true
    auto_assign_org_role = Viewer

    [security]
    admin_user = admin
6. Backup and Recovery
Back up provisioned dashboard/datasource files and export UI-managed dashboards using Grafana's supported UI/API. Full recovery also needs the Grafana database, configuration and plugins with an application-consistent backup procedure. There is no grafana-cli admin export-dashboard command.
Prometheus snapshots use its admin HTTP API, not promtool tsdb snapshot. The API must be intentionally enabled on a protected maintenance endpoint. After forwarding the selected Prometheus pod to localhost, a maintenance example is:
curl -fsS -X POST http://localhost:9090/api/v1/admin/tsdb/snapshotThe response gives the snapshot directory under the server's data directory. Copy that completed snapshot to the backup destination; a snapshot on the same disk is not an independent backup. Validate restoration, retention and remote-write recovery separately. No backup/deployment operation was executed for this document audit.
References
Official Documentation
Community Dashboards
- Grafana Loki Dashboard for Istio (#14876)
- Istio Workload Dashboard (#7630)
- Istio Performance Dashboard (#11829)
- Istio Wasm Extension Dashboard (#13277)