Part 6: Distributed Tracing Analysis
Difficulty: Advanced · Estimated time: 45 minutes Last Updated: September 13, 2026
Follow one real request from metrics through an exemplar to its trace and logs, separating observations from causal hypotheses. This requires the Part 2 ingestion path and Part 3 context propagation. The TraceQL below was checked with the actual Tempo 3.0.3 parser and uses current OTel attributes.
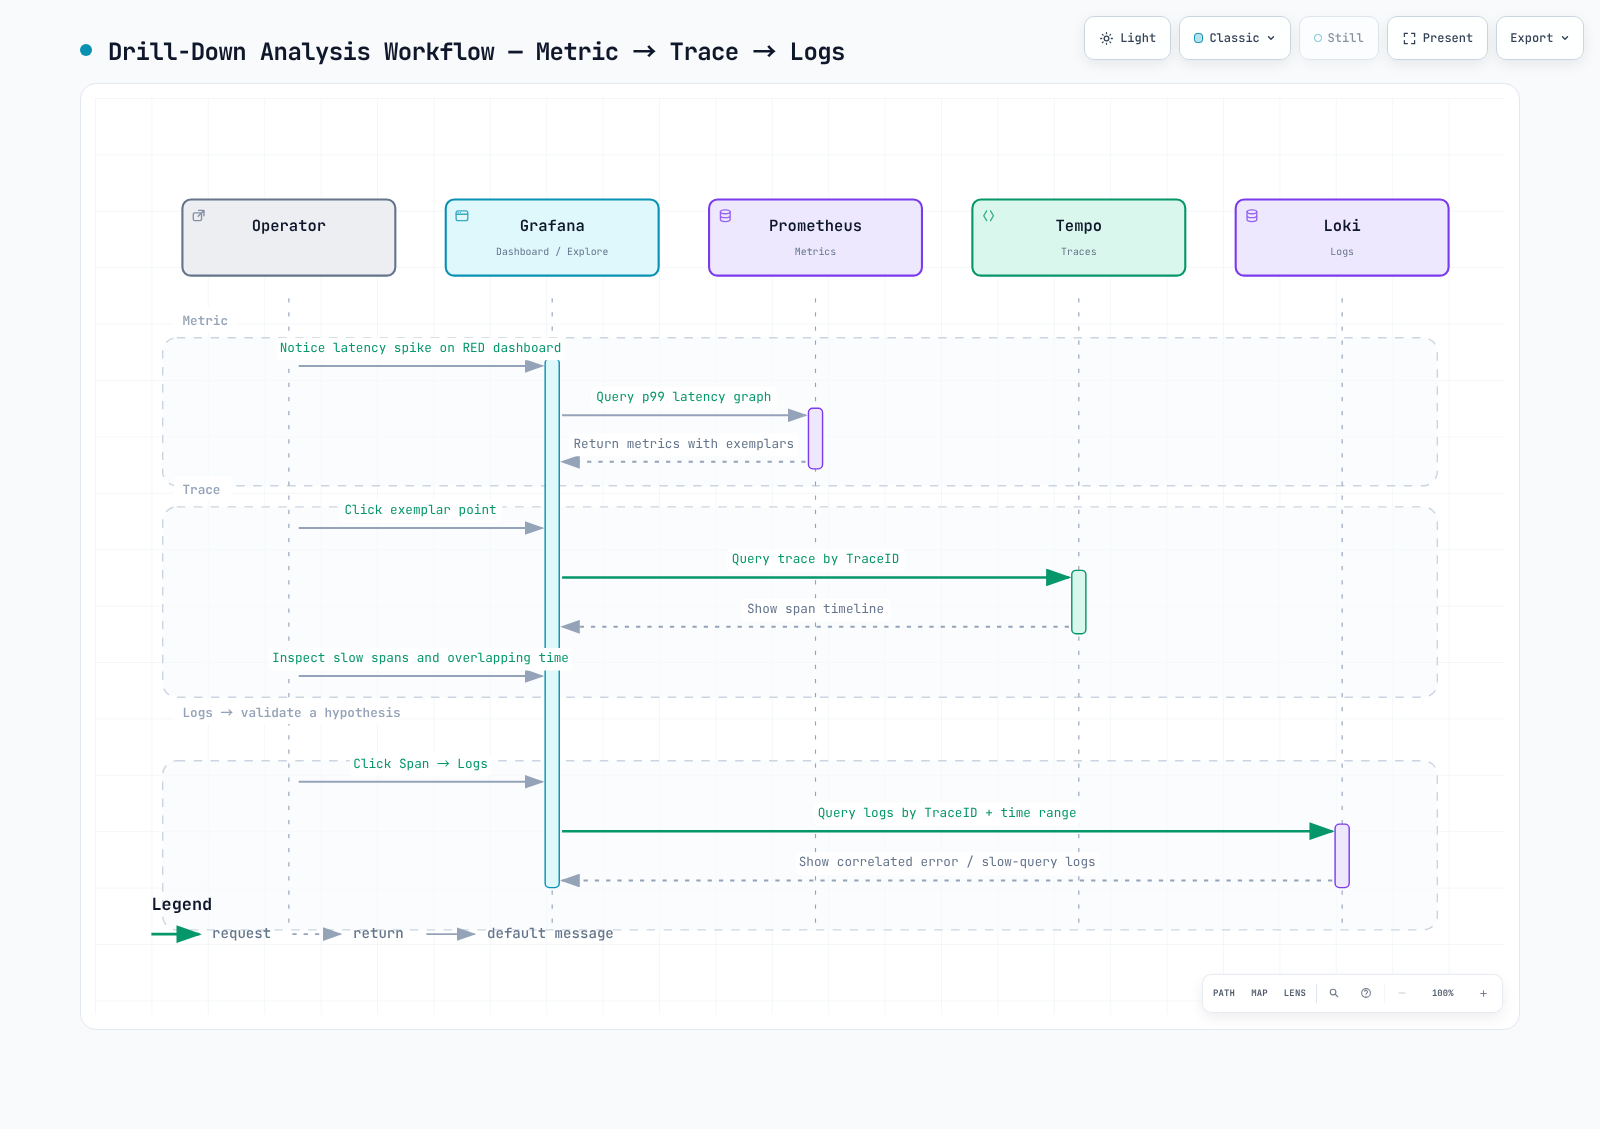
1. TraceQL search
{ resource.service.name = "order-service" && span:duration > 1s }

{ trace:duration > 2s && resource.service.name = "order-service" }

{ span:kind = server && span.http.response.status_code >= 500 }

{ span.db.system.name = "postgresql" && span:duration > 100ms }

{ span.messaging.system = "aws_sqs" && span.messaging.operation.type = "send" }

{ resource.service.name = "api-gateway" } >> { resource.service.name = "order-service" }

{ resource.service.name = "order-service" } >> { span.db.system.name = "postgresql" }

{ span:status = error } | select(resource.service.name, span.http.response.status_code, span:duration)
span:duration measures an individual span; trace:duration measures the whole trace. Use span: for explicit intrinsics and span./resource. for attributes. >> finds right-hand spans that descend from left-hand spans. Searching for descendants of a DB span is different from finding DB work beneath a service.
sort(duration), SQL order by, | limit 20 and { duration > p99 } are not this search syntax. Configure result sorting, search limit and time range in Grafana, and substitute a measured p99 with a duration literal such as 800ms. select() requests displayed attributes; it cannot recreate spans that were never stored.
Older SDKs may emit http.status_code, http.method, db.system, db.statement or messaging.operation. Inspect actual spans and SDK versions before using current http.response.status_code, http.request.method, db.system.name, db.query.text or messaging.operation.type. Renaming a query attribute does not transform collected data. Capture query text only under an explicit sanitization policy; exclude passwords, SQL literals and customer data.
2. Service graph prerequisites
Receiving traces in Tempo alone does not complete the Grafana service graph. Enable the metrics-generator service-graphs processor, deliver its metrics to a real metrics backend, and link the Grafana Tempo datasource serviceMap UID to that backend. Client/server or producer/consumer spans must share context. Sampling, missing spans and incorrect span kinds affect the resulting edges.
sum by (client, server) (rate(traces_service_graph_request_total[5m]))

(
  sum by (client, server) (rate(traces_service_graph_request_failed_total[5m]))
  or on (client, server)
  (0 * sum by (client, server) (rate(traces_service_graph_request_total[5m])))
)
/ on (client, server)
(sum by (client, server) (rate(traces_service_graph_request_total[5m])) > 0)

sum by (client, server) (rate(traces_service_graph_request_server_seconds_sum[5m]))
/
sum by (client, server) (rate(traces_service_graph_request_server_seconds_count[5m]))
The failure counter may have no series until the first failure. Fill its missing numerator with zero from the matching request-total series, then require a positive denominator to distinguish healthy 0% from no traffic or missing ingestion.
The last query measures mean server-side duration. Client-side duration uses traces_service_graph_request_client_seconds_*; do not query the nonexistent traces_service_graph_request_duration_seconds_* family. Treat zero-traffic intervals as missing evidence. Colors and edge widths depend on Grafana/dashboard settings; inspect request/error/duration values rather than assuming fixed 1%/5% color rules.
3. Form bottleneck hypotheses from the waterfall
| Observation | Follow-up |
|---|---|
| Slow DB span | Check query plan, locks, connection pool and DB metrics |
| Long client span | Compare DNS/TLS/network/server wait/retry intervals |
| Gap between parent and child | Check uninstrumented work, queues, GC and scheduling |
| Parallel child spans | Analyze overlap and critical path rather than summing durations |
| Messaging delay | Separate send/receive/process duration from queue wait and redelivery |
Parent duration includes child duration; summing all spans double-counts time. A 1.8-second DB span alone does not prove a missing index. Compare logs and metrics over the same release, traffic and time range before accepting a hypothesis.
4. Link logs and traces
{service_name="order-service"} | json | level="ERROR"

{service_name="order-service"} | json | trace_id="0123456789abcdef0123456789abcdef"
These queries assume an actual service_name stream label and JSON trace_id field. Replace the 32-character example trace ID with a real request ID. traceID, traceId and trace_id are different fields. Keep trace IDs in log fields/structured metadata, not unique stream labels. Set time bounds in Grafana/HTTP parameters; do not append timestamp >= 2025-... to LogQL.
A Loki derived field extracts the trace ID and links to the Tempo datasource UID. In Grafana provisioning YAML, escape the internal link expression as $${__value.raw}. Double-quoted regexes and broad shell envsubst can change backslashes or Grafana variables; use appropriate single quotes and narrowly scoped substitutions.
Configure Tempo tracesToLogsV2 with the Loki UID, actual resource-to-log label mapping, time padding and trace-ID filtering. Inspect the generated LogQL after clicking “Logs for this span.” The existence of a link and successful retrieval of the same request are separate checks.
5. Exemplar meaning and verification
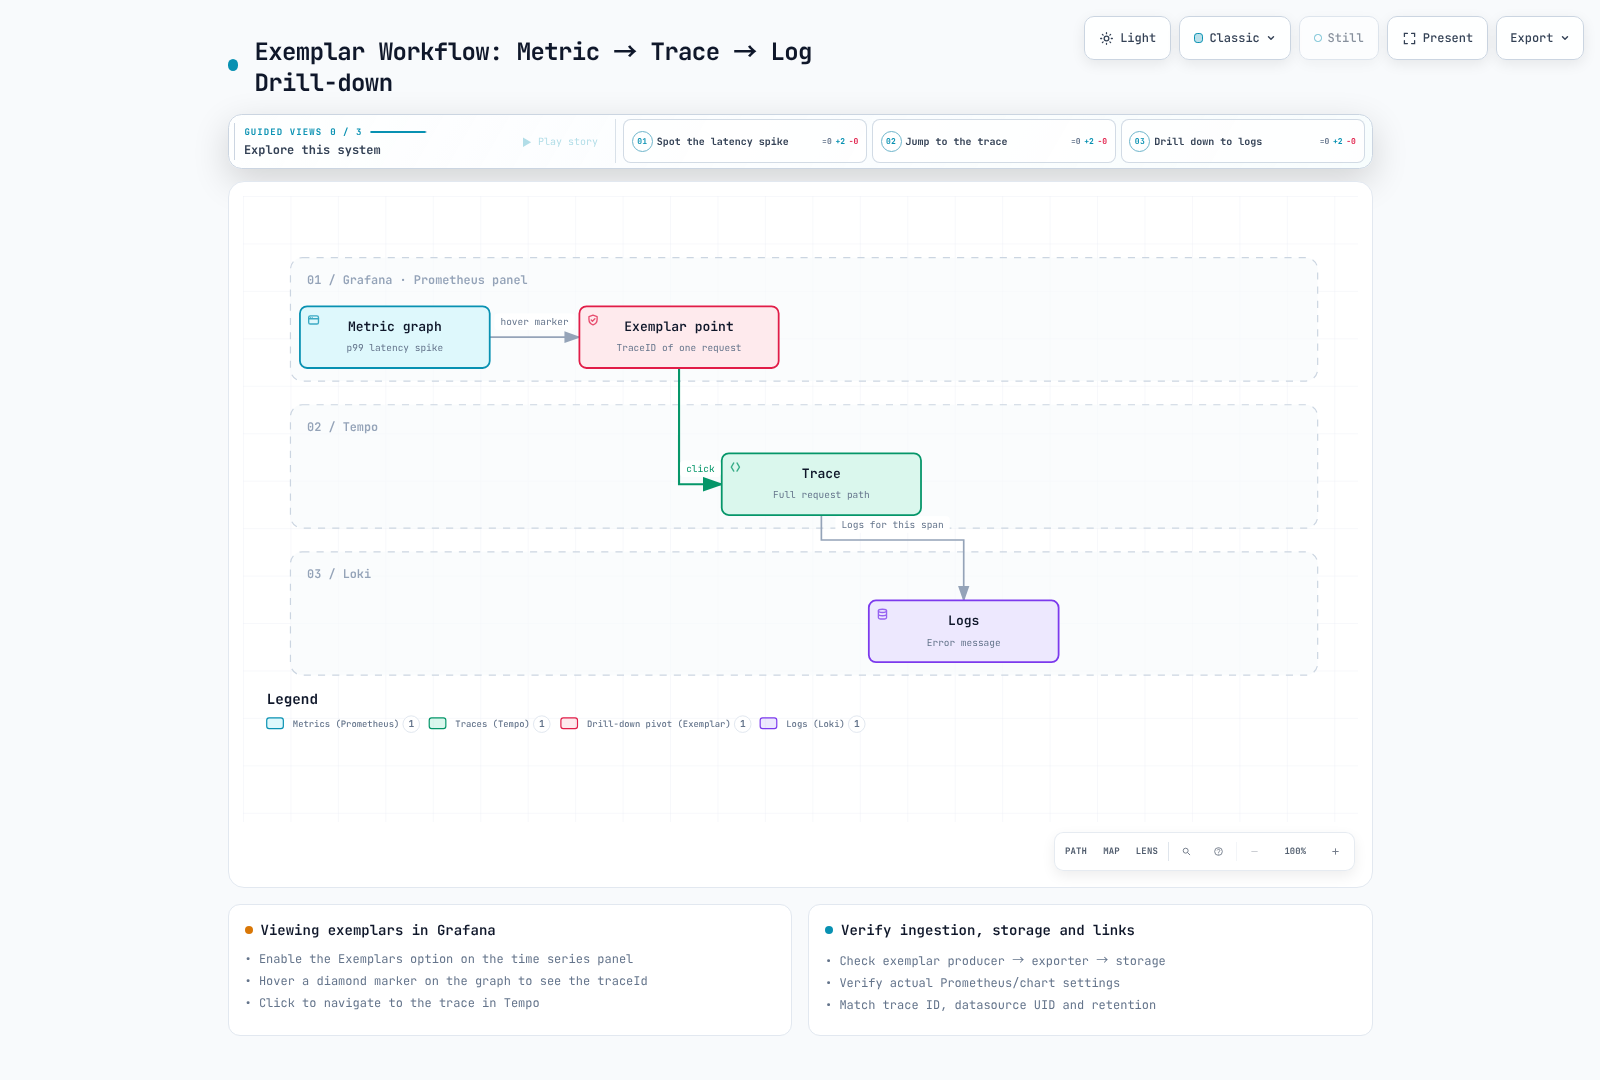
An exemplar is a representative observation attached to an aggregate. Clicking a point on a p99 graph does not prove that request determined the exact percentile boundary. Exemplar production, exporter/remote-write preservation, Prometheus storage and Grafana datasource linking must all work. Sampling or retention can leave an exemplar ID whose trace is unavailable.
Inspect actual Prometheus exemplar API results and query Tempo with the returned trace_id. Enabling a Grafana display option or searching a nonexistent Prometheus ConfigMap is not ingestion validation. Confirm exemplar-storage settings against the installed Prometheus/chart version and rendered Prometheus resource/runtime arguments.
6. RED and SLI/SLO dashboards
Build RED panels from actual metric names, labels and histogram units. Compare request rate, failure ratio and duration distribution over the same service/route scope. Define eligible requests and success before calculating availability; state how 4xx responses, health checks and retries are treated.
A 30-day SLO requires real retention and observations across that period. A [30d] query in a fresh lab does not create 30 days of evidence. Handle no traffic, missing series and counter resets; disclose low-volume percentile limitations. Calculate error budgets using allowed failures and observed failures over the same window. Record period, denominator and value rather than claiming a fixed “99.9% achieved.”
7. Verify the flow, then clean up
Before cleanup, record one request whose exemplar ID, Tempo trace ID and log trace ID match; verify actual service graph dependencies and alert delivery. Keep measured values, timestamps and configuration versions rather than filling results with estimates.
| Order | Action and completion condition |
|---|---|
| 1 | Stop k6/Locust, fault injection and AI analysis triggers; save results |
| 2 | Stop GitOps ApplicationSet/parent recreation and cascade-delete the actual application |
| 3 | Remove service-cluster LoadBalancers/Ingresses, workloads and PVCs; verify external LB/volume cleanup |
| 4 | Delete telemetry custom resources before uninstalling their operators using actual release/namespace names |
| 5 | Drain/delete Karpenter NodeClaims before removing the controller; retain API/LB/storage controllers while dependencies exist |
| 6 | Review destroy plans using the same IaC state; use recorded exact IDs/ARNs for manually created AWS resources |
| 7 | Delete EKS/VPC after dependency cleanup, then verify managed-service deletion and residual resources |
Do not delete shared namespaces or cluster-wide CRDs. Use the recorded installation release/namespace/version, not a latest installer URL. Versioned S3 requires checking old versions and delete markers as well as current objects. Reconcile Aurora snapshot policy, MWAA/DAG bucket, AMG, AMP, OpenSearch, SNS/SQS/DLQ, Lambda/API Gateway, IAM attachments, EBS/LBs, log groups and alarms against your inventory. Accepted deletion requests are not completed deletion.
Review resource ownership and preserve evidence/state instead of using an unchecked auto-approved destroy, suppressing every error, or deleting the whole work directory.
Validation scope and references
The current Tempo parser validated 12 accepted queries and rejected three previous erroneous queries. An ephemeral local Loki 3.7.7 received two synthetic log lines; both LogQL queries retrieved the exact expected trace ID. Actual service Tempo search, Loki collection, Grafana data linking and cloud deletion were not executed.