Kubernetes/EKS Troubleshooting Playbook: Symptom → Diagnosis → Cause → Fix
Versions recorded for the original examples: Original Amazon EKS 1.36 output example — control plane v1.36.2-eks-bca9cf6, platform version eks.9, Karpenter 1.4, VPC CNI v1.21, CoreDNS v1.14 Last reviewed: September 11, 2026
< Previous: Zonal Cluster Operations | Table of Contents >
When the pager goes off at 3 a.m. and you open a terminal, what you need is not a concept explanation but "the next command to type given what I see right now." This document starts from symptoms, not concepts. For each symptom it bundles "what you see → what you run → what the output looks like → the most common causes and how to fix them" into one block.
The outputs below illustrate the environment recorded in the original September 2, 2026 document and messages from official documentation. This review did not rerun that cluster or independently verify the original capture logs. In particular, the Karpenter compatibility matrix requires Karpenter 1.13 or later for Kubernetes 1.36. Do not reuse the recorded 1.4.0 combination as a supported deployment.
Deep root-cause analysis (control plane logs, CloudWatch Logs Insights queries, the eight causes of node join failure, and so on) already lives in EKS Troubleshooting and EKS Advanced Debugging. This page sits in front of those: its job is to decide within 30 seconds which page to open, so it links into them rather than repeating their content.
Table of Contents
- 30-Second Summary: Symptom → First Command → Most Common Cause
- Diagnostic Decision Tree
- Playbook by Symptom
- kubectl Diagnostic Cheat Sheet
- Going Deeper: Related Documents
- References
30-Second Summary: Symptom → First Command → Most Common Cause
Each symptom cell links to its playbook section below.
Symptom (what kubectl get pods/nodes shows) | First command | Most common cause |
|---|---|---|
Pending | kubectl describe pod <pod> → the FailedScheduling message in Events | Not enough resources (Insufficient cpu/memory), missing toleration, nodeSelector mismatch, unbound PVC |
ImagePullBackOff / ErrImagePull | kubectl describe pod <pod> → the Failed to pull image line | Tag typo, private registry auth (imagePullSecrets/node IAM), ECR region/account mismatch |
CrashLoopBackOff | kubectl logs <pod> --previous + check lastState.terminated | App fails at startup (exit 1), OOMKilled (exit 137), liveness probe failure, missing ConfigMap/Secret |
Running but READY 0/1 | kubectl describe pod <pod> → Readiness probe failed | Wrong readiness path/port, waiting on a dependency, sidecar not ready |
| Requests never reach the Service | kubectl get endpointslices -l kubernetes.io/service-name=<svc> | Selector label mismatch, wrong targetPort, NetworkPolicy block, CoreDNS outage |
Node NotReady | kubectl describe node <node> → Conditions | kubelet stopped/network partition, DiskPressure, MemoryPressure, PIDPressure |
PVC Pending | kubectl describe pvc <pvc> → Events | WaitForFirstConsumer (normal wait), missing/misspelled StorageClass, AZ mismatch |
AccessDenied in app logs (AWS API) | kubectl get sa <sa> -o yaml + injected credential-provider fields | IRSA (IAM Roles for Service Accounts) annotation/trust policy error, missing Pod Identity association, pods not restarted |
Stuck in ContainerCreating + failed to assign an IP address | kubectl describe pod <pod> → FailedCreatePodSandBox | Subnet IP exhaustion, node max-pods reached, aws-node unhealthy |
| Karpenter does not launch a node | kubectl get events -A --field-selector reason=FailedScheduling | NodePool limits reached, requirements/taint mismatch, instance type restriction |
Service creation rejected with failed calling webhook | kubectl -n kube-system get endpointslices -l kubernetes.io/service-name=aws-load-balancer-webhook-service | Webhook Deployment unhealthy (CrashLoop) behind a failurePolicy: Fail webhook that matches every namespace |
Diagnostic Decision Tree
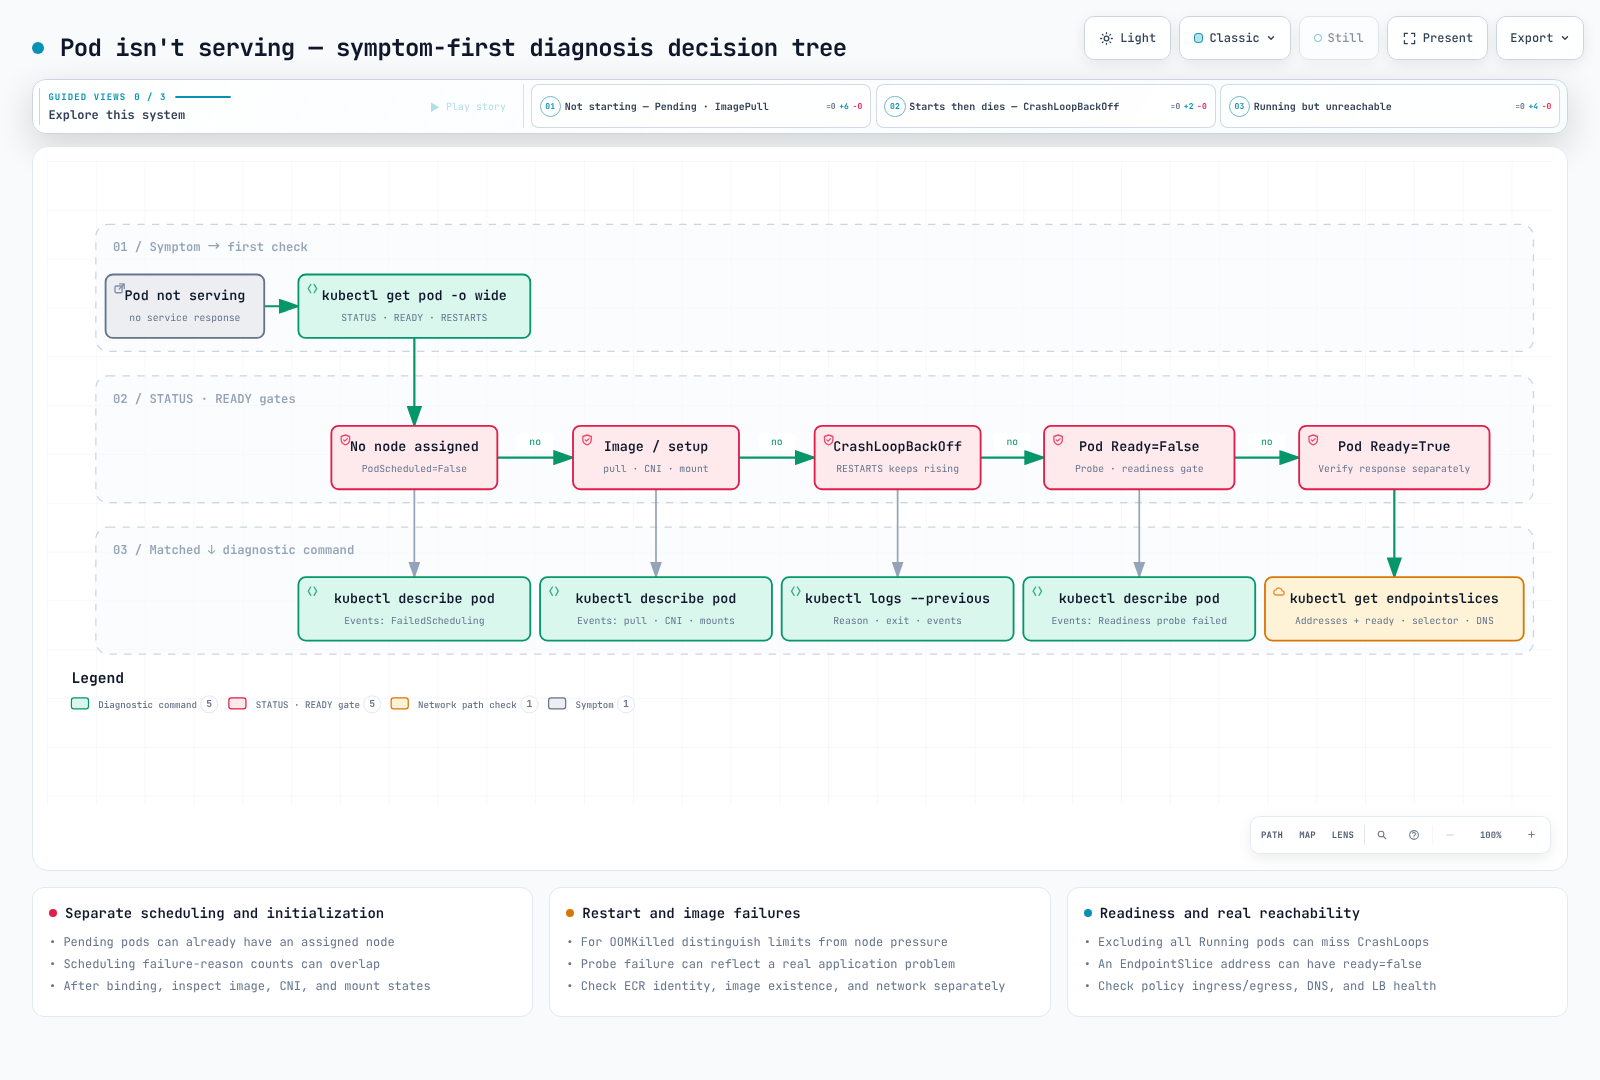
First confirm context and namespace. Replace placeholders such as <pod> and <ns> with actual values. Pod phase differs from container state: excluding every Running pod misses some CrashLoops and readiness failures. This query excludes completed pods and includes abnormal phases or missing/false Ready conditions.
# Inspect phase and Ready condition together
kubectl get pods -A -o json | jq -r '
  .items[]
  | select(.status.phase != "Succeeded")
  | select(.status.phase != "Running" or
      ([.status.conditions[]? | select(.type == "Ready" and .status == "True")] | length == 0))
  | [.metadata.namespace, .metadata.name, .status.phase,
     ([.status.initContainerStatuses[]?, .status.containerStatuses[]?
       | .state.waiting.reason // empty] | join(","))] | @tsv
'

# Recent Warning events (cluster-wide, sorted by lastTimestamp)
kubectl get events -A --field-selector type=Warning --sort-by=.lastTimestamp | tail -30
Playbook by Symptom
1. Pod stuck in Pending
Symptom: Pending includes both waiting for scheduling and image download/container setup. Check .spec.nodeName and the PodScheduled condition first. For an unbound pod inspect scheduling events; for a bound pod inspect container, mount, and CNI states.
Diagnosis: for an unscheduled pod, inspect FailedScheduling. It aggregates node counts by failure reason; these groups can overlap.
kubectl describe pod <pod> -n <ns> | sed -n '/^Events:/,$p'Warning FailedScheduling default-scheduler 0/15 nodes are available: 1 Insufficient cpu, 1 Insufficient memory,
6 node(s) didn't match Pod's node affinity/selector, 8 node(s) had untolerated taint(s).
no new claims to deallocate, preemption: 0/15 nodes are available:
1 No preemption victims found for incoming pod, 14 Preemption is not helpful for scheduling.Do not infer from this summary alone that the CPU and memory failures must refer to the same node, or that exactly one node satisfies every other constraint. The scheduler aggregation code can count multiple reasons for a node. Compare actual node labels, taints, and allocations; interpret DRA messages in the context of ResourceClaim usage.
Causes and fixes:
| Message fragment | Cause | Fix |
|---|---|---|
Insufficient cpu / Insufficient memory | Requests exceed remaining node capacity | Right-size requests, check the autoscaler (→ 10. Karpenter), inspect Allocated resources in kubectl describe node |
Too many pods | Configured node max-pods reached; check CNI IP capacity separately | → 9. ENI/IP exhaustion |
node(s) had untolerated taint(s) | No toleration for the node taints | List taints with kubectl get nodes -o custom-columns=NAME:.metadata.name,TAINTS:.spec.taints[*].key, then add a toleration or adjust the NodePool |
node(s) didn't match Pod's node affinity/selector | No node carries the nodeSelector/affinity label | Check kubectl get nodes --show-labels. With Karpenter, check well-known keys and values supplied by NodePool template labels or requirements |
pod has unbound immediate PersistentVolumeClaims | The PVC is Pending | → 7. PVC Pending |
node(s) had volume node affinity conflict | No schedulable node in the AZ where the PV (EBS) lives | Read the PV's nodeAffinity zone and provide capacity in that AZ |
node(s) didn't match pod topology spread constraints / pod anti-affinity rules | No node satisfies the spread constraint | Add suitable nodes. For topology spread, consider ScheduleAnyway only after reviewing availability goals; pod anti-affinity has separate required/preferred rules |
| No events at all | Scheduler problem, or a misspelled schedulerName | Check kubectl get pod <pod> -o jsonpath='{.spec.schedulerName}' |
2. ImagePullBackOff / ErrImagePull
Symptom: STATUS starts as ErrImagePull, then after a few retries becomes ImagePullBackOff. The kubelet's pull back-off grows up to a 5-minute cap.
Diagnosis:
kubectl describe pod <pod> -n <ns> | grep -A2 -E "Failed to pull|Back-off pulling"
kubectl get pod <pod> -n <ns> -o jsonpath='{range .spec.containers[*]}{.name}{"\t"}{.image}{"\n"}{end}'
kubectl get pod <pod> -n <ns> -o jsonpath='{.spec.imagePullSecrets}'
Warning Failed kubelet Failed to pull image "123456789012.dkr.ecr.ap-northeast-2.amazonaws.com/app:v1.2.3": ... not found
Warning Failed kubelet Error: ErrImagePull
Normal BackOff kubelet Back-off pulling image "123456789012.dkr.ecr.ap-northeast-2.amazonaws.com/app:v1.2.3"
Warning Failed kubelet Error: ImagePullBackOffA healthy pull leaves the pair Pulling image "..." → Successfully pulled image "..." in 4.501s ..., and an already-cached image logs Container image "..." already present on machine. A successful pull proves download succeeded; it does not exclude image contents, architecture, or entrypoint problems.
Causes and fixes:
What follows Failed to pull image | Cause | Fix |
|---|---|---|
not found / manifest unknown | Tag typo, tag not pushed yet, wrong repository | Verify with aws ecr describe-images --repository-name <repo> --image-ids imageTag=<tag> |
401 Unauthorized / no basic auth credentials | Private registry authentication failed | For ECR, the node IAM role needs AmazonEC2ContainerRegistryPullOnly (or ReadOnly); for external registries check imagePullSecrets |
| Pull from another ECR Region/account fails | A different address is not itself invalid; check cross-account policy and regional endpoint access | Add the pulling principal to the ECR repository policy |
dial tcp ... i/o timeout | Private subnet with no NAT/VPC endpoints | Check com.amazonaws.<region>.ecr.api, ecr.dkr, and the S3 gateway endpoint |
toomanyrequests | Docker Hub rate limit | Mirror through an ECR pull-through cache |
For node diagnosis, first inspect kubelet events/logs and the credential provider used for image pulls. crictl pull does not automatically reuse kubelet’s ECR credential provider or a Pod’s imagePullSecrets, so it does not reproduce the same authentication path. Fargate image pulls use the pod execution role, separately from the application’s IRSA role.
3. CrashLoopBackOff (exit 137 OOMKilled, probe failures, config errors)
Symptom: a container repeatedly exits and RESTARTS grows. The usual backoff doubles from 10 seconds up to 300 seconds, but feature gates and kubelet configuration can change it. Check the restart policy in Pod lifecycle.
Diagnosis: look at three things in order — termination reason and exit code, logs of the previous container, Events.
# (1) Why did it die: lastState.terminated
kubectl get pod <pod> -n <ns> -o jsonpath='{range .status.containerStatuses[*]}{.name}{"\t"}restarts={.restartCount}{"\t"}reason={.lastState.terminated.reason}{"\t"}exit={.lastState.terminated.exitCode}{"\n"}{end}'

# (2) Logs right before death (the previous container, not the current one)
kubectl logs <pod> -n <ns> -c <container> --previous --tail=100

# (3) Probe/kill events
kubectl describe pod <pod> -n <ns> | sed -n '/^Events:/,$p'
Output recorded in the original document for a container with a 128Mi memory limit:
    Last State:     Terminated
      Reason:       OOMKilled
      Exit Code:    137
      Started:      Mon, 31 Aug 2026 08:55:27 +0000
      Finished:     Tue, 01 Sep 2026 21:13:37 +0000
    Restart Count:  3
A roughly 36-hour lifetime distinguishes this from an immediate startup failure; it does not prove a memory leak. Also investigate traffic spikes, batch jobs, node OOM, and limit changes using memory time series and kernel/cgroup events.
Reading exit codes:
| Exit Code | Reason | Meaning | Fix |
|---|---|---|---|
0 | Completed | Process exited normally — in a Deployment this means the app is not staying in the foreground | Keep a long-running entrypoint in the foreground, or switch to a Job |
1 | Error | App exited on its own (config error, dependency connection failure) | The stack trace is in logs --previous |
126 | Error | Command found but not executable under a shell entrypoint — missing execute bit, or the shell reporting cannot execute binary file: Exec format error (architecture mismatch) | chmod +x in the Dockerfile; check arm64/amd64 with kubectl get nodes -L kubernetes.io/arch and use a multi-arch image |
127 | Error | Command not found under a shell entrypoint — path typo, or the binary was never copied into the final image stage | Compare command/args with what is actually in the image (kubectl debug ... -- ls <path>) |
137 | OOMKilled | OOM termination; distinguish a container limit from node memory pressure | Raise the limit or fix the leak. For the JVM check -XX:MaxRAMPercentage → Resource Optimization |
137 | Error | SIGKILL for another reason — liveness failed and the container did not exit within terminationGracePeriodSeconds | Review preStop/graceful shutdown |
143 | Error | Exited on SIGTERM (may be a normal rollout/eviction) | If it repeats, find who is killing it in Events |
- If the image execs the binary directly (no shell in between), an architecture mismatch does not produce exit 126 at all — the container never starts, and
lastState.terminatedshows ReasonStartErrorwithexec format errorin the message. The fix is the same: a multi-arch image, or a nodeSelector onkubernetes.io/arch.
Probe failures: these events show a restart triggered by liveness failure. Causes include wrong paths/ports, but also real application failure, overload, or deadlock. Inspect the response and application before relaxing the probe.
Warning  Unhealthy  kubelet  Liveness probe failed: HTTP probe failed with statuscode: 503
Normal Killing kubelet Container app failed liveness probe, will be restarted- If the app is slow to start, add a
startupProbeinstead of inflating livenessinitialDelaySeconds(liveness does not start until the startup probe succeeds). - A TCP refusal such as
Readiness probe failed: dial tcp 10.0.2.45:8080: connect: connection refusedmeans first check whether the container port and the probe port differ.
Configuration reference errors — strictly speaking not a crash loop; the pod stops at CreateContainerConfigError:
Warning  Failed  kubelet  Error: configmap "app-config" not found
Warning  Failed  kubelet  Error: secret "db-credentials" not found
Compare names and namespaces with kubectl get cm,secret -n <ns> and you are done. If the reference is a volume mount, it shows up instead as a FailedMount event (MountVolume.SetUp failed for volume "cfg" : configmap "app-config" not found).
4. Running but not Ready / empty Endpoints
Symptom: STATUS is Running but READY is 0/1 (1/2 with a sidecar). Ordinary Service routing excludes not-ready endpoints. Check exceptions such as publishNotReadyAddresses, terminating endpoints, and LB fail-open separately; clients may see errors or timeouts depending on the proxy.
Diagnosis:
kubectl describe pod <pod> -n <ns> | grep -E "Ready|Readiness probe"
kubectl get endpointslices -n <ns> -l kubernetes.io/service-name=<svc>
EndpointSlice addresses and readiness are separate. Matching not-ready pods can appear with an address and ready: false. Do not infer readiness from the ENDPOINTS column; inspect ready, serving, and terminating.
kubectl get endpointslices -n <ns> -l kubernetes.io/service-name=<svc> -o json | jq -r '
  .items[] as $slice | $slice.endpoints[]?
  | [$slice.metadata.name, (.addresses | join(",")), (.conditions | tojson)] | @tsv
'
An unset ready is unknown and must be interpreted as ready by consumers. publishNotReadyAddresses: true changes readiness filtering; proxies can also handle serving endpoints during termination. For Services without selectors, check manually managed EndpointSlices. The v1 Endpoints API is deprecated since Kubernetes 1.33; use EndpointSlice for new diagnostics.
Causes and fixes:
| Observation | Cause | Fix |
|---|---|---|
Repeated Readiness probe failed in Events | Wrong probe path/port, or the app is still waiting on a dependency (DB, etc.) | Point the probe at the app's real health endpoint. Keep dependency waits in readiness, out of liveness |
Condition Ready False with reason ReadinessGatesNotReady | Waiting on a pod readiness gate — typically the AWS Load Balancer Controller's target-health.elbv2.k8s.aws/* gate | Find out why the Target Group health check fails → AWS Load Balancer Controller |
1/2 Running, only the app container Ready | Sidecar (istio-proxy, etc.) not ready, or the sidecar started after the app and initial connections failed | Check sidecar logs; check injector/version-supported startup ordering and readiness; native-sidecar conversion alone does not fix readiness |
| Ready, yet the EndpointSlice is empty | Service selector does not match the pod labels | → 5. Service unreachable |
5. Service is unreachable
Symptom: containers show 1/1 Running, yet curl http://<svc>.<ns>.svc.cluster.local times out/refuses, or name resolution fails.
Split the diagnosis into three layers: (a) Service → pod mapping, (b) network policy, (c) DNS.
# (a) Compare the selector with actual labels
kubectl get svc <svc> -n <ns> -o jsonpath='{.spec.selector}{"\n"}{.spec.ports}{"\n"}'
kubectl get pods -n <ns> -l <key>=<value> -o wide
kubectl get endpointslices -n <ns> -l kubernetes.io/service-name=<svc>

# (b) NetworkPolicies applied to the namespace
kubectl get networkpolicies -n <ns>
kubectl describe networkpolicy <policy> -n <ns>

# (c) CoreDNS status and logs
kubectl get pods -n kube-system -l k8s-app=kube-dns
kubectl logs -n kube-system -l k8s-app=kube-dns --tail=50
kubectl get cm -n kube-system coredns -o jsonpath='{.data.Corefile}'
Causes and fixes:
| Observation | Cause | Fix |
|---|---|---|
Selector is {"app":"api"} but pods are labeled app=api-server | Label mismatch → empty EndpointSlice | Unify labels/selector. In Helm charts, selectorLabels and podLabels drifting apart is a common culprit |
EndpointSlice has IPs but connection refused | targetPort differs from the port the container actually listens on | Compare with kubectl get pod <pod> -n <ns> -o jsonpath='{.spec.containers[*].ports}'. An app bound only to 127.0.0.1 shows the same symptom |
| Fails only from a particular namespace | A default-deny NetworkPolicy exists and the ingress allow rule is missing | Check podSelector/namespaceSelector. With VPC CNI network policy, kubectl get policyendpoints -n <ns> shows what is actually enforced → Network Policies |
nslookup <svc> returns NXDOMAIN | Short name used from another namespace, or CoreDNS outage | Use the FQDN (<svc>.<ns>.svc.cluster.local). Confirm CoreDNS pods are Running and /etc/resolv.conf nameserver is the kube-dns ClusterIP (172.20.0.10 on this cluster) |
| External domain resolution is slow | With the default ndots:5, any name with fewer than 5 dots is first tried against every search domain (<ns>.svc.cluster.local, svc.cluster.local, cluster.local, the node's VPC domain) before being queried as an absolute name | Append a trailing . to external names, or review a dnsConfig.options entry with name ndots and string value "2" |
| NodePort/LB works only through some nodes | externalTrafficPolicy: Local with no pod on that node | Intended behavior. Consider Cluster only after reviewing client-IP preservation and cross-node traffic |
To reproduce DNS from a pod's point of view, start a throwaway pod: kubectl run -it --rm dns-test --image=busybox:1.36 --restart=Never -- nslookup kubernetes.default.svc.cluster.local. CoreDNS concepts and the Corefile are covered in Services and Networking.
Check both destination ingress and source egress NetworkPolicies. Declaring containerPort does not create a listening socket; inspect app logs or socket state. With NodeLocal DNSCache, resolv.conf can correctly use a nameserver other than the kube-dns ClusterIP.
Auto Mode DNS: Current Auto Mode runs CoreDNS as a node system service. Missing kube-dns Pods/Service alone does not indicate failure on pure Auto Mode. Mixed clusters need the CoreDNS Deployment for ordinary nodes. The Pod/ConfigMap commands above inspect Deployment-based DNS; for Auto Mode, check actual pod resolution, node DNS logs, and upstream resolver reachability.
6. Node NotReady / kubelet pressure (DiskPressure, MemoryPressure, PIDPressure)
Symptom: kubectl get nodes shows NotReady, or the node is Ready but pods get Evicted or new pods avoid it with node(s) had untolerated taint(s).
Diagnosis:
# One-line summary of node conditions
kubectl get nodes -o custom-columns='NAME:.metadata.name,READY:.status.conditions[?(@.type=="Ready")].status,MEM:.status.conditions[?(@.type=="MemoryPressure")].status,DISK:.status.conditions[?(@.type=="DiskPressure")].status,PID:.status.conditions[?(@.type=="PIDPressure")].status'

# Conditions with their reason
kubectl get node <node> -o jsonpath='{range .status.conditions[*]}{.type}{"="}{.status}{" ("}{.reason}{")\n"}{end}'

# Taints the node picked up automatically
kubectl get node <node> -o jsonpath='{.spec.taints}'
Healthy node output (with the EKS Node Monitoring Agent installed you also see the ContainerRuntimeReady/NetworkingReady/KernelReady/StorageReady conditions):
MemoryPressure=False (KubeletHasSufficientMemory)
DiskPressure=False (KubeletHasNoDiskPressure)
PIDPressure=False (KubeletHasSufficientPID)
Ready=True (KubeletReady)
ContainerRuntimeReady=True (ContainerRuntimeIsReady)
NetworkingReady=True (NetworkingIsReady)
KernelReady=True (KernelIsReady)
StorageReady=True (DiskIsReady)
Causes and fixes:
| Condition / reason | Automatic taint | Cause | Fix |
|---|---|---|---|
Ready=Unknown (NodeStatusUnknown, "Kubelet stopped posting node status.") | node.kubernetes.io/unreachable | kubelet process died, instance stopped/network partition, API server auth failure | Check the EC2 instance state → use supported log access if the node responds; a dead kubelet may not start a debug Pod |
Ready=False | node.kubernetes.io/not-ready | Container runtime down, CNI not initialized (aws-node unhealthy) | kubectl get pods -n kube-system -l k8s-app=aws-node -o wide for that node's aws-node |
DiskPressure=True (KubeletHasDiskPressure) | node.kubernetes.io/disk-pressure | Image cache/container logs filled the root volume | crictl rmi --prune, log rotation, grow the root EBS. Pods are Evicted with The node was low on resource: ephemeral-storage |
MemoryPressure=True (KubeletHasInsufficientMemory) | node.kubernetes.io/memory-pressure | Actual usage exceeds reservations, or system reservation is insufficient; a limit without a request can default the request to that limit | Enforce requests (LimitRange), check kube-reserved/system-reserved |
PIDPressure=True (KubeletHasInsufficientPID) | node.kubernetes.io/pid-pressure | Fork storm (thread leak) | Find and restart the offending pod, set podPidsLimit |
The following creates a privileged debug Pod and assumes a conventional Linux worker with a host shell, journalctl, and crictl. Do not assume the same chroot procedure works on immutable Bottlerocket/EKS Auto Mode hosts. Use the debug-container and console-log procedures in Auto Mode troubleshooting.
kubectl debug node/<node> -it --image=busybox --profile=sysadmin -- chroot /host
# once inside
journalctl -u kubelet --since "10 min ago" | tail -50
df -h /var/lib/containerd
crictl ps -a | head
A node that never appears in kubectl get nodes (join failure: IAM role/access entry, subnet routing, security group, AMI mismatch) is a separate topic → EKS Advanced Debugging — Node Join Failure Diagnosis, EKS Troubleshooting — Node and Pod Issues. For Karpenter nodes, start with the NodeClaim check in section 10.
7. PVC stuck in Pending
Symptom: kubectl get pvc shows Pending, and the pod using it is Pending with pod has unbound immediate PersistentVolumeClaims.
Diagnosis:
kubectl get pvc -n <ns>
kubectl describe pvc <pvc> -n <ns> | sed -n '/^Events:/,$p'
kubectl get storageclass
kubectl get pods -n kube-system -l app=ebs-csi-node -o wide     # is the CSI node plugin on that node?
NAME PROVISIONER RECLAIMPOLICY VOLUMEBINDINGMODE ALLOWVOLUMEEXPANSION AGE
gp2 kubernetes.io/aws-ebs Delete WaitForFirstConsumer false 145d
gp3 ebs.csi.aws.com Delete WaitForFirstConsumer true 76dThe StorageClass list is an environment example. Distinguish Auto Mode’s ebs.csi.eks.amazonaws.com from the separately installed ebs.csi.aws.com driver. Absence of an ordinary ebs-csi-node DaemonSet on Auto Mode is not by itself a failure. An explicit storageClassName: "" opts out of the default class; it differs from omitting the field.
Causes and fixes: the Events message in describe pvc is the diagnosis.
| Events message | Cause | Fix |
|---|---|---|
WaitForFirstConsumer: waiting for first consumer to be created before binding | Normal. volumeBindingMode: WaitForFirstConsumer defers volume creation until a pod is scheduled | If it is Pending because no pod uses it yet, leave it. If the pod is also Pending, read the pod's FailedScheduling |
FailedBinding: no persistent volumes available for this claim and no storage class is set | No storageClassName and no default StorageClass | Set storageClassName: gp3 on the PVC, or annotate an SC with storageclass.kubernetes.io/is-default-class: "true" |
ProvisioningFailed: storageclass.storage.k8s.io "<name>" not found | Misspelled StorageClass, manifest copied from another cluster | Use the real name from kubectl get sc |
ProvisioningFailed: error generating accessibility requirements: no topology key found for node <node> | The EBS CSI node plugin has not registered on the node the pod landed on (no driver in CSINode) | Check the DRIVERS column of kubectl get csinode <node>; confirm the ebs-csi-node DaemonSet is running on that node |
ProvisioningFailed + UnauthorizedOperation/AccessDenied | The EBS CSI controller's IRSA/Pod Identity lacks permission | → 8. IRSA/Pod Identity — the subject is ebs-csi-controller-sa |
Pod-side node(s) had volume node affinity conflict | The existing PV (EBS) is in AZ ap-northeast-2a but schedulable nodes are in another AZ | EBS cannot cross AZs. Read the zone with kubectl get pv <pv> -o jsonpath='{.spec.nodeAffinity}' and provide capacity there (NodePool zone requirement or nodeSelector) |
Pod-side FailedAttachVolume: Multi-Attach error for volume | An RWO volume is still attached to the previous node (StatefulSet rescheduled after node failure) | Check stale attachments with kubectl get volumeattachments. If the node is gone, wait a few minutes for cleanup |
WaitForFirstConsumer, StorageClass and dynamic provisioning concepts are in Storage; EBS/EFS CSI error patterns are in EKS Advanced Debugging — Storage Troubleshooting.
8. EKS: IRSA / Pod Identity AccessDenied
Symptom: the pod is happily Running, but the app logs an AWS SDK error.
An error occurred (AccessDenied) when calling the AssumeRoleWithWebIdentity operation:
  Not authorized to perform sts:AssumeRoleWithWebIdentity
Or the S3/DynamoDB call itself is denied with ... is not authorized to perform: s3:GetObject, where the denied principal is not the service account role but the node IAM role (assumed-role/<node-role>/i-0abc...). This indicates that the SDK selected node credentials. Check injection, SDK version, provider precedence, and explicit credentials; node-role fallback is unavailable when IMDS access is blocked.
Diagnosis — first determine which mechanism is in use. The pod's environment variables tell you.
# Service account annotation (IRSA)
kubectl get sa <sa> -n <ns> -o jsonpath='{.metadata.annotations.eks\.amazonaws\.com/role-arn}{"\n"}'

# Credential-related env injected into the pod
kubectl get pod <pod> -n <ns> -o json | jq -r '
  (.spec.initContainers[]?, .spec.containers[]?) as $container
  | $container.env[]?
  | select(.name == "AWS_ROLE_ARN" or .name == "AWS_WEB_IDENTITY_TOKEN_FILE"
        or .name == "AWS_CONTAINER_CREDENTIALS_FULL_URI"
        or .name == "AWS_CONTAINER_AUTHORIZATION_TOKEN_FILE")
  | [$container.name, .name, (.value // "valueFrom")] | @tsv
'| Injected env | Mechanism | Meaning |
|---|---|---|
AWS_ROLE_ARN=arn:aws:iam::...:role/<role> + AWS_WEB_IDENTITY_TOKEN_FILE=/var/run/secrets/eks.amazonaws.com/serviceaccount/token | IRSA | Injected by pod-identity-webhook. If absent, the SA annotation was added after the pod was created, or the SA name differs |
AWS_CONTAINER_CREDENTIALS_FULL_URI + AWS_CONTAINER_AUTHORIZATION_TOKEN_FILE | EKS Pod Identity | eks-pod-identity-agent serves credentials at 169.254.170.23. Injected only when an association exists |
| Neither | Other provider or no credentials | See the table below |
# Pod Identity: agent and association
kubectl get pods -n kube-system -l app.kubernetes.io/name=eks-pod-identity-agent
aws eks list-pod-identity-associations --cluster-name <cluster> --namespace <ns> --service-account <sa>

# IRSA: OIDC condition in the trust policy
aws eks describe-cluster --name <cluster> --query 'cluster.identity.oidc.issuer' --output text
aws iam get-role --role-name <role> --query 'Role.AssumeRolePolicyDocument'
Causes and fixes:
| Observation | Cause | Fix |
|---|---|---|
| No env, but the SA annotation exists | Creation order, actual serviceAccountName, or webhook injection configuration | Verify/fix configuration, then recreate pods in the correct namespace with rollout impact considered |
| No env and no association | Pod Identity association not created, or created for a different SA/namespace | aws eks create-pod-identity-association ..., then restart the pods |
Not authorized to perform sts:AssumeRoleWithWebIdentity | IRSA trust policy: wrong Federated OIDC provider ARN, or the sub (system:serviceaccount:<ns>:<sa>)/aud (sts.amazonaws.com) condition does not match | Fix the trust policy. If the cluster was recreated the OIDC issuer changed, so the provider must be recreated too |
Pod Identity, but AssumeRole denied | Trust policy principal is not pods.eks.amazonaws.com, or sts:TagSession is missing | Allow both sts:AssumeRole and sts:TagSession in the trust policy |
Env is fine, only a specific API is AccessDenied | Denial from identity/resource policies, SCPs, boundaries, session or VPC endpoint policies | Check caller/resource and explicit Deny; relevant CloudTrail data events may require logging configuration |
Pod Identity env present but the SDK says Unable to locate credentials | SDK too old to support the container credential provider (FULL_URI) | Upgrade the SDK — minimum supported versions are listed in the EKS docs |
How IRSA and Pod Identity work and how to set them up is in EKS Security Best Practices and EKS Security; token expiry and webhook issues are in EKS Advanced Debugging — Control Plane Debugging.
9. EKS: ENI/VPC CNI IP exhaustion
Symptom: pods stall in ContainerCreating with FailedCreatePodSandBox in Events:
Warning  FailedCreatePodSandBox  kubelet  Failed to create pod sandbox: rpc error: code = Unknown desc =
  failed to setup network for sandbox "...": plugin type="aws-cni" name="aws-cni" failed (add):
  add cmd: failed to assign an IP address to container
At scheduling time, Too many pods means the kubelet pod-count limit was reached. It can relate to IP capacity but is not proof of IP exhaustion. CNI FailedCreatePodSandBox occurs after node assignment.
Diagnosis:
# Read the actual pod ceiling; distinguish secondary-IP defaults from prefix/custom networking configuration
kubectl get node <node> -o jsonpath='{.status.allocatable.pods}{"\n"}'
kubectl get pods -A --field-selector spec.nodeName=<node>,status.phase!=Succeeded,status.phase!=Failed --no-headers | wc -l

# aws-node status and IPAM settings
kubectl get pods -n kube-system -l k8s-app=aws-node -o wide
kubectl get ds -n kube-system aws-node -o jsonpath='{range .spec.template.spec.containers[?(@.name=="aws-node")].env[*]}{.name}={.value}{"\n"}{end}' | grep -E "PREFIX|WARM|MINIMUM|CUSTOM_NETWORK"

# Free IPs in the subnet
aws ec2 describe-subnets --subnet-ids <subnet-id> --query 'Subnets[].{id:SubnetId,az:AvailabilityZone,free:AvailableIpAddressCount}' --output table
In IPv4 secondary-IP mode, WARM_ENI_TARGET=1 is the default target for spare ENI capacity. Each ENI also consumes a primary IP: an m5.xlarge has 15 IPv4 addresses per ENI, of which 14 are secondary addresses for ordinary pods. Positive WARM_IP_TARGET/MINIMUM_IP_TARGET values override the warm-ENI rule. With warm=3 and minimum=6, one used IP can require six total and five spare; five used IPs target eight total and three spare. Spare capacity is not always exactly three. IPAM reconciliation, ENI limits, and prefix allocation granularity affect actual counts.
Causes and fixes:
| Observation | Cause | Fix |
|---|---|---|
Subnet AvailableIpAddressCount in single digits | The subnet itself is exhausted; the warm pool pre-claims IPs | Shrink the warm pool with WARM_IP_TARGET/MINIMUM_IP_TARGET (as in the settings above), add a secondary CIDR (e.g. 100.64.0.0/16) with custom networking (ENIConfig), and IPv6 in the long run |
| Pods on node = allocatable pods | Configured pod-count ceiling; check IP capacity separately | Prefix delegation after validating support and subnet capacity (ENABLE_PREFIX_DELEGATION=true, allocates /28 prefixes, requires supported instances and contiguous /28 blocks) plus max-pods recalculation, or a larger instance |
aws-node in CrashLoopBackOff on that node | CNI failure itself (missing AmazonEKS_CNI_Policy, version mismatch) | kubectl logs -n kube-system <aws-node-pod> -c aws-node, and /var/log/aws-routed-eni/ipamd.log on the node |
Using Security Groups for Pods and short of vpc.amazonaws.com/pod-eni | Branch ENI limit | Move to instances that support trunk ENIs; confirm ENABLE_POD_ENI=true |
IPAM behavior (warm pool, prefix delegation, custom networking) is in VPC CNI — IP Address Management; step-by-step IP exhaustion handling is in EKS Advanced Debugging — Networking Diagnostics and EKS Troubleshooting — VPC CNI Issues.
10. EKS: Karpenter does not launch a node
Symptom: pods are Pending and no new NodeClaim appears in kubectl get nodeclaims. Separately from the default scheduler's FailedScheduling, Karpenter records its own reasons as events on the same pod.
Diagnosis:
# Events emitted by Karpenter (source is karpenter)
kubectl get events -n <ns> --field-selector involvedObject.name=<pod> -o custom-columns=REASON:.reason,SRC:.source.component,MSG:.message

# NodePool limits vs current usage
kubectl get nodepool -o custom-columns='NAME:.metadata.name,CPU_LIMIT:.spec.limits.cpu,CPU_USED:.status.resources.cpu,MEM_LIMIT:.spec.limits.memory,MEM_USED:.status.resources.memory,READY:.status.conditions[?(@.type=="Ready")].status'

# NodeClaim progress
kubectl get nodeclaims -o custom-columns='NAME:.metadata.name,TYPE:.metadata.labels.node\.kubernetes\.io/instance-type,LAUNCHED:.status.conditions[?(@.type=="Launched")].status,REGISTERED:.status.conditions[?(@.type=="Registered")].status,READY:.status.conditions[?(@.type=="Ready")].status'

kubectl logs -n kube-system -l app.kubernetes.io/name=karpenter --tail=100
A Karpenter event recorded in the original document, listing rejected NodePools:
FailedScheduling  karpenter  Failed to schedule pod, incompatible with nodepool "system",
  daemonset overhead={"cpu":"821m","memory":"1350Mi","pods":"10"}, incompatible requirements,
  label "nvidia.com/device-plugin.config" does not have known values;
  incompatible with nodepool "runner-arm", ..., did not tolerate workload-type=ci-runner:NoSchedule;
  all available instance types exceed limits for nodepool "graviton";
  incompatible with nodepool "gpu-ner", ..., incompatible requirements, key node.kubernetes.io/instance-type,
  node.kubernetes.io/instance-type In [g6e.4xlarge] not in node.kubernetes.io/instance-type In [g6.2xlarge g6.4xlarge g6.xlarge]
The recorded example has CPU_LIMIT 8 / CPU_USED 8, but exceed limits does not require current usage to equal the limit. It also occurs below the limit when every candidate instance exceeds remaining headroom. Nominated is a scheduling nomination, not completion; verify NodeClaim Launched, Registered, Initialized, Ready and actual Pod assignment.
Causes and fixes:
| Message fragment | Cause | Fix |
|---|---|---|
all available instance types exceed limits for nodepool "<np>" | Adding any candidate instance would exceed NodePool limits | Raise the limit, or check whether consolidation is reclaiming idle nodes |
label "<key>" does not have known values | The requested custom label has no values supplied by NodePool template labels/requirements | Add the key (with its value list) to spec.template.spec.requirements of the NodePool |
did not tolerate <key>=<value>:NoSchedule | No toleration for the NodePool taints | If the isolation is intentional, use another NodePool; otherwise add the toleration |
key node.kubernetes.io/instance-type, ... In [X] not in ... In [Y Z] | The pod demands an instance type the NodePool does not allow | Align one side. Usually the pod-side requirement is too narrow |
Large daemonset overhead={...} and Insufficient | Not enough capacity left after subtracting DaemonSet reservations | Include larger instances in the requirements |
NodeClaim LAUNCHED=True, REGISTERED=False for several minutes | EC2 started but the node cannot join (EC2NodeClass subnet/SG selectors, node IAM role access entry, AMI) | Conditions/Events in kubectl describe nodeclaim <name>, EC2 console system log |
InsufficientInstanceCapacity in Karpenter logs | No EC2 capacity for that AZ/instance type (ICE — Insufficient Capacity Error) | Widen instance types, AZs, and capacity-type (spot/on-demand) |
| No events, Karpenter logs quiet | The pod is not a Karpenter candidate (nodeSelector points at MNG labels, or scheduling constraints unrelated to Karpenter) | Re-check every node-related constraint in the pod spec |
NodePool/EC2NodeClass structure and detailed troubleshooting are in Karpenter — Troubleshooting and EKS Advanced Debugging — Karpenter Provisioning Issues.
11. No Service can be created: failed calling webhook
Symptom: any kubectl apply/create of a Service — in any namespace, including ones that have nothing to do with load balancers — is rejected by the API server. Deployments that ship a Service, Helm installs, and ArgoCD syncs stall right there, while existing Services keep working, so nothing looks wrong at the pod level.
Internal error occurred: failed calling webhook "mservice.elbv2.k8s.aws": failed to call webhook:
... no endpoints available for service "aws-load-balancer-webhook-service"Diagnosis: the message already names the webhook and the Service behind it. Walk down from the webhook configuration → the webhook Service's endpoints → the Deployment behind them.
# (1) Which webhooks are registered, and what each does on failure (rules, namespaceSelector, objectSelector, failurePolicy)
kubectl get mutatingwebhookconfigurations,validatingwebhookconfigurations
kubectl get mutatingwebhookconfiguration aws-load-balancer-webhook -o jsonpath='{range .webhooks[*]}{.name}{"\t"}failurePolicy={.failurePolicy}{"\t"}ns={.namespaceSelector}{"\t"}obj={.objectSelector}{"\t"}{.rules[*].operations}{" "}{.rules[*].resources}{"\n"}{end}'

# (2) Is there a Ready pod behind the webhook Service?
kubectl -n kube-system get endpointslices -l kubernetes.io/service-name=aws-load-balancer-webhook-service

# (3) Why does that Deployment keep dying?
kubectl -n kube-system get pods -l app.kubernetes.io/name=aws-load-balancer-controller
kubectl -n kube-system logs deploy/aws-load-balancer-controller --previous
The original document records repeated LBC v3.2.1 restarts and the following logs on September 2, 2026. This review did not independently verify the historical restart count or duration, so they are not presented as a reproduced result. The actionable evidence is a mismatch between installed CRDs and the API version requested by the controller.
{"ts":"2026-09-02T07:54:42Z","logger":"setup","msg":"Disabling NLBGatewayAPI: missing required Gateway API CRDs","missing":["TLSRoute","TCPRoute","UDPRoute"]}
{"level":"error","logger":"controller-runtime.source.Kind","msg":"if kind is a CRD, it should be installed before calling Start","kind":"ListenerSet.gateway.networking.k8s.io","error":"no matches for kind \"ListenerSet\" in version \"gateway.networking.k8s.io/v1\""}
{"ts":"2026-09-02T07:57:00Z","level":"error","logger":"setup","msg":"problem running manager","error":"failed to wait for gateway.k8s.aws/alb caches to sync kind source: *v1.ListenerSet: timed out waiting for cache to be synced for Kind *v1.ListenerSet"}
These logs show cache synchronization failing because ListenerSet.gateway.networking.k8s.io/v1 cannot be found. Gateway API 1.5.0 includes ListenerSet in the standard channel. Check version requirements, standard CRDs, and LBC-specific CRDs in the LBC v3.2.1 guide. Review experimental installation requirements when additional APIs such as TCPRoute/UDPRoute are needed. Impact depends on the actual webhook rules, selectors, and failurePolicy. Existing LB data paths can continue while target updates and new-resource reconciliation are impaired.
Causes and fixes:
| Observation | Cause | Fix |
|---|---|---|
no endpoints available for service "aws-load-balancer-webhook-service" | Zero Ready pods in the webhook Deployment (CrashLoop, unschedulable, replicas 0) | Make the controller healthy first (next row). Confirm addresses and ready conditions in EndpointSlice and test an actual webhook request |
no matches for kind "ListenerSet" → timed out waiting for cache to be synced in the logs | The Gateway API CRDs this controller version requires are not installed | (a) Install the Gateway API CRDs that controller version requires — ListenerSet is in the standard channel in Gateway API 1.5.0, (b) until the CRDs are present, disable the controller's Gateway API feature via its Helm feature-gate values (check the exact gate names in that version's values.yaml), (c) pin a controller version that matches the installed CRDs |
Endpoints exist, but connection refused / context deadline exceeded / x509 | Path to the webhook port blocked (NetworkPolicy/security group), certificate expired or mismatched | Check the API server → pod webhook-port path, clientConfig.caBundle, and certificate renewal |
| You must create a Service right now | — | Only as a conscious emergency measure with the blast radius understood: patch the failurePolicy of mservice.elbv2.k8s.aws to Ignore. Services created meanwhile do NOT get the controller's mutation (the default loadBalancerClass is not injected), so after recovery revert to Fail and review the Services created in between |
What not to do: label a Service with app.kubernetes.io/name=aws-load-balancer-controller to dodge the objectSelector. It passes the webhook, but that Service misses the mutation and the label now lies. That selector exists only so the controller's own Service can be created.
If you decide to disable unused Gateway API features temporarily, merge these v3.2.1 chart values with the existing configuration and review the Helm diff. First check whether existing Gateway resources depend on these controllers.
controllerConfig:
  featureGates:
    ALBGatewayAPI: false
NLBGatewayAPI: falsePrevention: alert on available replicas and CrashLoop state for the webhook Deployment. For example, configure an alert with a five-minute hold for the following kube-state-metrics expression.
kube_deployment_status_replicas_available{
  namespace="kube-system", deployment="aws-load-balancer-controller"
} < 1
If metrics are absent, this expression also returns no series; add separate absent_over_time(...[5m]) or scrape-failure monitoring. Deployment availability does not prove Service selectors, certificates, or network paths are correct: inspect EndpointSlice conditions and the webhook path too. Spreading replicas across AZs with a PDB helps with node failures, but not a configuration error shared by every replica.
The original Pod Network Benchmark describes its exclusion of ClusterIP measurements. That remains a limitation of the recorded benchmark; this review did not reproduce the incident.
kubectl Diagnostic Cheat Sheet
Separate inspection from debug actions: get/describe/logs/top inspect resources; kubectl debug and kubectl run create containers or Pods. Ensure copied debug Pod labels do not accidentally match a Service selector, and remove debug Pods after use. Ephemeral containers remain recorded on the original Pod.
# ── Status scan ────────────────────────────────────────────────────────
# Unhealthy pods only
kubectl get pods -A -o json | jq -r '
  .items[]
  | select(.status.phase != "Succeeded")
  | select(.status.phase != "Running" or
      ([.status.conditions[]? | select(.type == "Ready" and .status == "True")] | length == 0))
  | [.metadata.namespace, .metadata.name, .status.phase,
     ([.status.initContainerStatuses[]?, .status.containerStatuses[]?
       | .state.waiting.reason // empty] | join(","))] | @tsv
'
# Restart counts ascending, so the 15 worst pods come LAST (after tail) + last termination reason.
# Reads the first container only ([0]); for multi-container pods check the others separately.
kubectl get pods -A --sort-by='.status.containerStatuses[0].restartCount' \
  -o custom-columns='NS:.metadata.namespace,NAME:.metadata.name,RESTARTS:.status.containerStatuses[0].restartCount,REASON:.status.containerStatuses[0].lastState.terminated.reason' | tail -15
# Pods on a given node
kubectl get pods -A --field-selector spec.nodeName=<node> -o wide
# Node conditions + zone + instance type
kubectl get nodes -o custom-columns='NAME:.metadata.name,READY:.status.conditions[?(@.type=="Ready")].status,DISK:.status.conditions[?(@.type=="DiskPressure")].status,MEM:.status.conditions[?(@.type=="MemoryPressure")].status,ZONE:.metadata.labels.topology\.kubernetes\.io/zone,TYPE:.metadata.labels.node\.kubernetes\.io/instance-type'

# ── Events ─────────────────────────────────────────────────────────────
kubectl get events -A --field-selector type=Warning --sort-by=.lastTimestamp | tail -30
kubectl get events -n <ns> --field-selector involvedObject.name=<pod>,reason=FailedScheduling
kubectl events -n <ns> --for pod/<pod> --watch          # follow one object live
kubectl events -A --types=Warning                       # kubectl events subcommand (1.26+)

# ── jsonpath for exactly the fields you need ──────────────────────────
kubectl get pod <pod> -o jsonpath='{.status.containerStatuses[*].lastState.terminated}'
kubectl get pod <pod> -o jsonpath='{range .spec.containers[*]}{.name}{": "}{.resources}{"\n"}{end}'
kubectl get svc <svc> -o jsonpath='{.spec.selector}'
kubectl get sa <sa> -o jsonpath='{.metadata.annotations.eks\.amazonaws\.com/role-arn}'
kubectl get pv <pv> -o jsonpath='{.spec.nodeAffinity.required.nodeSelectorTerms[0].matchExpressions}'

# ── Logs ───────────────────────────────────────────────────────────────
kubectl logs <pod> -c <container> --previous --tail=100   # logs of the dead container
kubectl logs -n kube-system -l k8s-app=kube-dns --tail=50  # several pods by label
kubectl logs deploy/<name> --all-containers --since=10m

# ── Debug containers ───────────────────────────────────────────────────
# Attach an ephemeral container (target process namespace requires runtime support)
kubectl debug -it <pod> --image=nicolaka/netshoot --target=<container>
# Copy with an approved shell-capable debug-image; review copied labels and volume access
kubectl debug <pod> -it --copy-to=<pod>-debug --container=<container> --set-image=<container>=<debug-image> -- sh
# Node shell without SSH. --profile=sysadmin is a privileged container
kubectl debug node/<node> -it --image=busybox --profile=sysadmin -- chroot /host

# ── Resource usage (requires metrics-server) ───────────────────────────
kubectl top nodes
kubectl top pods -n <ns> --sort-by=memory
# Without metrics-server: "error: Metrics API not available"

# ── Schema lookup ──────────────────────────────────────────────────────
kubectl explain pod.status.containerStatuses.lastState.terminated
kubectl explain nodepool.spec.limits        # works for CRDs too
kubectl api-resources | grep -E "karpenter|k8s.aws"

# ── Rollouts ───────────────────────────────────────────────────────────
kubectl rollout status deploy/<name> -n <ns>
kubectl rollout history deploy/<name> -n <ns>
Valid --profile values for kubectl debug are legacy, general, baseline, restricted, netadmin, and sysadmin (the default is legacy or general depending on your kubectl version — check kubectl debug --help); under a restricted policy, use a compatible image/security context with --profile=restricted; other admission policies can still reject it. Privileged node debugging requires separate authorization.
Going Deeper: Related Documents
This playbook is the front door that decides "where to go next." Once the cause is narrowed down, move to the documents below.
References
Official documentation behind the quoted strings and the rules of thumb in this page.
Kubernetes
- Taints and Tolerations — the
node.kubernetes.io/*taints the node controller adds automatically (section 6) - Debugging Kubernetes Nodes with kubectl and the
kubectl debugreference — node debug pods and--profilevalues (sections 2, 6, cheat sheet) - Debug Running Pods — ephemeral containers,
--copy-to,--target(cheat sheet) - EndpointSlices — why
v1 Endpointsis deprecated since 1.33 (section 4) - Debug Services and Debugging DNS Resolution — selector/port/DNS checks and
ndots(section 5)
Amazon EKS / AWS
- Amazon VPC CNI plugin README —
WARM_ENI_TARGET,WARM_IP_TARGET,MINIMUM_IP_TARGET,ENABLE_PREFIX_DELEGATIONsemantics and precedence (section 9) - Assign more IP addresses to Amazon EKS nodes with prefixes — prefix delegation and max-pods recalculation (section 9)
- EKS Pod Identity and IAM roles for service accounts — trust policy shapes and injected environment variables (section 8)
- Detect node health issues and enable automatic node repair — the Node Monitoring Agent conditions shown in section 6
- Troubleshoot problems with Amazon EKS clusters and nodes — node join failures,
AccessDenied, CNI errors - Karpenter — Troubleshooting — NodePool limits, requirement mismatches, NodeClaim launch/registration failures (section 10)