Topology
The default /topology view explores configured request paths (Route53 → CloudFront → Load Balancer → Target Group → target). Service + network opens /topology?view=e2e, combining saved service snapshots with Network Flow Monitor (NFM) observations.
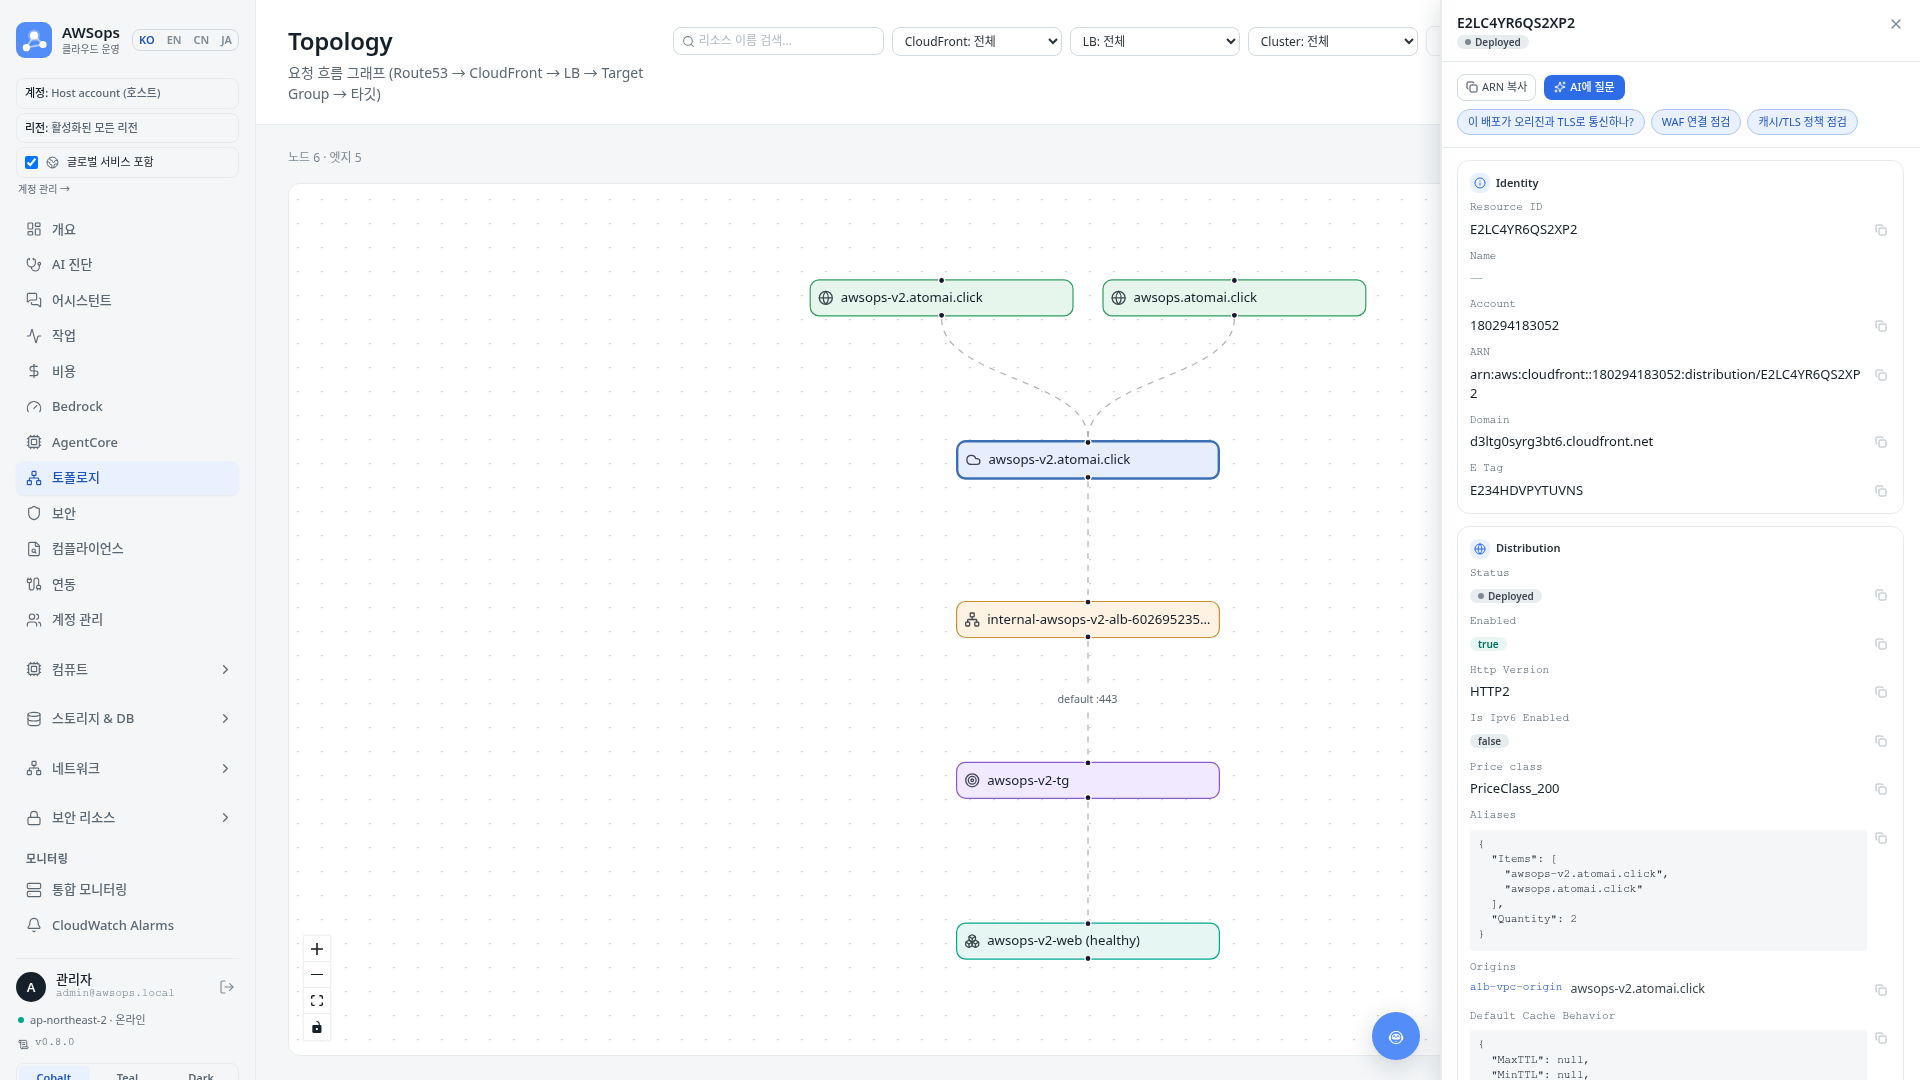
Service + network
The new controls currently retain Korean labels in every locale: 서비스 + 네트워크 (Service + network), 네트워크 조회 (Query network), 목적지 분류 (Destination category), 주요 흐름 확대 (Focus main flow), and 구성 흐름으로 돌아가기 (Back to configuration). The descriptions below explain those controls.
- Choose Service + network, also linked from the existing Network Flow and service-map pages.
- Select an active Monitor, Metric (transferred data, RTT, retransmissions or timeouts), Destination category, and Query range (15 minutes, 30 minutes or 1 hour), then click Query network. Opening the page or changing filters does not query NFM. All categories queries seven categories with at most three requests running concurrently.
- Search for a service, Pod, IP or resource and select a connection. Its details show the aggregate measurement and unit, local/remote addresses, port, SNAT/DNAT, observation window, traversed constructs and identity evidence.
- Use Configuration / Service observations / Network observations / Identity links / Traversed constructs to filter evidence. Search follows these filters, and changing them clears the previous detail selection. Switch between Focus main flow and Overview to adjust the viewport.
Collection status and display limits
- Configuration, service and NFM fetch outcomes are independent. Inventory read failures are distinct from HTTP 200 responses reporting failed, partial or running collection; stored rows remain usable. Per-type last-success times apply only to
self. Member, all-account and multiple-account scopes ignore the host run and show unknown collection health. - Configuration timing is the 표시된 행 수집 범위 (capture range of returned rows), not the newest type's completion time. Missing row timestamps are disclosed. 조회 시각 is when the browser read the inventory.
- The current private
/api/graph?class=tracereturns only a saved snapshot and produces no collection-status metadata. The integrated view's 수집 상태 미확인 (Collection state unknown) is neutral, not a failure alert. The existing service map omits the collection-status UI when metadata is absent. A saved timestamp does not establish collection success or complete coverage. - Partial/stale/retained states and per-source failure reasons are defensive compatibility for producers that actually supply that metadata; they are not live collection diagnostics from the current private API.
- Failed NFM categories cannot establish whether traffic exists. Successful samples remain visible alongside failures, caps and actual observation windows. Cached results retain their original windows; refresh does not bypass the cache.
- The default display limit is 350 nodes / 700 relations. Network connections and endpoints, services and identity neighborhoods take priority so large inventories cannot hide observations. Omission counts are shown; search and focus run before the display limit.
Observation integration requires only the host account self selected. Member, all-account and multiple-account selections show configuration only. NFM uses the host's default region independently of the inventory region filter. Account/scope changes discard previous results.
Configuration does not prove traffic. Service snapshots and NFM may cover different times. IP/instance identity requires region/VPC scope; workload identity uses cluster, namespace and Pod. Conflicting identities stay unlinked. Correlation does not establish one traced request, causality or an E2E total. Traversed constructs are not an ordered packet path, and an empty sample does not prove the absence of traffic.
Features
Request-flow graph
- Visualizes the traffic path Route53 → CloudFront → Load Balancer → Target Group → target as nodes and edges.
- Nodes are distinguished by per-kind color and icon; target nodes change color by their health state (healthy / unhealthy / draining, etc.). The info line above the graph shows color legend chips for the kinds/health states present in the current graph.
- The header above the graph shows the current node count and edge count, plus the capture-time range of returned inventory rows.
- Use the MiniMap at the bottom-right and the Controls at the bottom-left to pan and zoom freely.
Entry-point filter
- Pick a specific distribution from the top CloudFront selector to narrow the graph to just the paths starting from that entry point.
- The LB selector does the same for a specific Load Balancer.
- Leave either selector at All to show the entire graph.
- The Cluster filter narrows EKS/ECS targets and their upstream configuration paths; it also supports links such as
/topology?cluster=eks%3Acluster-name.
Resource search
- Type part of a resource name in the top search box to see an autocomplete list.
- Selecting an item focuses that node directly. Enter selects the first match.
Focus mode + detail panel
- Clicking a node enters focus mode, which keeps only the connected upstream/downstream path and re-centers it on screen.
- At the same time, the right detail panel opens and shows the resource's fields. VPC / subnet / security group IDs are shown alongside human-readable names.
- In the panel, use the Copy ARN button to copy the resource identifier, and the Ask AI button to send the resource straight to the AI assistant.
- Suggested question chips tailored to the resource kind are provided, and resources with a network placement also show a relationship graph link.
- Click empty space to clear the selection and return to the full graph.
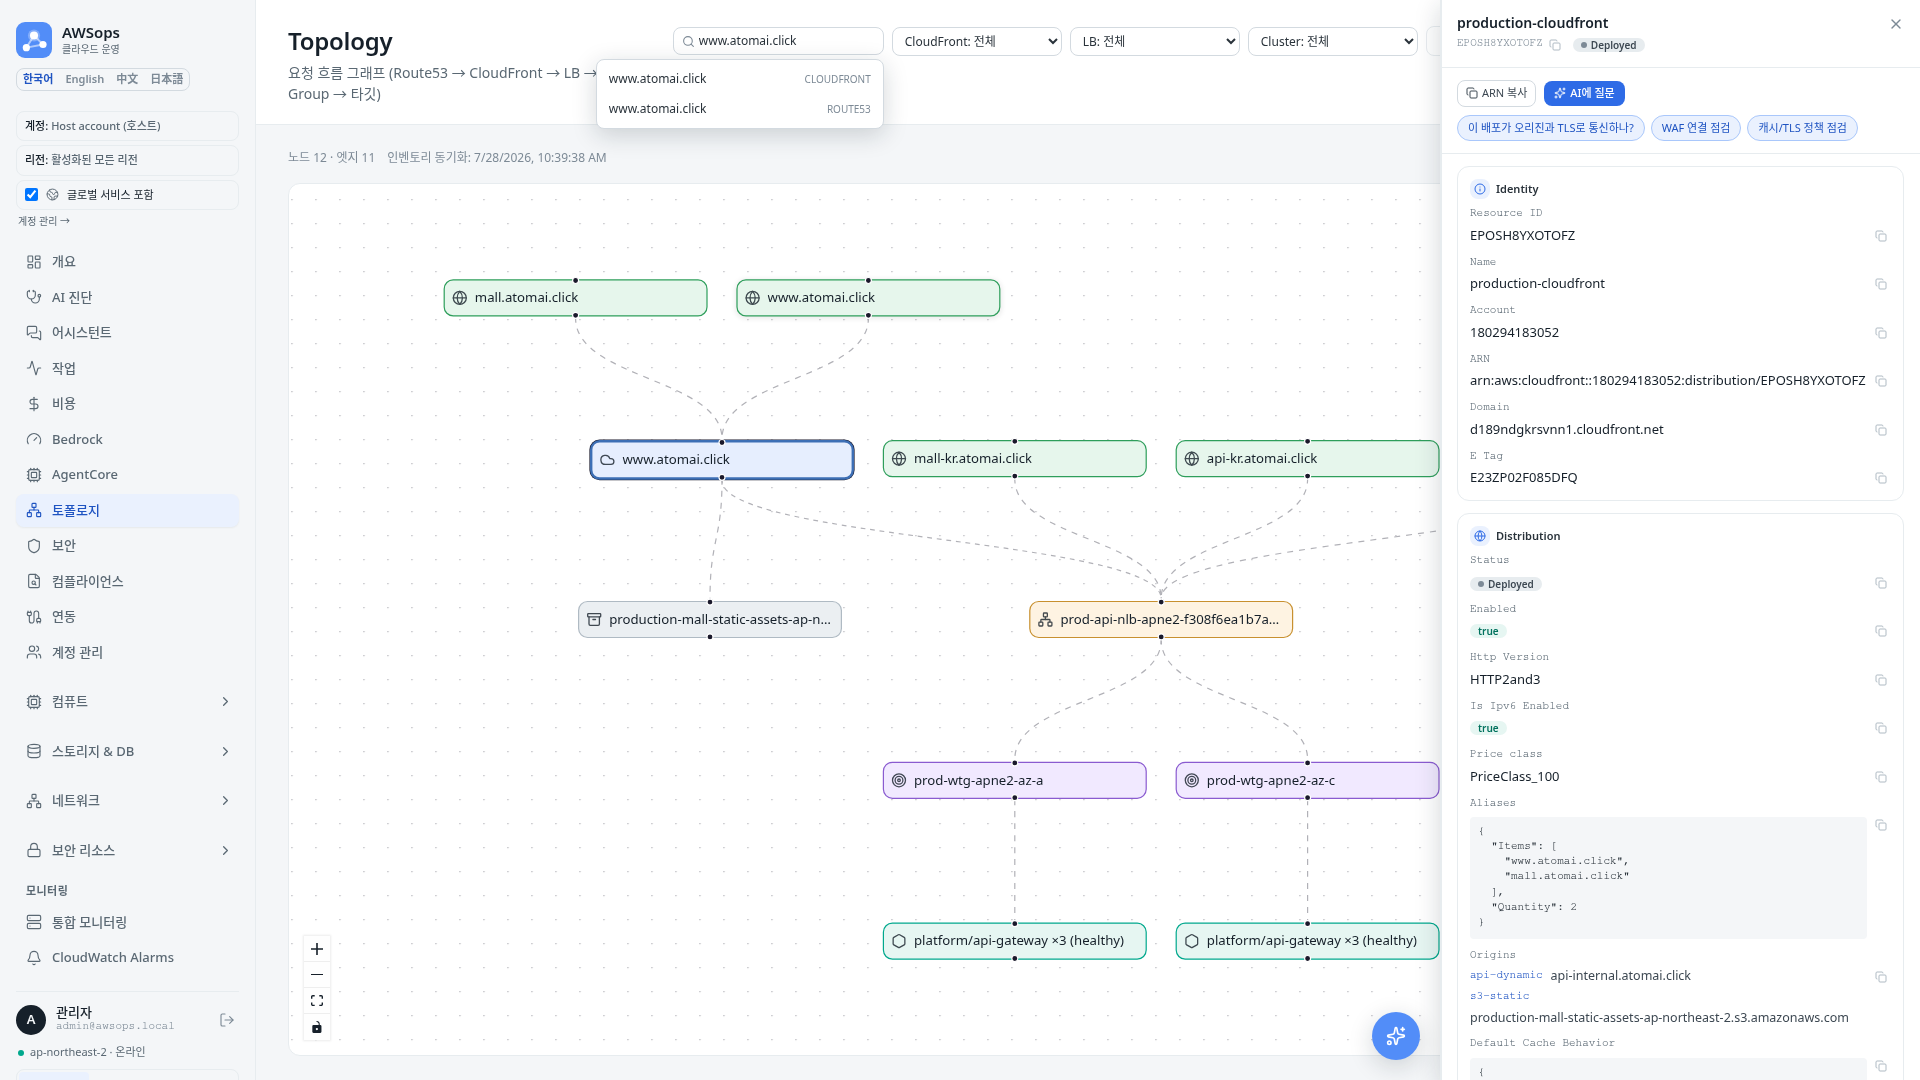
How to use
- Click Resources > Topology in the sidebar.
- Once the graph renders, use the MiniMap and Controls to zoom into the area you want to inspect.
- To view a single entry point, pick a target in the top CloudFront or LB selector.
- To find a specific resource, type part of its name in the search box and choose from the autocomplete list.
- Click a node to enter focus mode, then review its fields in the right detail panel.
- Use Copy ARN, the suggested question chips, Ask AI, and the relationship graph link as needed.
- Click empty space to clear the selection and return to the full graph.
Tips
To see a service's full path, pick an entry point with the CloudFront or LB selector, then follow the flow down to the terminal targets. The target node colors let you read health state at a glance.
Collection and observation timestamps use the browser's local time zone. Different source timestamps must not be interpreted as simultaneous observations.
AI analysis tips
Using the detail panel's question chips or the Ask AI button opens the AI assistant pre-seeded with the selected resource's context. Example questions:
- Does this CloudFront distribution talk to its origin over TLS?
- Why is this Load Balancer's listener/target health in this state?
- Diagnose the cause of unhealthy targets in this Target Group.
- Find the instance/ENI this IP belongs to and check its security group.
Related pages
- Resource Inventory - browse resources by type
- AI Assistant - continue the conversation with the context handed over from the graph