EKS / Kubernetes
A page for browsing your EKS cluster fleet and in-cluster resources in one place, read-only.
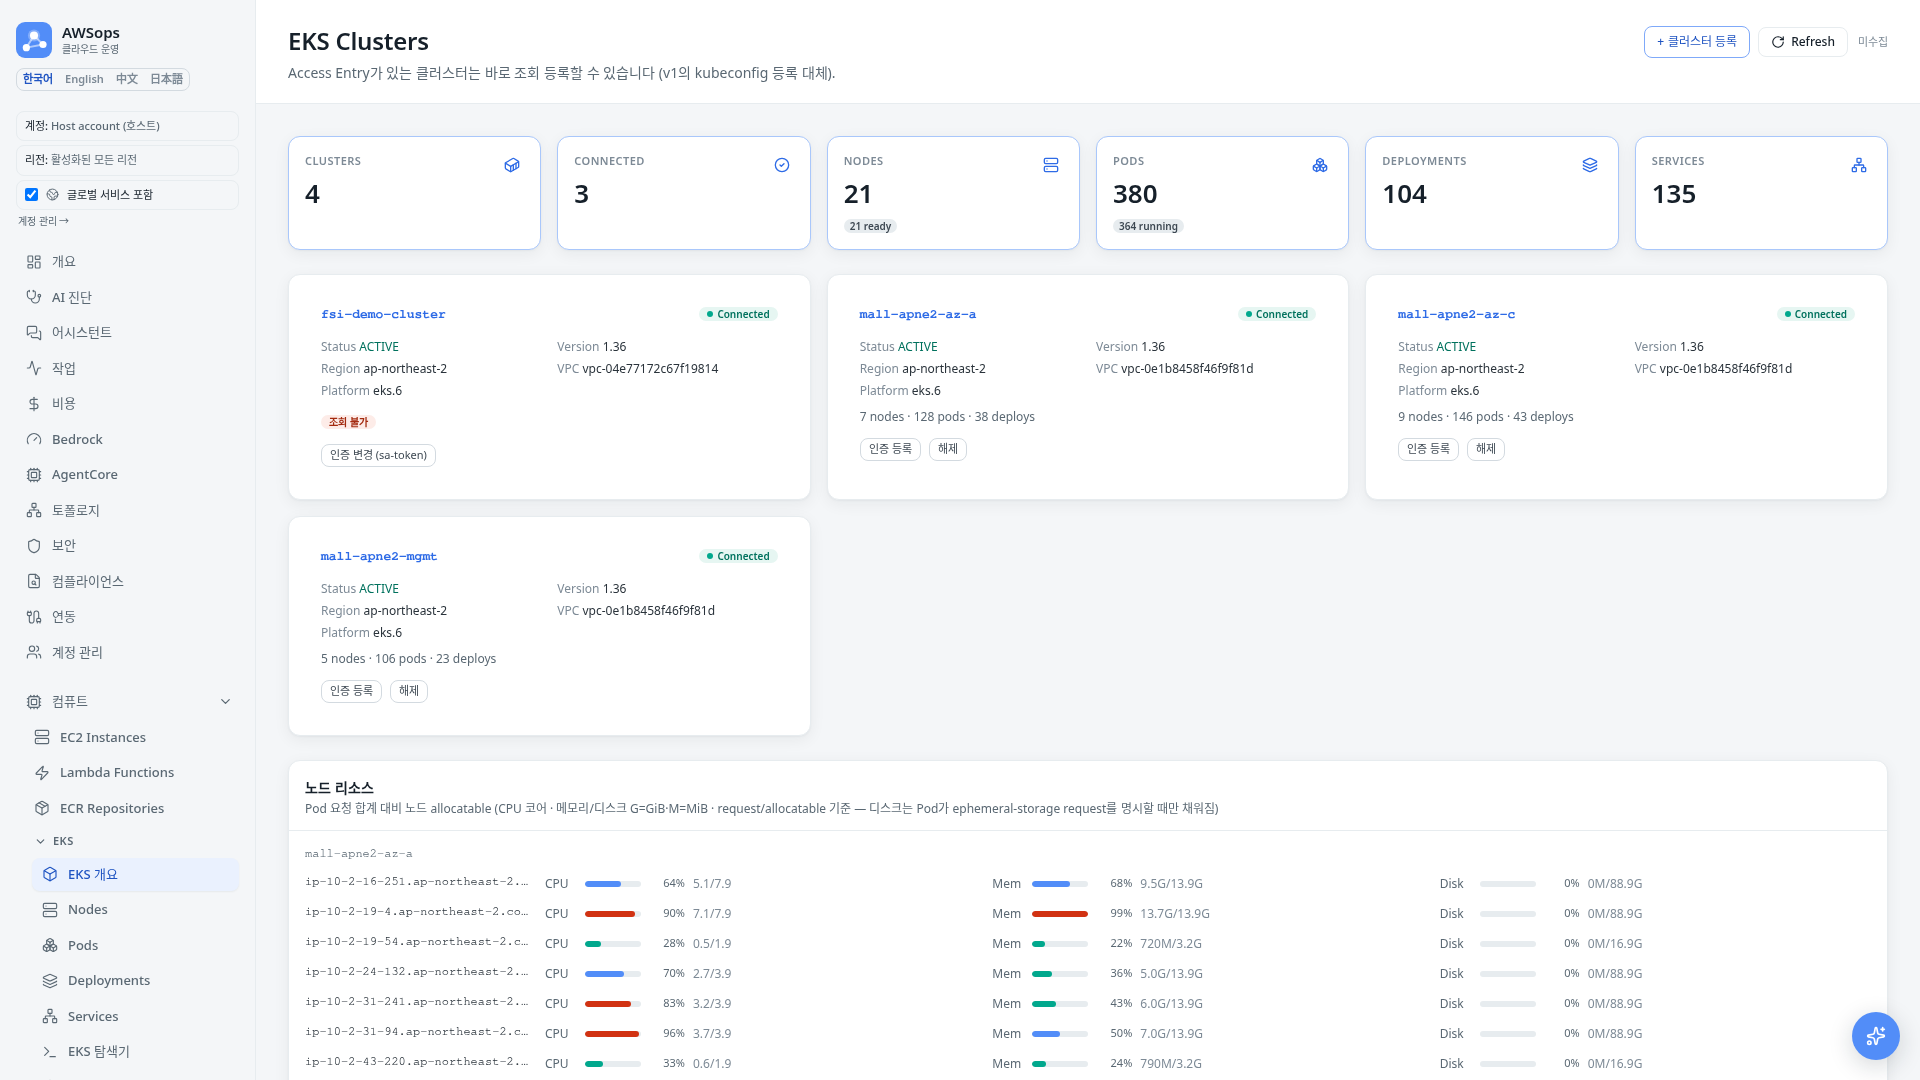
Features
KPI cards
Top cards summarize the whole fleet at a glance.
| Card | Meaning |
|---|---|
| Clusters | Total clusters discovered in the account |
| Connected | Clusters whose data can be queried (connected) |
| Nodes | Node total across connected clusters (ready count shown) |
| Pods | Pod total (running count shown) |
| Deployments | Deployment total |
| Services | Service total |
Cluster cards
Each cluster renders as a card showing Status, Version, Region, VPC, and Platform. The connection state is shown as a badge.
- Connected: queryable, with node/pod/deployment counts (click the card title to open the detail view)
- Entry present: an Access Entry exists but query access is not yet registered
- Not connected: no Access Entry, so the cluster cannot be queried
- Unknown: access state could not be determined
A connected cluster requires an EKS Access Entry. Admins can register/unregister query access or view an onboarding script to apply to the cluster themselves. AWSops never changes clusters — everything here is read-only.
Fleet resource summary
When at least one cluster is connected, extra visualizations appear below the cards.
- Node resources: per-node CPU / Mem / Disk usage meters (Pod request totals vs. node allocatable)
- Pod Status / Instance Types / Pods per Namespace charts
- Warning Events table (recent cluster warnings, newest first)
Cluster detail
Clicking a cluster card opens the detail view (/eks/<cluster>). It provides Nodes / Pods / Deployments / Services / Events / Diagnosis tabs, with a search box and a namespace filter to narrow the view. Click a row to open a detail drawer.
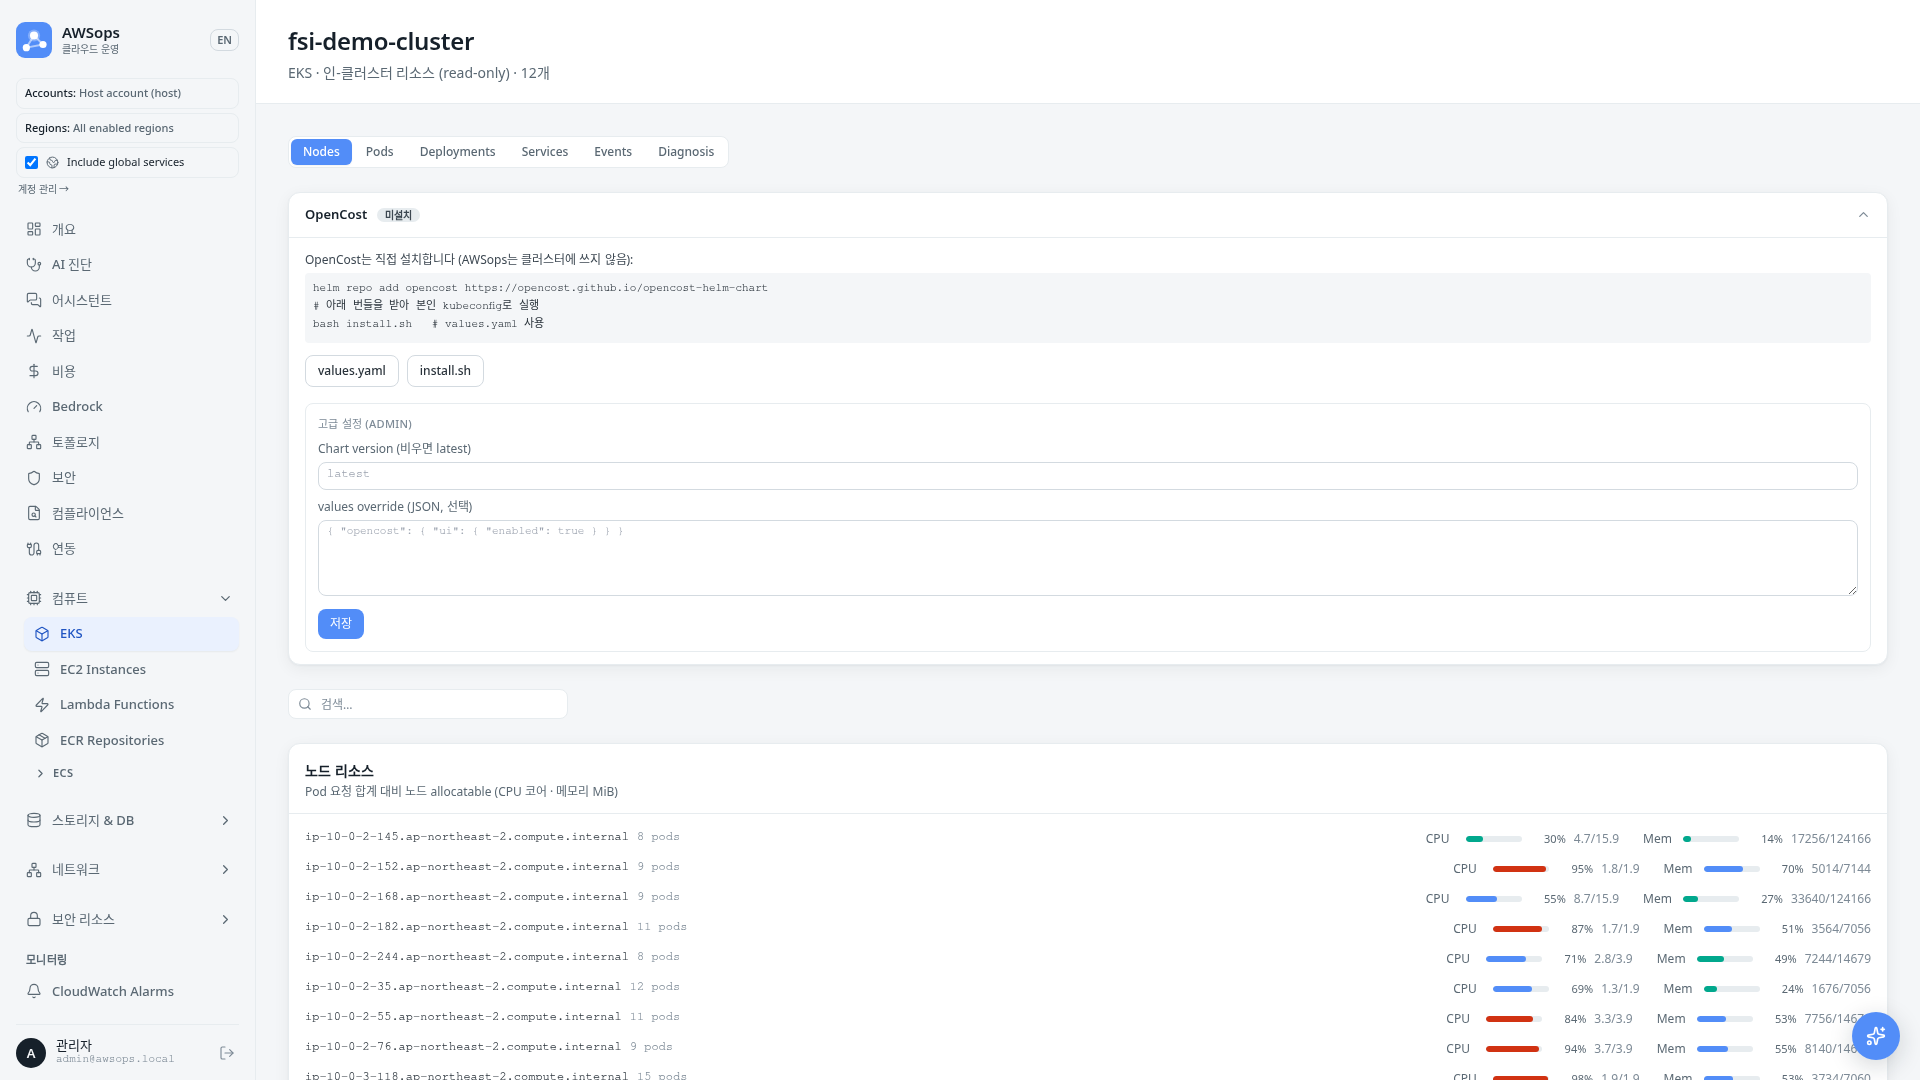
- OpenCost panel: detects install status and offers values.yaml / install.sh downloads so you install it in your own cluster (read-only — AWSops never writes to the cluster). Admins can save chart version / values overrides.
- Diagnosis tab: K8sGPT-based diagnosis that remains read-only even when enabled. It keeps the deterministic analyzer result (FACT) separate from the AI hypothesis, which you should verify before acting.
How to use
- Click Resources > EKS in the sidebar
- Use the top KPI cards to gauge fleet size and connection state
- Click a Connected cluster card title to open its detail view
- Switch tabs to browse Nodes / Pods / Deployments / Services / Events
- Type a keyword in the search box or narrow with the namespace filter
- Click a row to inspect all properties in the detail drawer
- If needed, download values.yaml / install.sh from the OpenCost panel and install it yourself
You only need to type part of a name in the search box. The namespace filter is available alongside it on the Pods / Deployments / Services tabs.
For a cluster to appear as Connected, it needs an EKS Access Entry. Not-connected clusters come with an onboarding script, and registering/unregistering is admin-only. Timestamps are shown in KST (Asia/Seoul).
AI analysis tips
From the floating button (ChatDrawer) or the Assistant page, try asking:
- "Find pods with a high restart count"
- "Which node has the highest CPU request ratio?"
- "Explain the cause of the recent Warning events"
- "Are any deployments short on available replicas?"
Related pages
- Resource Inventory - Full account resource inventory
- Topology - Resource relationship visualization