Dashboard
A page for viewing your AWS and Kubernetes operations at a glance and moving straight into the AI assistant.
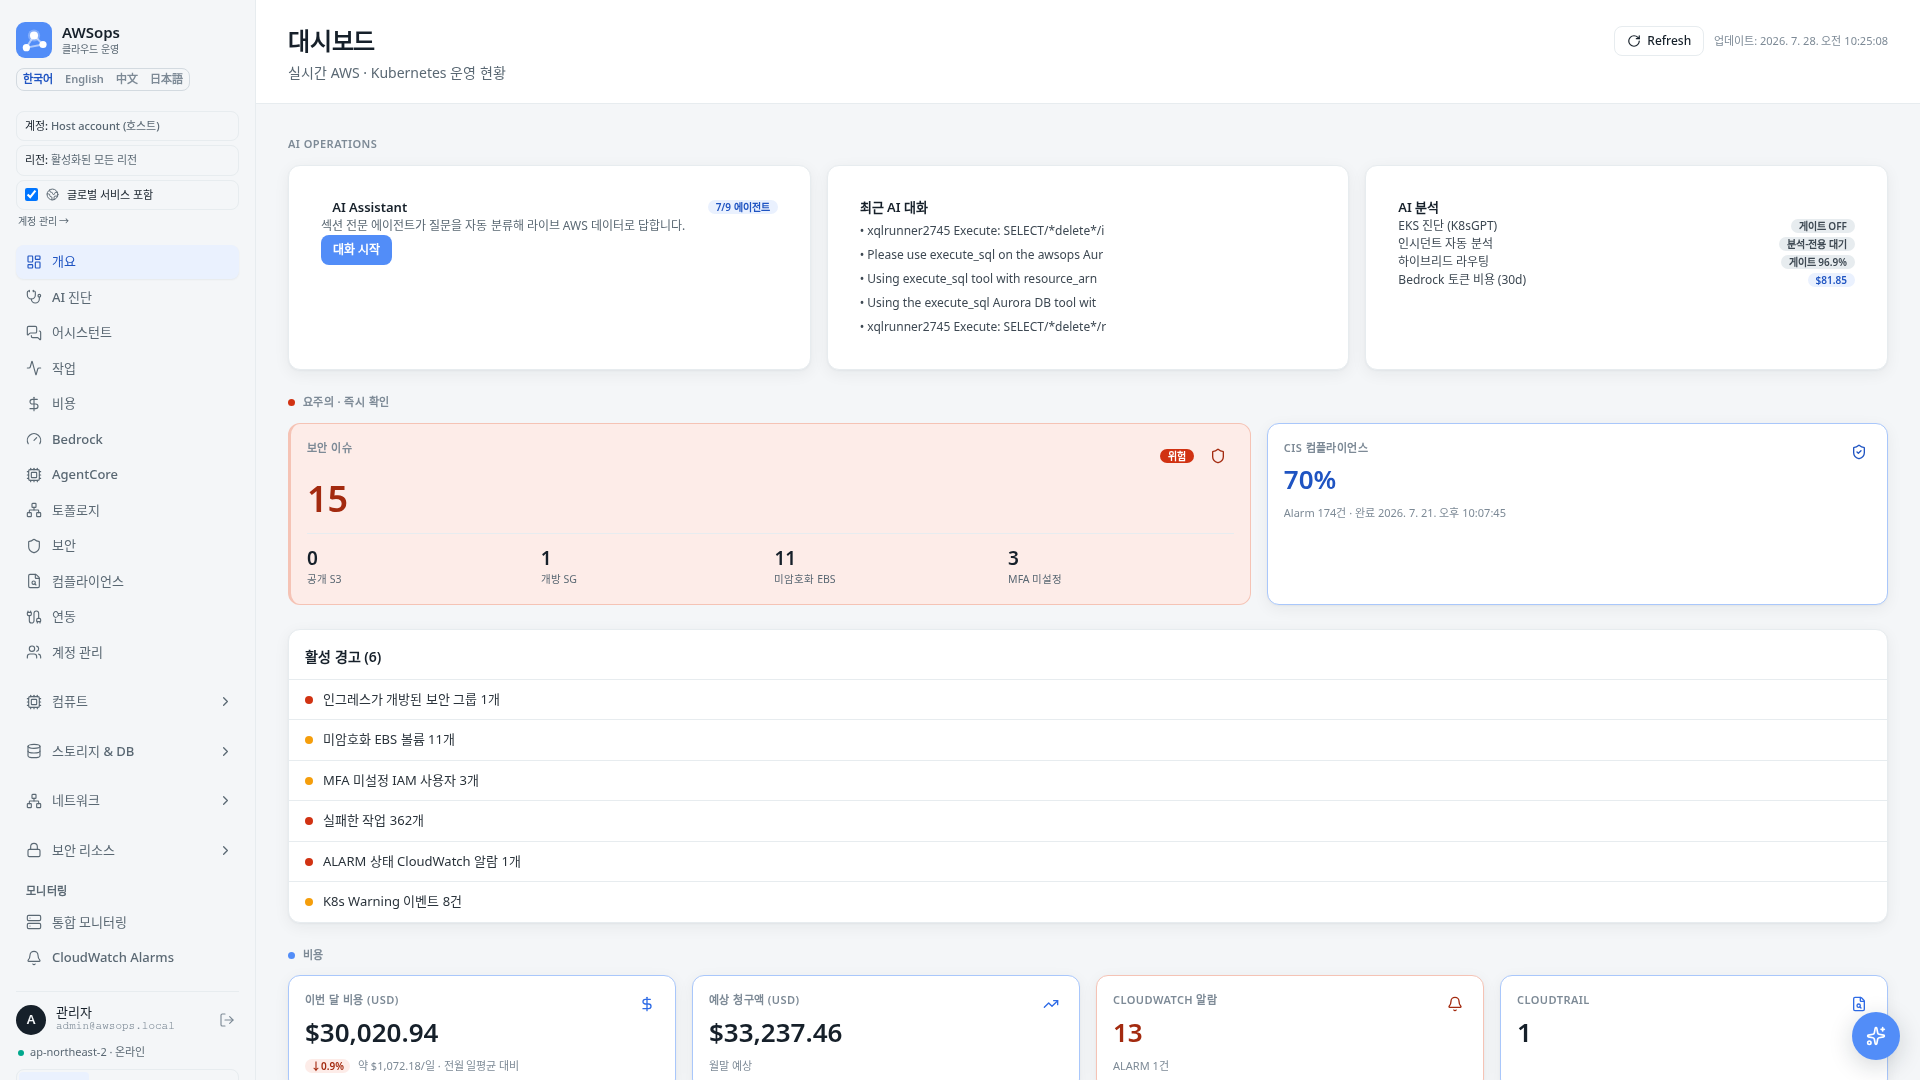
Features
AI Operations
The AI Operations row at the top of the page gives you direct entry points into the AI features.
- AI Assistant card: Shows a badge with the active agent count; click Start chat to open the chat drawer.
- Recent AI conversations: Lists your past conversations — click an item to reopen it.
- AI analysis status card: Summarizes the current analysis environment, including the EKS diagnosis/K8sGPT gate, incident auto-analysis, and hybrid routing accuracy.
KPI tiles
Key resource metrics are organized into three groups.
| Group | Metrics |
|---|---|
| COMPUTE & CONTAINERS | EC2 (running/stopped hint), Lambda, ECS, ECR, EKS |
| STORAGE & NETWORK | S3, EBS (unencrypted volume count), RDS, DynamoDB, VPC |
| SECURITY · OPS · COST | IAM roles, Security Groups (open-ingress count), job success/fail, CloudWatch alarms, this-month cost (USD) |
- Tiles are highlighted in warning/danger colors when there are unencrypted volumes, 0.0.0.0/0 open ingress, or failed jobs.
- This-month cost is shown as a USD amount.
Charts
| Chart | Content |
|---|---|
| Resource distribution | Counts of the top resource types (bar) |
| Resources by category | Share per category with total (donut) |
| Job status | Share of succeeded, failed, running, and queued jobs (donut) |
| Daily cost trend | Cost trend by date (area) |
| Monthly Cost Impact (est.) | 30-day resource-count change × static per-type unit-cost heuristic (±$N/mo est., top 8 by |impact|) — not billing data; types without a 30-day baseline are excluded |
How to use
- The dashboard opens automatically after you sign in; you can also reach it via Overview > Dashboard in the sidebar.
- In the AI Operations row, click Start chat to begin a conversation, or reopen a previous one from Recent AI conversations.
- Check any tiles highlighted in warning/danger colors in the KPI section.
- Review the charts for resource composition, job status, and cost trend.
- Use the Refresh button in the header to reload all data. The last-updated time is shown alongside it. Admins additionally see a Sync all button — it enqueues an on-demand all-types inventory sync (async batch: an enqueue acknowledgement, not a completion guarantee; already-running types are skipped; check via Refresh a few minutes later). Environments with sync disabled show a disabled note.
- Resource tiles carry state-decomposition sublines (e.g. EC2 running/stopped, EBS GiB · unencrypted, VPC subnets/NAT/TGW, ECS services/tasks, WAF rule groups/IP sets). A subline appears only once its data is loaded, and the EKS subline covers REGISTERED clusters and renders only when every registered cluster answered, the account scope is all-accounts, AND the tile's cluster count matches the registered-cluster count (the registry and the account lookup are different sources — on a mismatch the subline is hidden rather than shown against a contradicting headline).
Keeping data fresh
The Refresh button shows the time data was last loaded (KST) and adds an (outdated) marker after 30 minutes. If highlighted tiles appear or the timestamp looks stale, refresh once.
When data looks empty
KPI tiles show — until the summaries arrive. When there is no job or cost data, the chart areas display No job data or No cost data instead.
AI analysis tips
You can ask the AI assistant about anything you notice on the dashboard.
- "List the Security Groups that have open ingress."
- "Show the unencrypted EBS volumes and which instances they're attached to."
- "Analyze the main driver behind this month's cost increase."
- "Diagnose what the recent failed jobs were and why they failed."
Related pages
- AI Assistant - Analyze dashboard data with the AI assistant
- Resource Inventory - See detailed resource lists by type
- Cost Explorer - Analyze cost trends and breakdowns