Resource Inventory
A page for browsing inventory by resource type, with KPIs, a distribution chart, a sortable table, and a detail panel.
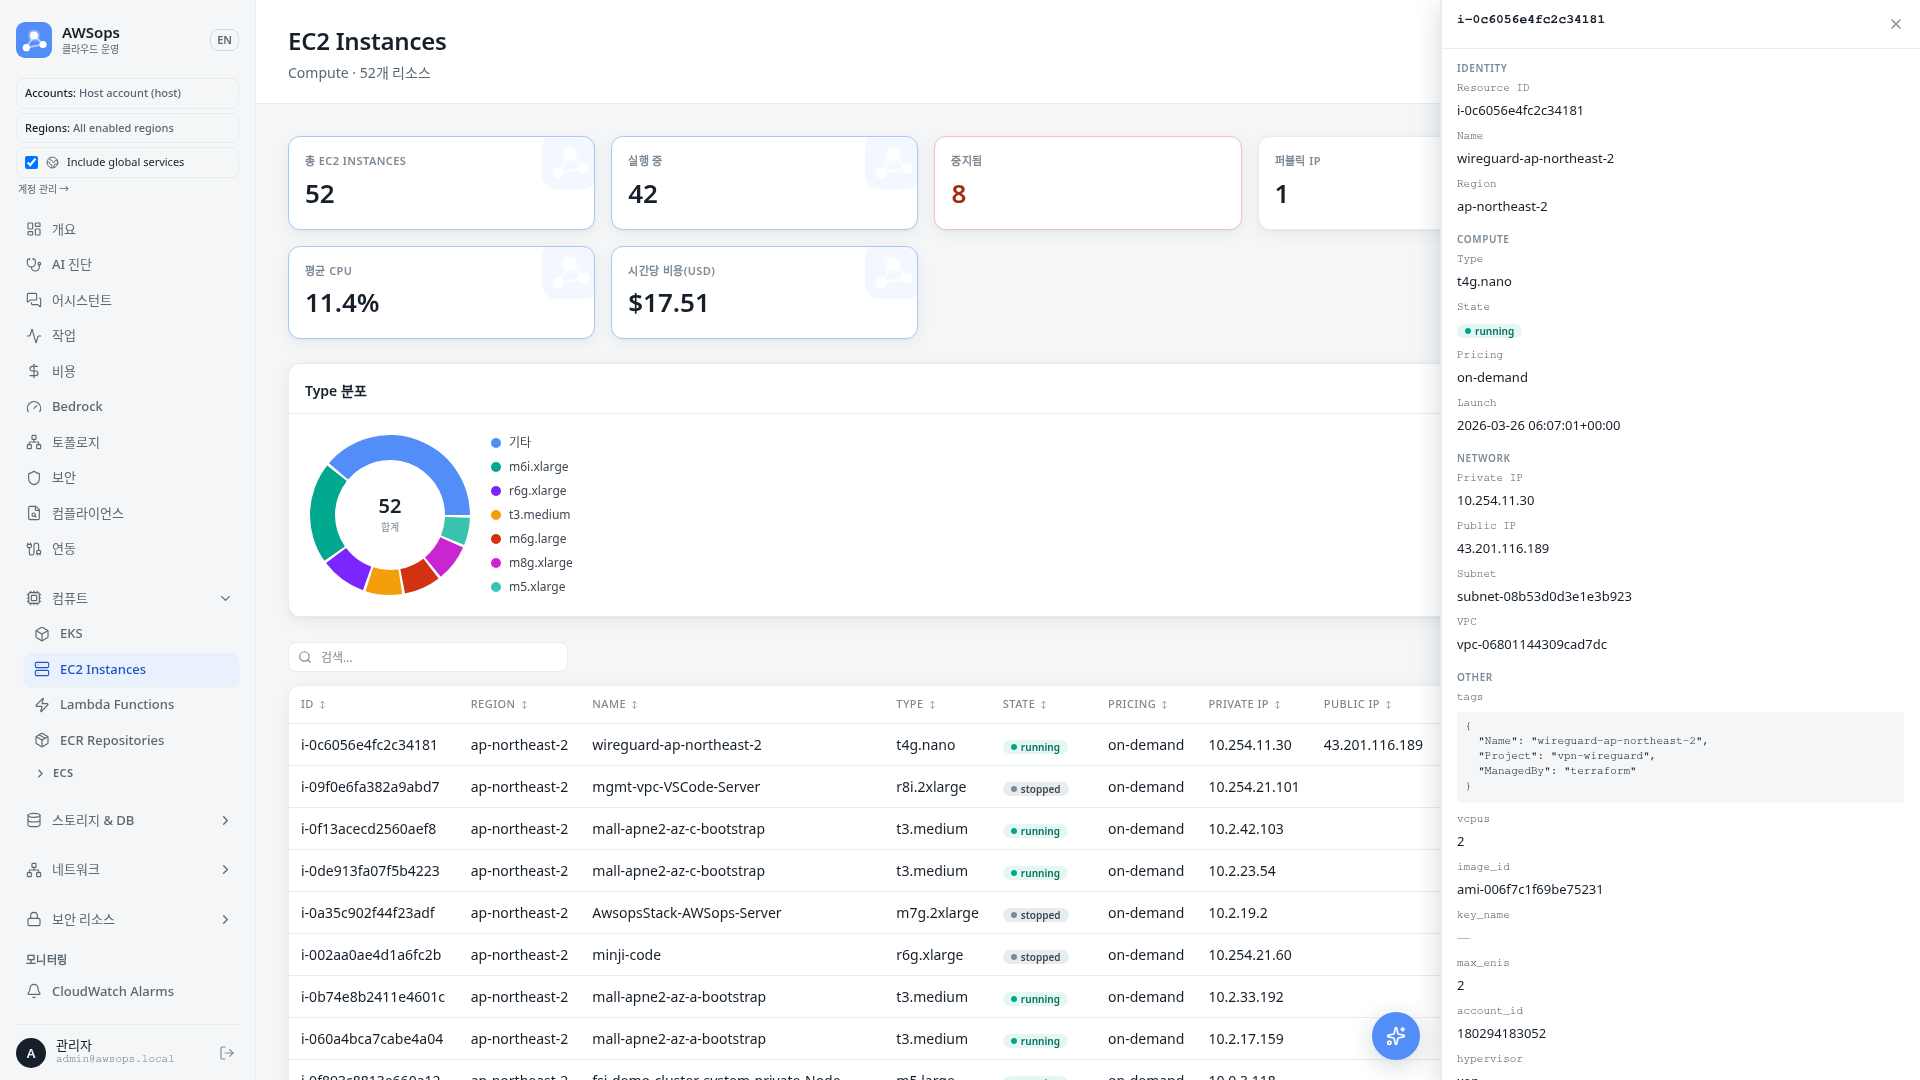
A single screen browses around 22 resource types — EC2, Lambda, RDS, S3, VPC, Security Groups, IAM, and more — all the same way. Pick a type from the sidebar inventory groups (Compute / Storage & DB / Network / Security / Monitoring) and it renders with the same layout. The notes below use EC2 as the example.
Key Features
KPI cards
- Total resources: the total count for the selected type
- Status counts: the top 4 status values appear as cards, with abnormal states such as stopped, failed, or alarm highlighted in a danger color
- EC2 extra metrics: EC2 also shows average CPU and hourly cost cards
Distribution chart
- A donut chart breaks the type down by its key attribute (for EC2, by Type)
- The top 6 values plus an Other bucket give an at-a-glance view of the composition
- Past the 500-row cap the donuts use server-side full-fleet aggregation and Other is computed against the fleet total. Dimensions whose values are client-derived (e.g. Lambda runtime, DynamoDB billing mode) stay sample-based, and such donuts carry a (sampled) qualifier in the title
Sortable table
- Type in the search box to instantly filter across every column value
- Click a column header to sort; numeric columns sort numerically
- Status values render as colored badges, and end-of-support Lambda runtimes get an EOL badge
- The segmented filter at the top quickly narrows to a single status
Detail panel
- Click a row in the table to open a detail panel on the right
- It shows every field, and richer types group them into sections such as Identity / Network
- The panel width is draggable, and you close it with ×, Esc, or a click on the backdrop
How to Use
- Click a resource type from the sidebar inventory groups (e.g. Compute > EC2)
- Read the top KPI cards to size up the total and its status distribution
- Type a keyword in the search box or use the status segmented filter to narrow the rows
- Click a column header to sort by the criterion you want
- Click a row to inspect its full set of fields in the detail panel on the right
- When you need fresh data, re-collect with the Refresh button in the top right
Tips
Search matches across every visible column value, so typing part of an IP, a name, or a VPC ID is enough to jump straight to the row you want.
Refresh only re-reads the current state — it never changes resources. AWSops observes and diagnoses AWS resources only and makes no changes. Collection times are shown in KST (Asia/Seoul).
On mobile, the table is replaced by a card layout that stays readable on small screens.
AI Analysis Tips
Open the AI assistant with the floating button (or the Assistant page) and ask about your inventory.
- "Are any Lambda functions on an end-of-support (EOL) runtime?"
- "Show me EC2 instances that have a public IP."
- "Are there any RDS instances that are not Multi-AZ?"
Related Pages
- Topology - Resource connection graph
- EKS / Kubernetes - Browse cluster workloads
- Cost Explorer - Detailed cost analysis