Cost Explorer
A page for analyzing month-to-date cost and the per-service cost breakdown.
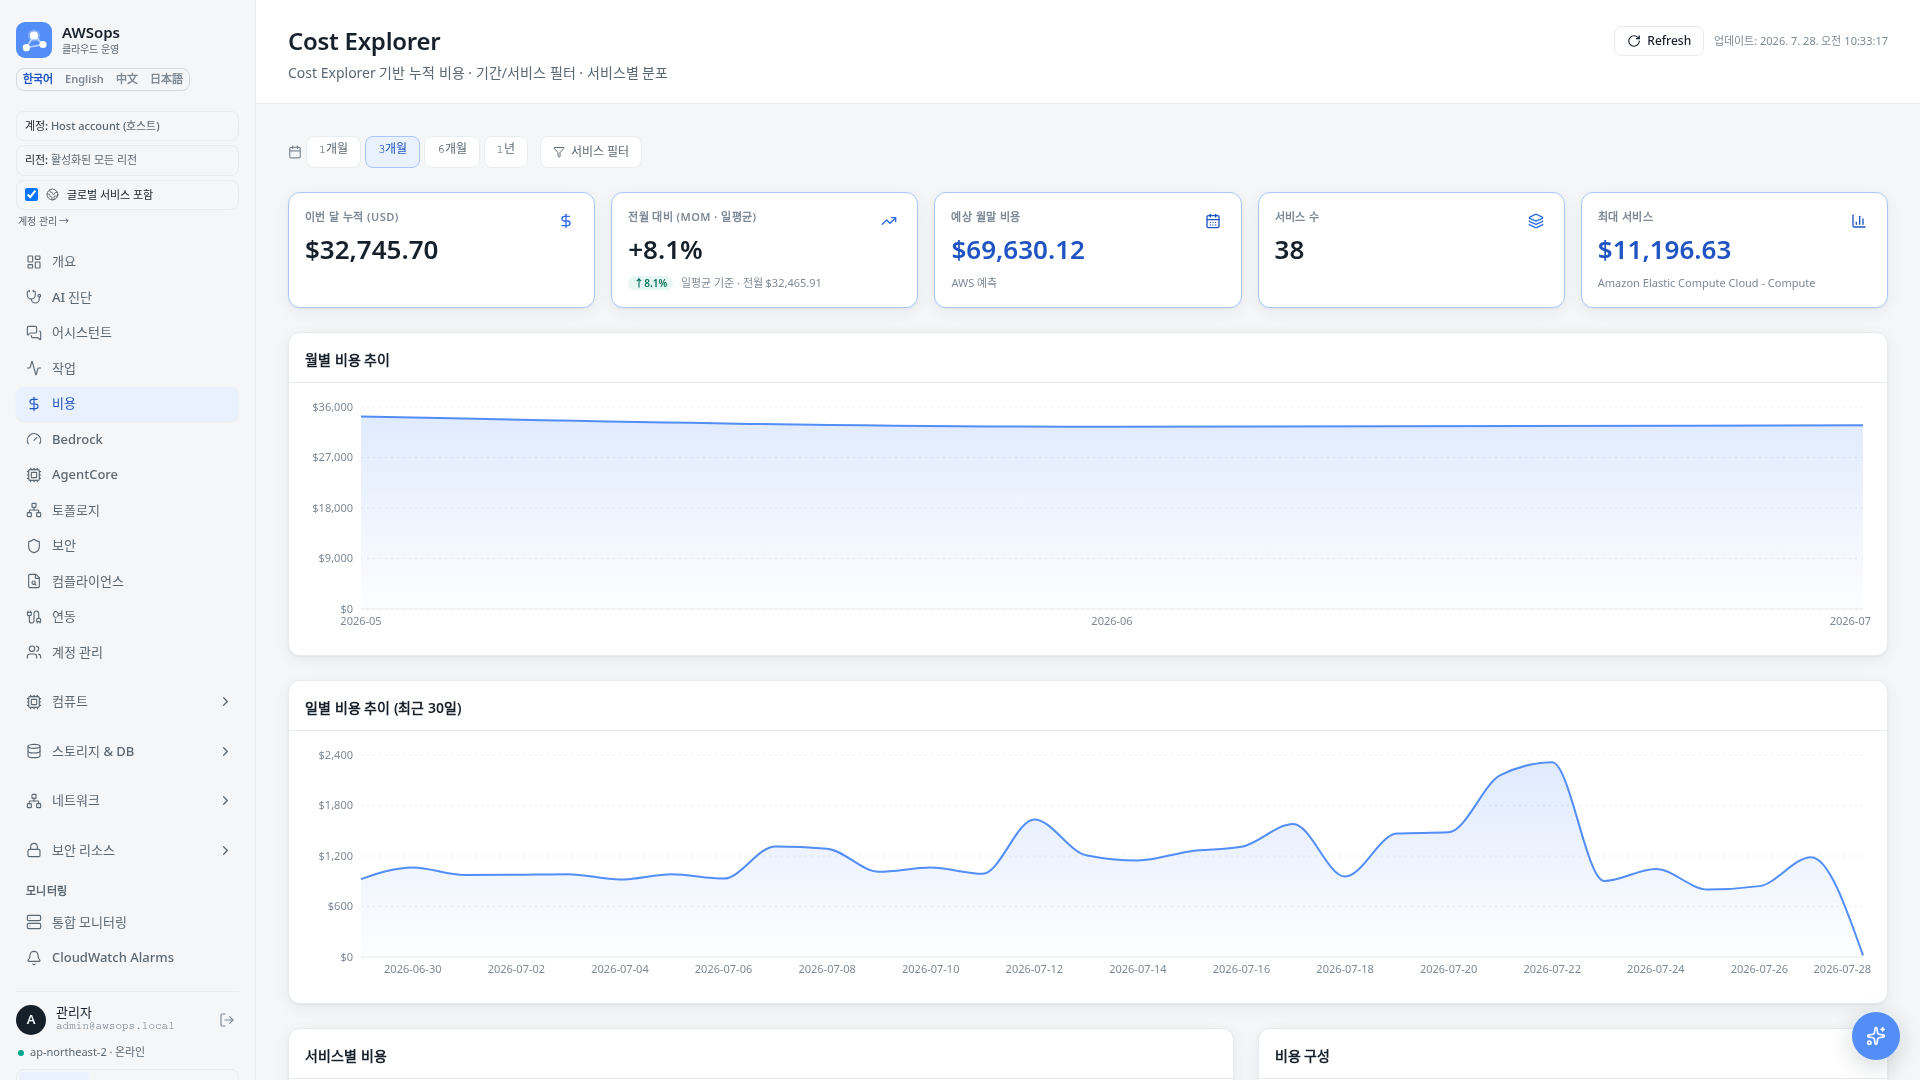
Key Features
KPI Tiles
Seven tiles at the top of the page summarize your cost posture:
- Month-to-date: Cumulative cost from the first of the month through now
- MoM (daily average): Month-over-month change. Since the current month is partial, the comparison is made on a daily-average basis to avoid distortion from incomplete data
- Projected month-end cost: AWS forecast or a linear estimate (the tile shows AWS forecast / linear estimate)
- Daily Average: Mean of the trailing-30d daily totals (today's still-accumulating bucket excluded; service filters apply)
- Last Month: The previous month's total
- Service count: Number of services that incurred cost — with an 'N increasing >20%' subtext when services grew more than 20% over last month
- Top service: The highest-cost service and its amount
When there is no data at all (every series empty), a 'no cost data in the selected period' banner appears with a Check availability button — if Cost Explorer is confirmed not enabled (host account), an onboarding hint appears (enable it in the Billing console; up to 24h until data shows); if it is available, the banner says the period most likely had no spend.
Trend Charts
- Monthly cost trend: An area chart of monthly cost over roughly the last 6 months
- Daily cost trend: An area chart of daily cost over roughly the last 30 days
Per-Service Breakdown
- Cost by service: A horizontal bar list of cost per service
- Cost composition: A donut chart of the top services plus an Other rollup of the remainder
- Service detail table: service / this month / last month / change (day-normalized — thresholds: >20% red · >0 orange · <0 green; no baseline '—') / share (mini bar) — numeric sort, search, and a problems-only toggle
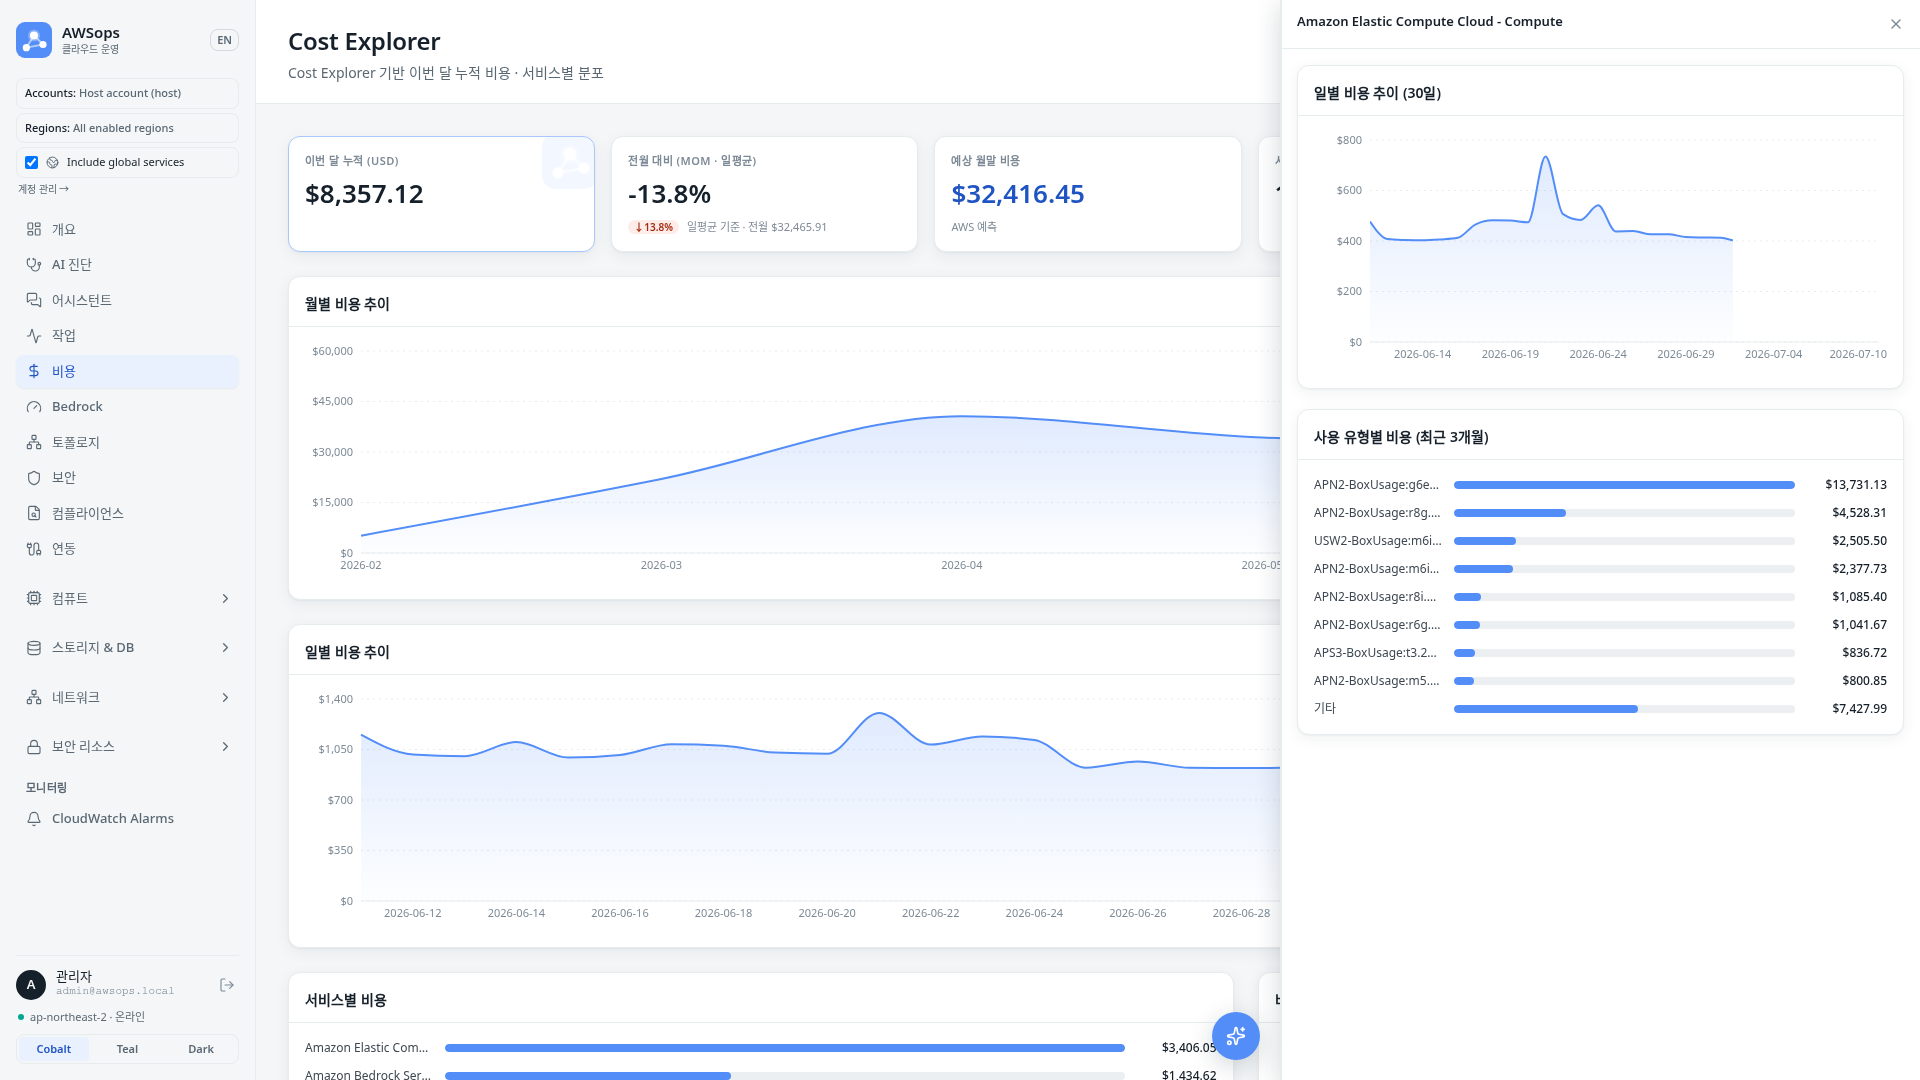
Service Drill-Down Panel
Clicking a service row in the table opens a detail panel on the right:
- Daily cost trend (30 days): That service's daily cost over the last 30 days
- Usage-type breakdown: Cost broken down by usage type over the last 3 months
- Drag the panel edge to resize its width; close it with the × button, Esc, or clicking the backdrop
How to Use
- Click Cost > Cost Explorer in the sidebar
- Check month-to-date cost and the month-end projection in the KPI tiles
- Read the trend charts to understand monthly and daily cost flow
- Review the distribution with the Cost by service list and the Cost composition donut
- In the Service detail table, click a row to view that service's daily trend and usage-type breakdown
- Use the refresh button to reload the latest data
Tips
Because the current month is still in progress, the MoM metric compares on a daily-average basis rather than full-month totals. This keeps the change percentage reliable even early or mid-month.
If some trend, monthly, or forecast data fails to load, the per-service breakdown still renders. If cost data does not appear, check your Cost Explorer permissions or session state.
Times shown in the app are in Korea Standard Time (KST, Asia/Seoul).
AI Analysis Tips
From the floating AI Assistant button or the Assistant page, you can ask questions such as:
- "Which service costs the most this month?"
- "Is cost up or down compared to last month?"
- "What's the projected month-end cost?"
- "Break down EC2 cost by usage type"
Related Pages
- Bedrock Usage - Check model usage and cost
- Dashboard - Overall operations summary