EKS Overview
A page for viewing the overall status of EKS clusters, node resources, and Pod status at a glance.
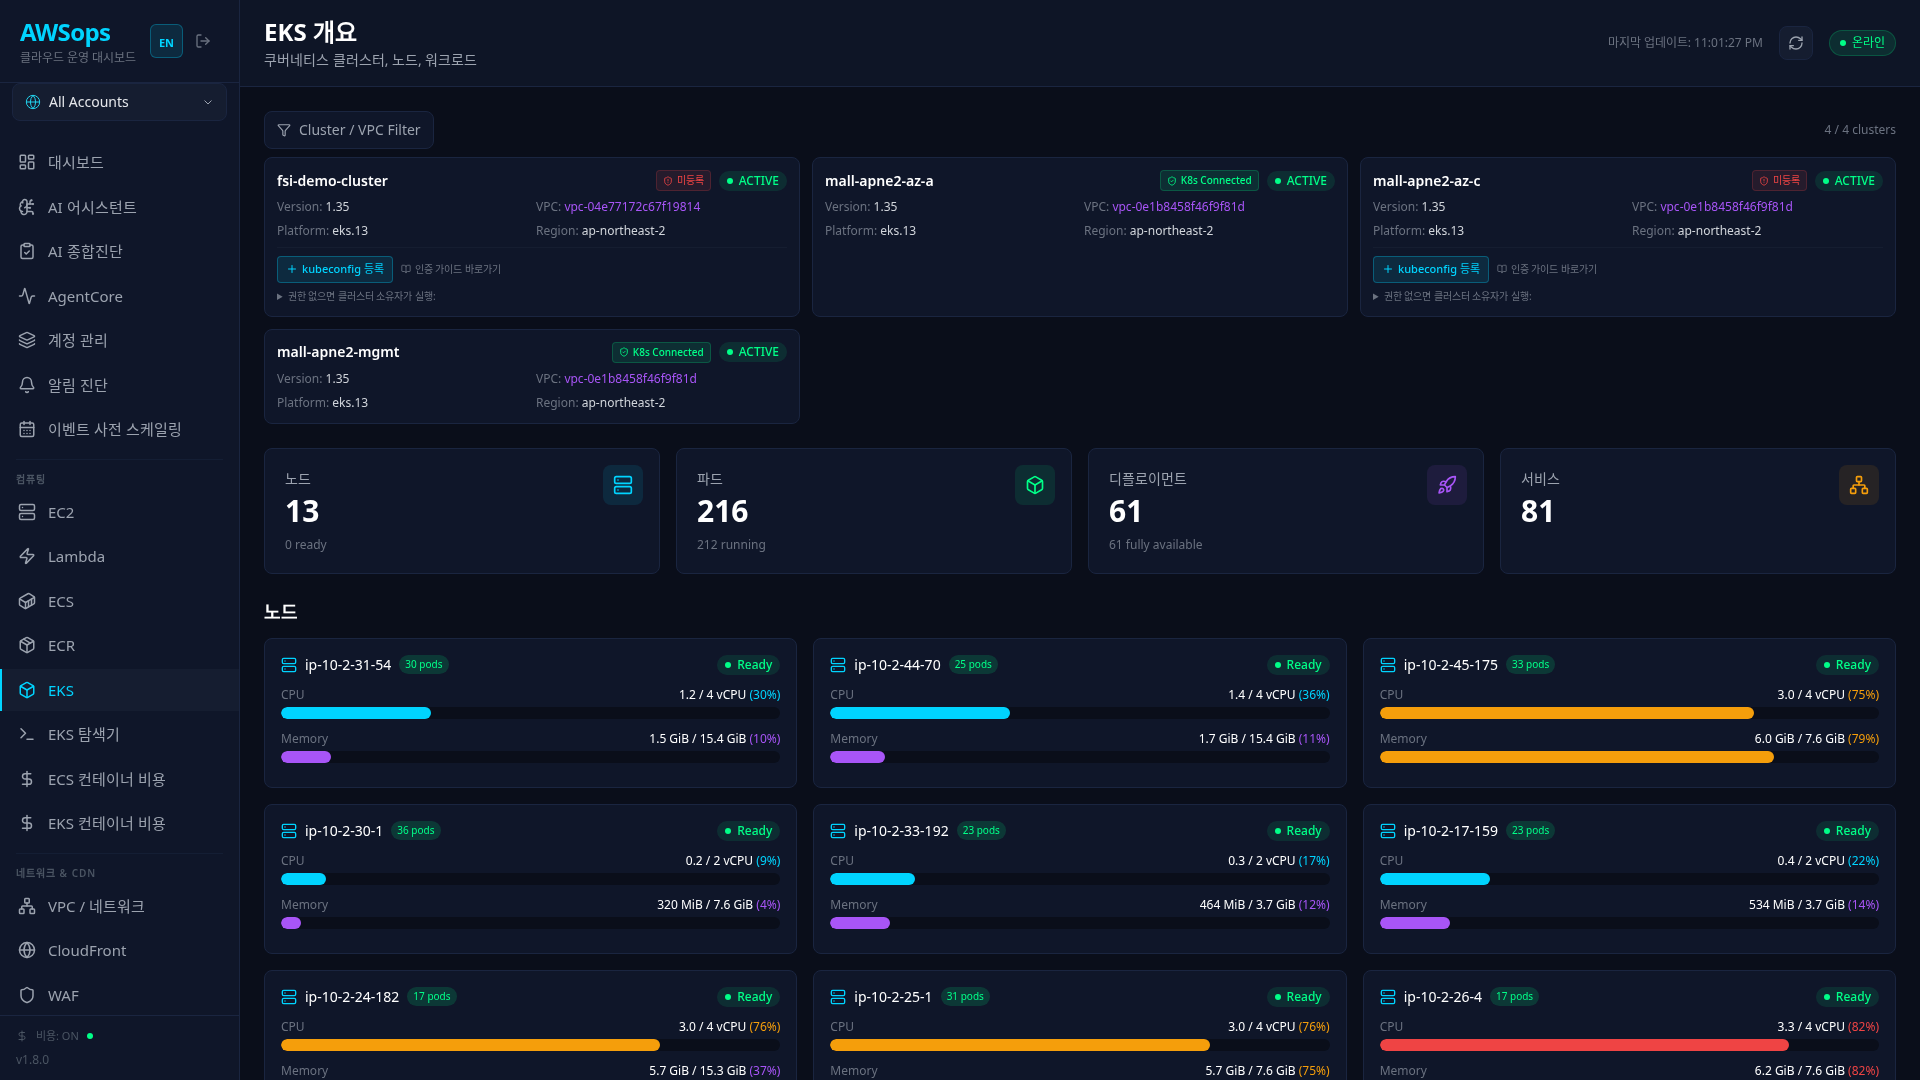
Key Features
Cluster Filter
- Filter by EKS cluster
- Filter by VPC
- Multi-select support
EKS Cluster Cards
Display key information for each cluster in card format:
- Cluster Name, Status (ACTIVE)
- Kubernetes Version, VPC ID, Platform Version, Region
- Access Entry badge: K8s Connected (green) / No Access (red)
- Cluster registration button (admin): register an unconnected cluster in one of three modes — Access Entry lookup-register (verifies an EXISTING Access Entry then registers — never creates one at runtime [ADR-005]; a missing entry returns 409 with a Terraform/CLI onboarding script), ServiceAccount token (create a read-only SA in the cluster and paste its token — no AWS-side setup), or AssumeRole (authenticate to the K8s API via an IAM role that ALREADY holds an Access Entry on that cluster — role ARN + external ID; the role MUST be named
AWSopsReadOnlyRole[the web task's sts:AssumeRole grant is name-pinned to it], and the cluster itself must belong to the host account, which the register route verifies against the host cluster list). The Terraform path ismake configure's EKS multi-select →eks.tfgranting the web task role an Access Entry + AmazonEKSAdminViewPolicy - Click to filter: Click a cluster card to filter all data to that cluster (cyan border)
When clusters are registered but live data can't be read from ANY of them, a page-level no-access banner appears with the raw failure reason and a link to this guide. Unconnected clusters cannot display data — connect via the cluster registration button (lookup-register / SA token / AssumeRole) or the Terraform onboarding (make configure → eks.tf). If lookup-register returns 409, hand the on-screen onboarding script to the cluster owner.
Stats Cards (Click to Navigate)
Click each card to navigate to the detail page:
- Nodes → Node Details (
/eks/nodes) - Pods → Pod Details (
/eks/pods) - Deployments → Deployment Details (
/eks/deployments) - Services → Service Details (
/eks/services)
Node Card Grid
Visually display resource usage for each node:
- Node name, Pod count, status (Ready/NotReady)
- CPU usage bar: Pod requests / total capacity (percent)
- Memory usage bar: Pod requests / total capacity (percent)
- 80% or higher: red, 50% or higher: orange, otherwise: cyan/purple
Node Detail View
Click a node card to navigate to the detail page:
- CPU/Memory/Pod Info cards: Capacity, Allocatable, Requested, Available
- ENI list: IP allocation per network interface + instance network traffic tiles (In/Out bytes·packets — cumulative and average rate over the completed previous hour bucket; CloudWatch has no per-ENI dimension, so values are instance-level)
- Pods table: List of Pods running on that node
Visualization Charts
- Pod Status Distribution: Running, Pending, Failed, Succeeded distribution (pie chart)
- Pods per Namespace: Pod count by namespace (bar chart)
Warning Events Table
Display Kubernetes Warning events in real-time:
- Kind, Object, Reason, Message, Count, Last Seen
How to Use
- Click Compute > EKS in the sidebar
- Click a cluster card to filter to a specific cluster
- Click stats cards to navigate to Pods/Nodes/Deployments/Services detail pages
- Identify nodes with high resource usage from the node cards
- Click a node to view detailed resources and Pod list
- Monitor problem events in Warning Events
Tips
If a node card's CPU/Memory bar is red (80% or higher), there's a risk of resource shortage. Consider adding nodes or rebalancing Pods.
In the node detail view, if ENI IP Slots Used is close to 15/15, new Pod scheduling may fail.
You can analyze with the AI Assistant using queries like "EKS cluster status", "CPU usage by node", "Analyze Warning events", etc.
Related Pages
- EKS Authentication Setup - Access Entry / aws-auth authentication guide
- EKS Explorer - K9s-style terminal UI
- EKS Pods - Pod detailed list
- EKS Nodes - Node detailed list
- EKS Deployments - Deployment list
- EKS Services - Service list
- EKS Container Cost - Pod cost analysis (OpenCost)