EKS Pods
A page for viewing the detailed list and status of Kubernetes Pods.
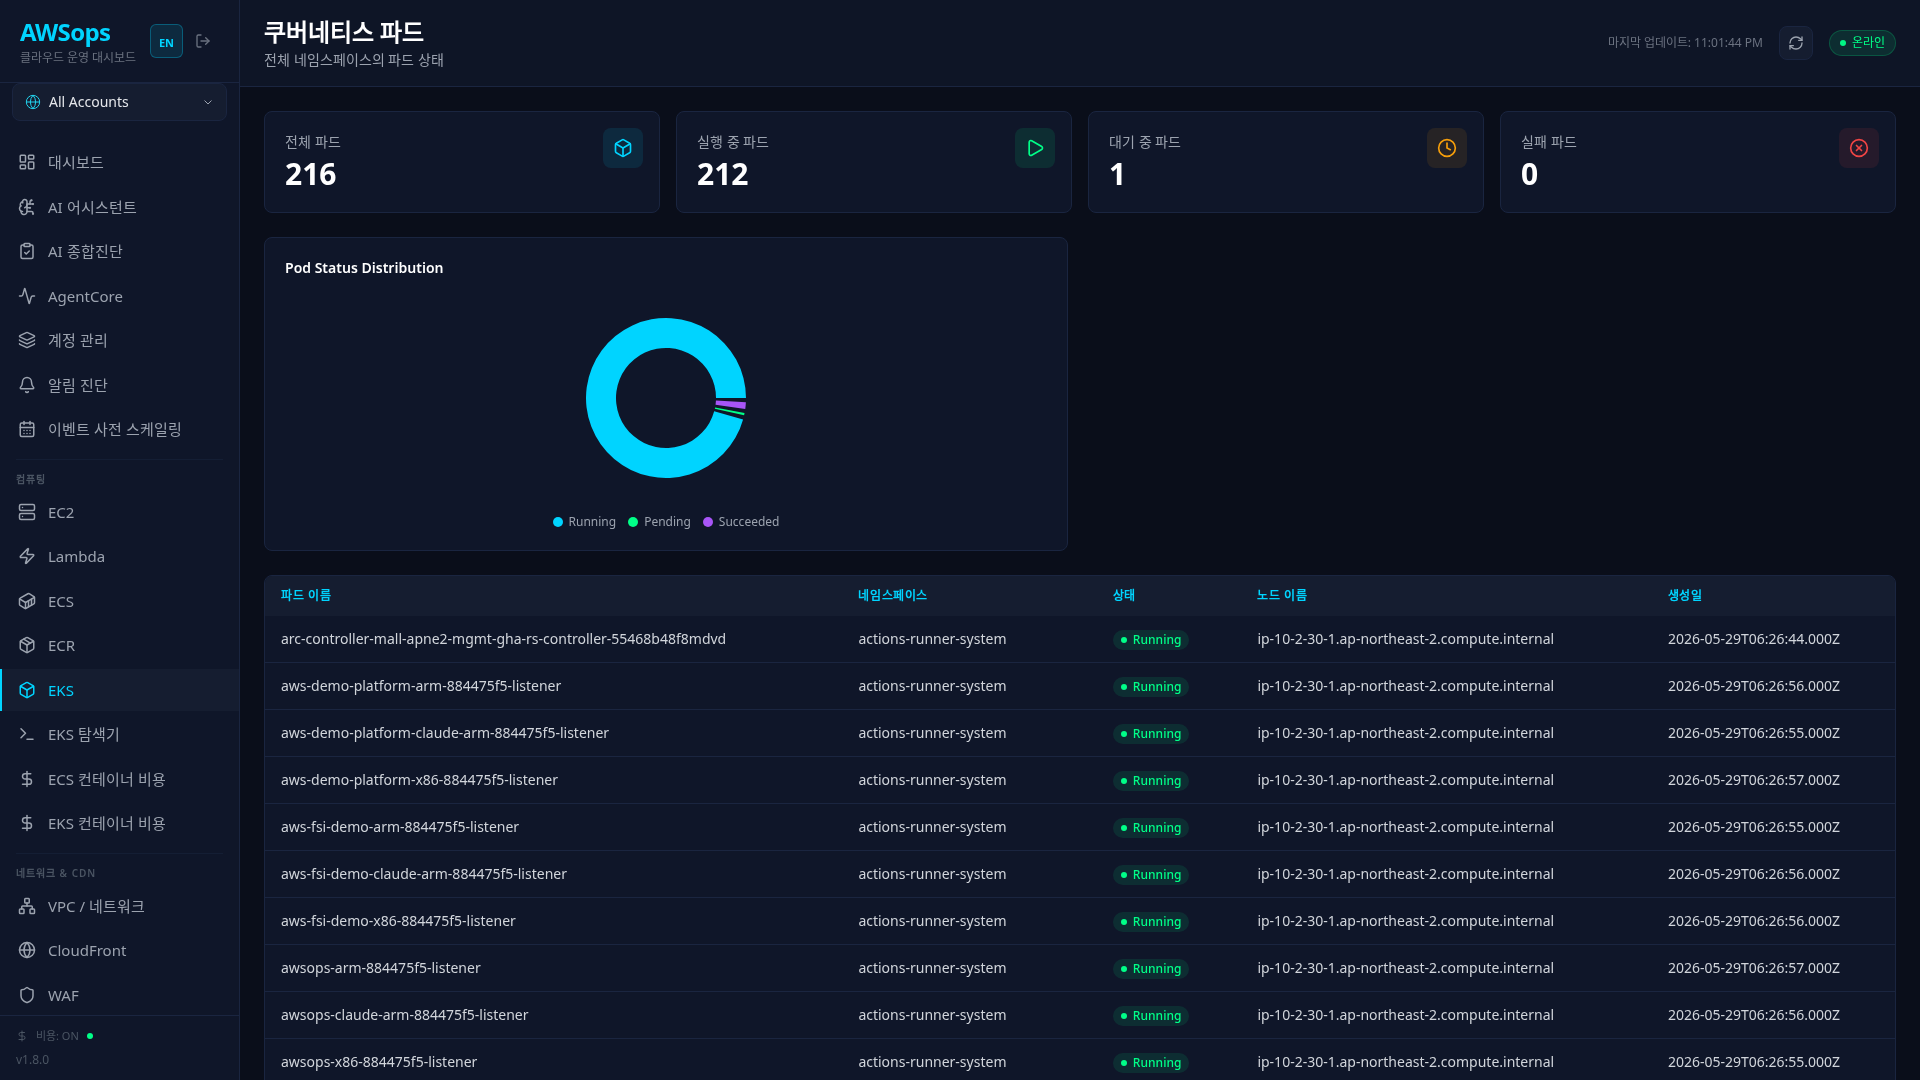
Key Features
Stats Cards
- Total Pods: Total Pod count (cyan)
- Running: Running Pod count (green)
- Pending: Pending Pod count (orange)
- Failed: Failed Pod count (red)
Pod Status Distribution Chart
Visualize Pod status distribution with a pie chart:
- Running: Running normally
- Pending: Waiting for scheduling or pulling image
- Failed: Execution failed
- Succeeded: Completed (Jobs, etc.)
Pod List Table
| Column | Description |
|---|---|
| Name | Pod name |
| Namespace | Namespace |
| Status | Status (StatusBadge) |
| Node | Node where running |
| Created | Creation time |
Status Colors
- Running: Green
- Pending: Orange
- Failed: Red
- Succeeded: Cyan
- Unknown: Gray
How to Use
- Click Compute > K8s > Pods in the sidebar
- Review overall Pod status distribution from the stats cards
- If there are Pending or Failed Pods, investigate the cause
- Check node placement for specific Pods in the table
Understanding Pod Status
| Status | Description | Action |
|---|---|---|
| Pending | Waiting for scheduling, image pulling, resource shortage | Check node resources, image access permissions |
| Running | Running normally | - |
| Succeeded | Completed (Job, CronJob) | Normal termination |
| Failed | Container terminated abnormally | Check logs, review resource limits |
| Unknown | Node communication issue | Check node status |
Tips
Pending Pod Diagnosis
If Pending status persists, check the following:
- Node resource shortage (CPU/Memory)
- Image pull failure (imagePullBackOff)
- PVC binding pending
- nodeSelector/affinity conditions not met
Failed Pod Analysis
For Failed Pods, check container logs and events:
- OOMKilled: Memory limit exceeded
- CrashLoopBackOff: Repeated crashes
- Error: Application error
AI Analysis
You can analyze with the AI Assistant using queries like "Pending Pod list", "Failed Pod cause analysis", "Pod status in specific namespace", etc.
Related Pages
- EKS Overview - Overall cluster status
- EKS Nodes - Check node resources
- EKS Explorer - Detailed resource exploration
- EKS Container Cost - Pod cost analysis