EKS Nodes
A page for viewing detailed information about Kubernetes node capacity, allocatable resources, and Pod requests.
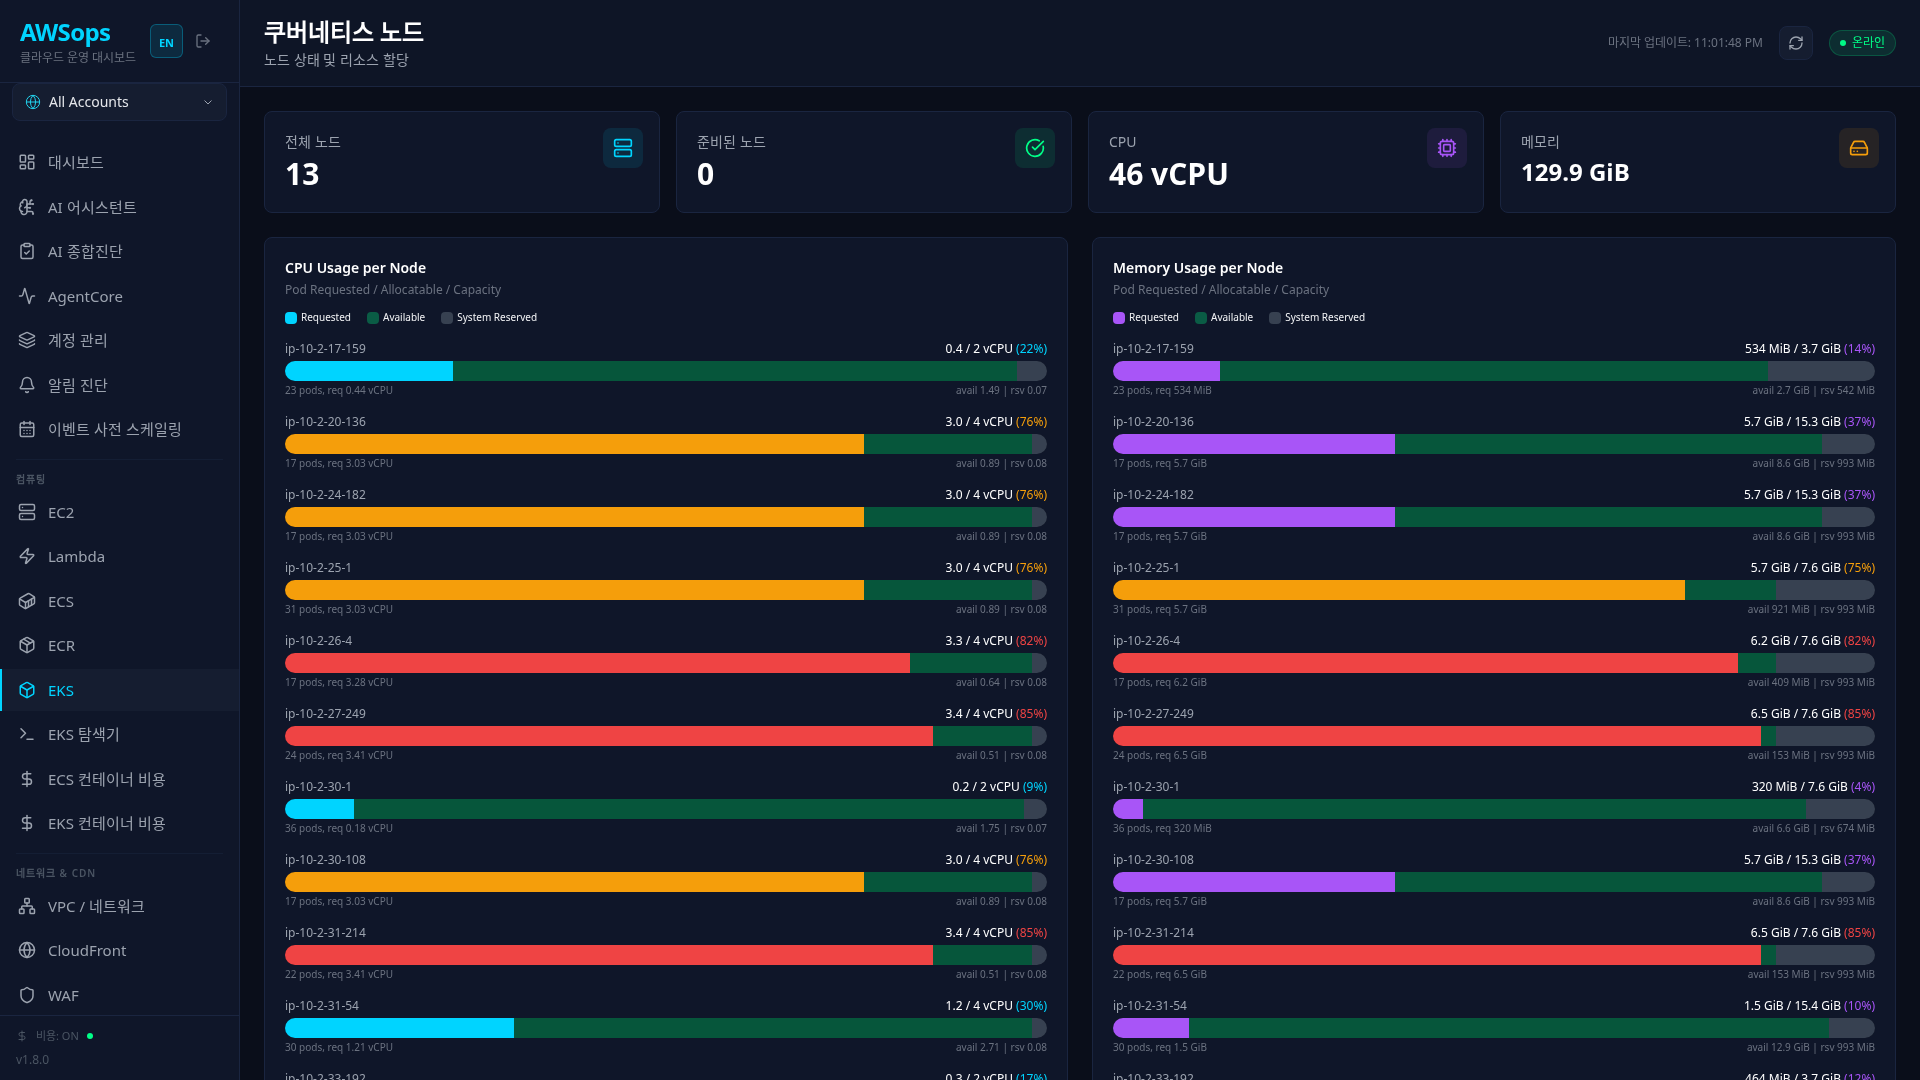
Key Features
Stats Cards
- Total Nodes: Total node count (cyan)
- Ready: Ready status node count (green)
- Total CPU: Total vCPU capacity sum (purple)
- Total Memory: Total memory capacity sum (orange) — with an allocatable total and reserved % (Capacity − Allocatable) hint (omitted when allocatable is unreported)
CPU Usage per Node Chart
Display CPU resource status per node with 3-level bar chart:
- Requested (cyan/orange/red): CPU requested by Pods
- Available (semi-transparent green): Additional allocatable CPU
- System Reserved (gray): CPU reserved by system
Displayed per node:
- Node name, Pod requests / total capacity, percent
- Pod count, requested vCPU, available vCPU, reserved vCPU
Memory Usage per Node Chart
Display Memory resource status per node with the same 3-level bar chart:
- Requested (purple/orange/red): Memory requested by Pods
- Available (semi-transparent green): Additional allocatable Memory
- System Reserved (gray): Memory reserved by system
Capacity Charts
- CPU Capacity per Node (vCPU): Bar chart of CPU capacity per node
- Memory Capacity per Node (GiB): Bar chart of memory capacity per node
Node Table
| Column | Description |
|---|---|
| Name | Node name |
| Status | Ready / NotReady |
| CPU Capacity | Total CPU capacity |
| Memory Capacity | Total memory capacity |
| Allocatable CPU | Allocatable CPU |
| Allocatable Memory | Allocatable memory |
| Created | Creation time |
Node drilldown Pods table
Clicking a node opens the pods-scheduled-on-this-node table — Namespace / Pod / Status / Owner / Pod IP / Service Account / Restarts / CPU / Mem / Age columns ('-' when unknown, e.g. a terminated pod has no IP).
Understanding Resource Concepts
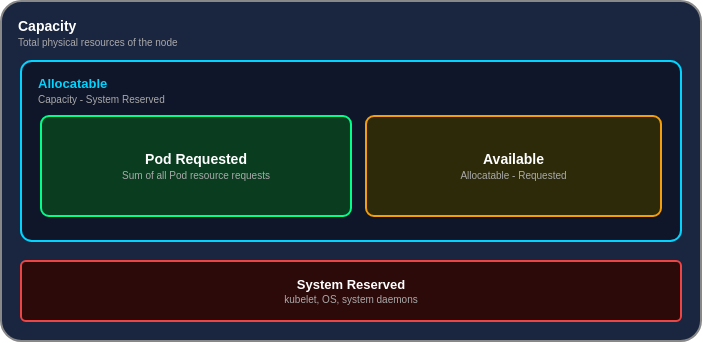
| Term | Description |
|---|---|
| Capacity | Total physical resources of the node |
| Allocatable | Resources allocatable to Pods (Capacity - System Reserved) |
| Requested | Sum of resources currently requested by Pods |
| Available | Additionally allocatable resources (Allocatable - Requested) |
| System Reserved | Resources reserved for system (kubelet, OS, etc.) |
How to Use
- Click Compute > K8s > Nodes in the sidebar
- Review overall node status from the stats cards
- Identify nodes with high resource usage in the CPU/Memory Usage charts
- Consider scaling for nodes at 80% or higher (red)
- Check detailed capacity for each node in the table
Tips
Resource Usage Thresholds
- 80% or higher (red): Immediate action required - add nodes or rebalance Pods
- 50-80% (orange): Monitoring required - check for increasing trend
- Below 50% (cyan/purple): Normal - resources available
Available vs Capacity
Available can become negative. This indicates an overcommitted state where Pods have only Requests set without Limits.
AI Analysis
You can analyze with the AI Assistant using queries like "Node resource usage", "Nodes with CPU over 80%", "Analyze if node scaling is needed", etc.
Related Pages
- EKS Overview - Overall cluster status
- EKS Pods - Check Pod status
- EC2 - EC2 instances underlying nodes
- EKS Container Cost - Node/Pod cost analysis