Why AWSops
Some descriptions here (embedded Steampipe data engine, diagnosis PPTX export, etc.) date from v1 and are being updated incrementally. For the current v2 architecture, refer to the AgentCore overview and the FAQ.
In one line — AWSops is a fully open-source AWS + Kubernetes operations dashboard built entirely on AWS managed services. It pulls AWS APIs fast through Steampipe and caches them locally, and adds Well-Architected AI diagnosis through Amazon Bedrock AgentCore — all in a single pane.
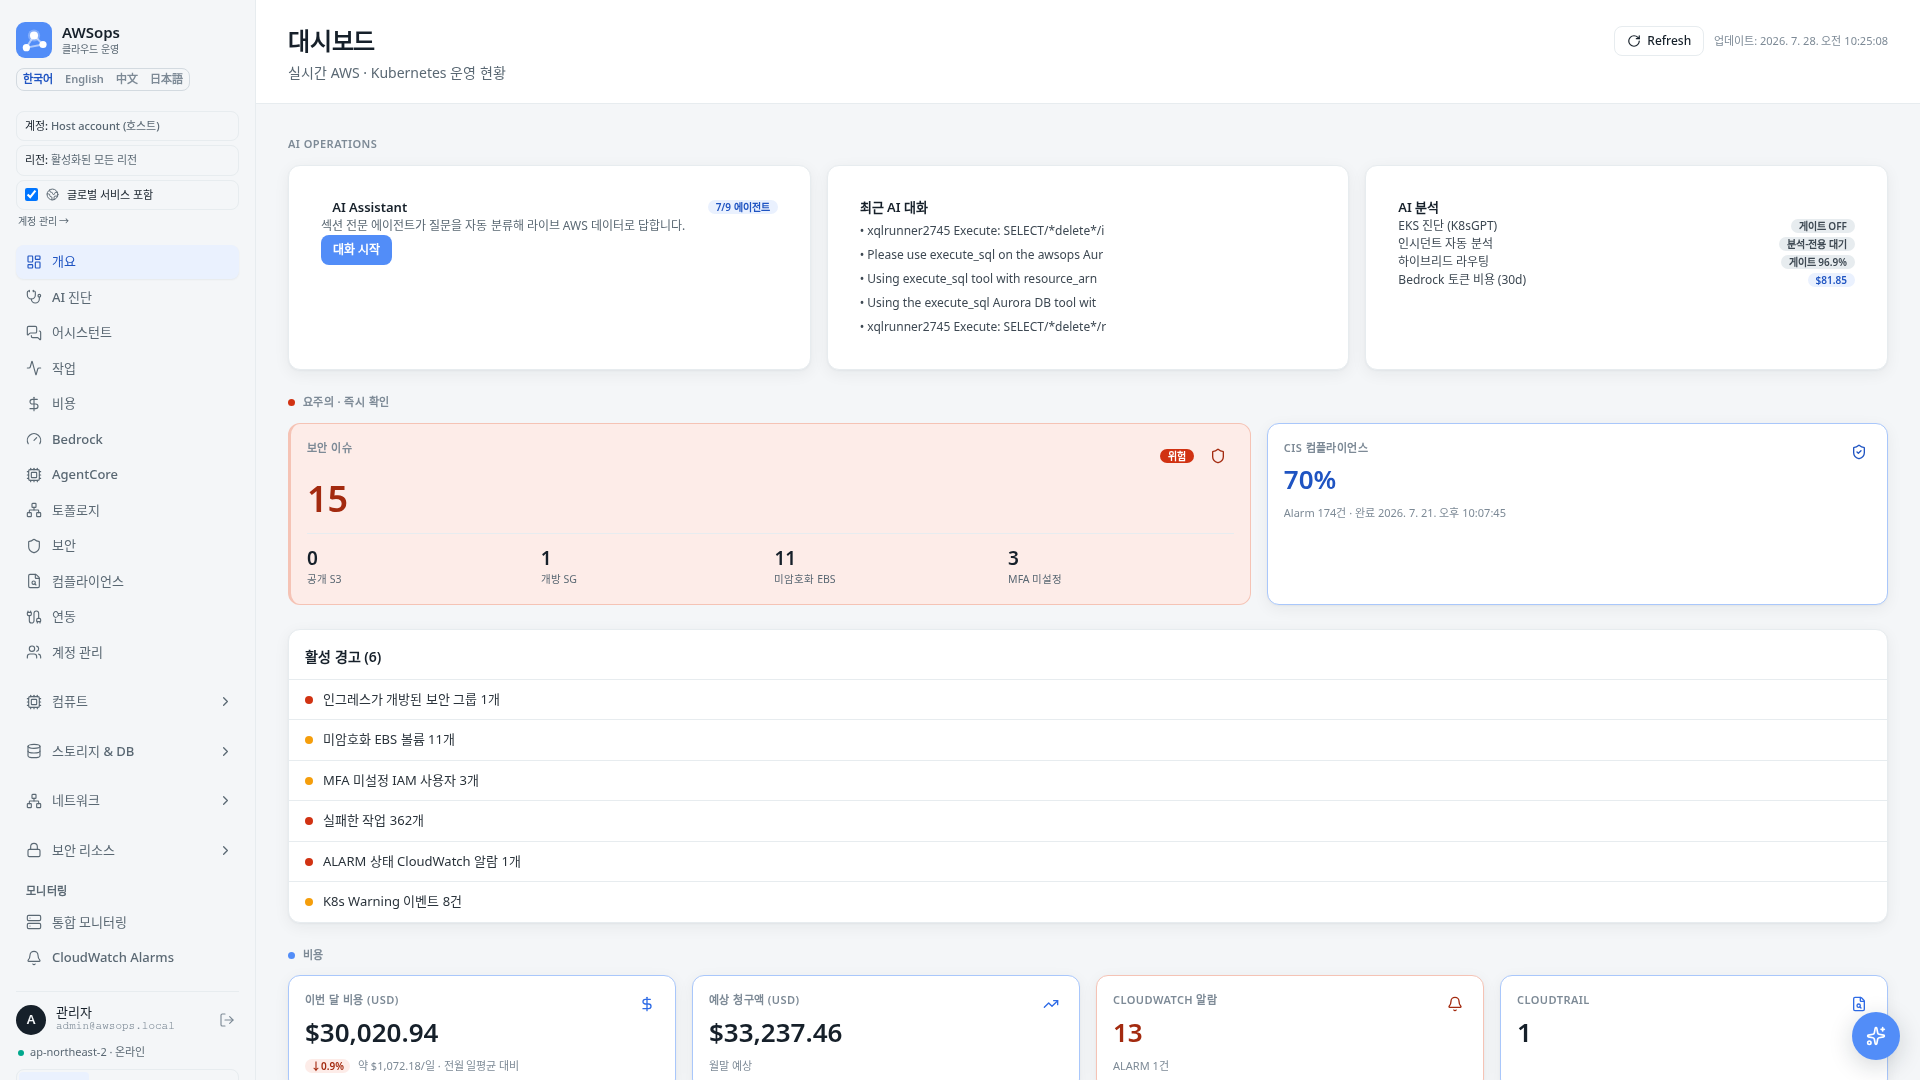
What used to require jumping across dozens of consoles is consolidated into one dashboard + one AI assistant. Below are the differentiators that matter when adopting it in a customer environment.
1. Fully open source · AWS-native (Architecture v1)
- Open source — the entire source is public, so you can deploy it as-is into your own account and adapt it to internal requirements. No vendor lock-in.
- Built only on AWS managed services — no external SaaS dependency:
| Layer | AWS service |
|---|---|
| Edge / Auth | CloudFront + Lambda@Edge + Cognito |
| Compute | EC2 (t4g.2xlarge, ARM64 Graviton, private subnet) + ALB |
| AI | Amazon Bedrock AgentCore (Runtime/Gateway/Code Interpreter/Memory) + Bedrock models |
| IaC | AWS CDK |
- Data, AI, auth, and edge all stay inside AWS, so data governance and compliance stay simple.
"The dashboard itself is built the AWS Well-Architected way" — and because it is open source, that implementation is verifiable, with 32 ADRs (Architecture Decision Records) documenting every design decision.
2. Steampipe — pull AWS APIs fast, cache locally
The data engine is Steampipe (embedded PostgreSQL, port 9193).
- 380+ AWS tables + 60+ Kubernetes tables queryable instantly via SQL — AWS APIs treated as SQL.
- Results are cached for 5 minutes (node-cache); the dashboard's 23 core queries are pre-warmed every 4 minutes by a cache warmer for sub-second responses.
- All queries run only through the pg Pool in
src/lib/steampipe.ts(max 10, 8 sequential batch) — the CLI (steampipe query) is 660× slower and is banned at the code level (ADR-001).
→ Result: instead of refreshing multiple consoles, every resource appears instantly in one view.
3. Built-in AWS resource dashboards (43 pages)
43 pages — EC2, Lambda, ECS/ECR, EKS (Pods/Nodes/Deployments/Services/Explorer), VPC, CloudFront, WAF, EBS, S3, RDS, DynamoDB, ElastiCache, MSK, OpenSearch and more — with live charts and a React Flow topology map. MSK/RDS/ElastiCache/OpenSearch/EBS show inline CloudWatch metrics.
4. Well-Architected AI diagnosis
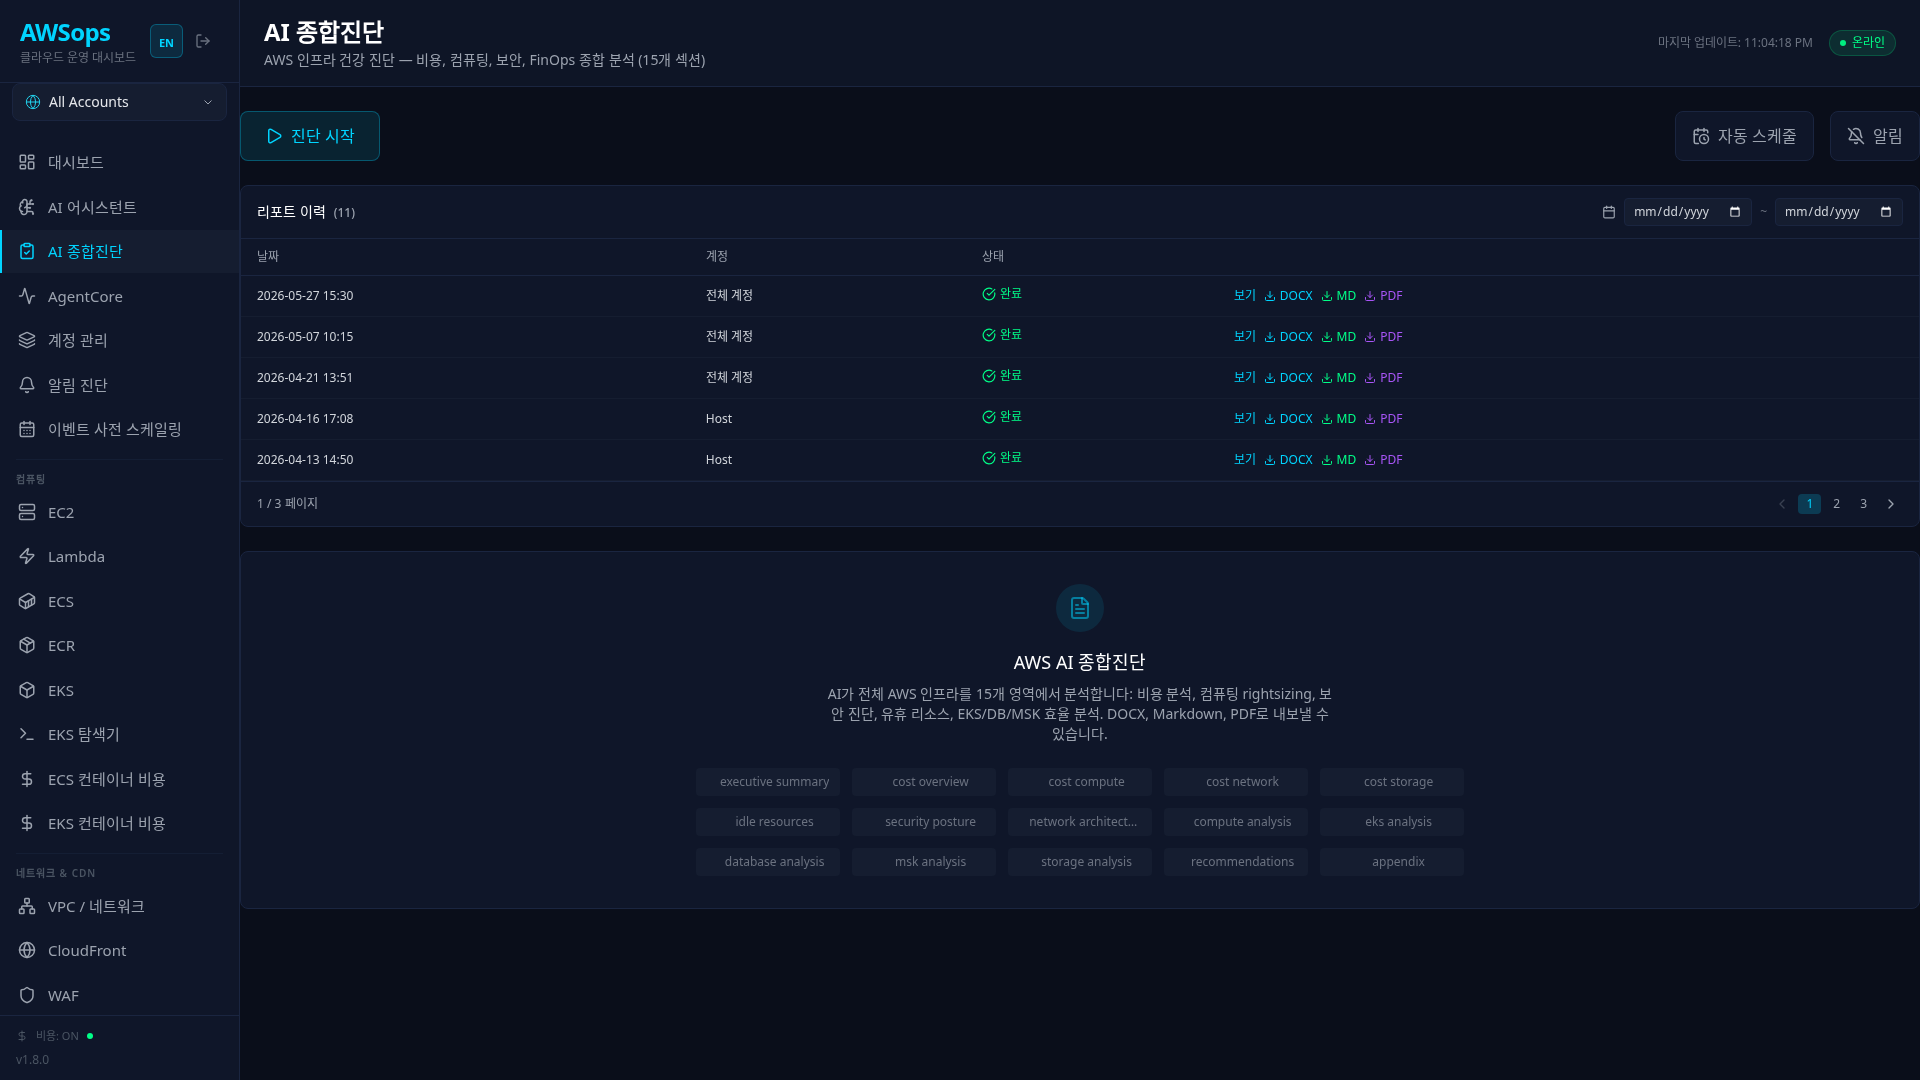
/ai-diagnosis is a tool where Amazon Bedrock Claude Opus 4.8 automatically analyzes the whole infrastructure into a formal report.
- 6-pillar Well-Architected scorecard — the Executive Summary scores all of Operational Excellence, Security, Reliability, Performance Efficiency, Cost Optimization, and Sustainability.
- 3-pillar deep dive (15+1 sections) — Cost Optimization, Security, and Reliability are analyzed in depth (cost overview/compute/network/storage, idle resources, security posture, network/compute/EKS/DB/MSK/storage analysis, etc.).
- DOCX / Markdown / PDF / PPTX export + weekly/biweekly/monthly schedule + email on completion.
Today the deep-dive sections focus on the Cost, Security, and Reliability pillars, while all 6 pillars are synthesized at the Executive Summary scorecard level. Deep-dive sections for the other 3 pillars are on the roadmap.
5. Cost efficient (low TCO)
The operations tool itself is designed to be inexpensive:
- A single EC2 t4g.2xlarge (ARM64 Graviton) runs the Steampipe embedded PostgreSQL alongside the app — no separate managed-DB cost.
- AgentCore is serverless — the AI runtime/gateways bill only on invocation.
- Bedrock models are matched to the task — Sonnet 4.6 for classification/routing, Opus 4.8 for deep diagnosis, Haiku 4.5 for fast/cheap work, with prompt caching (ADR-016).
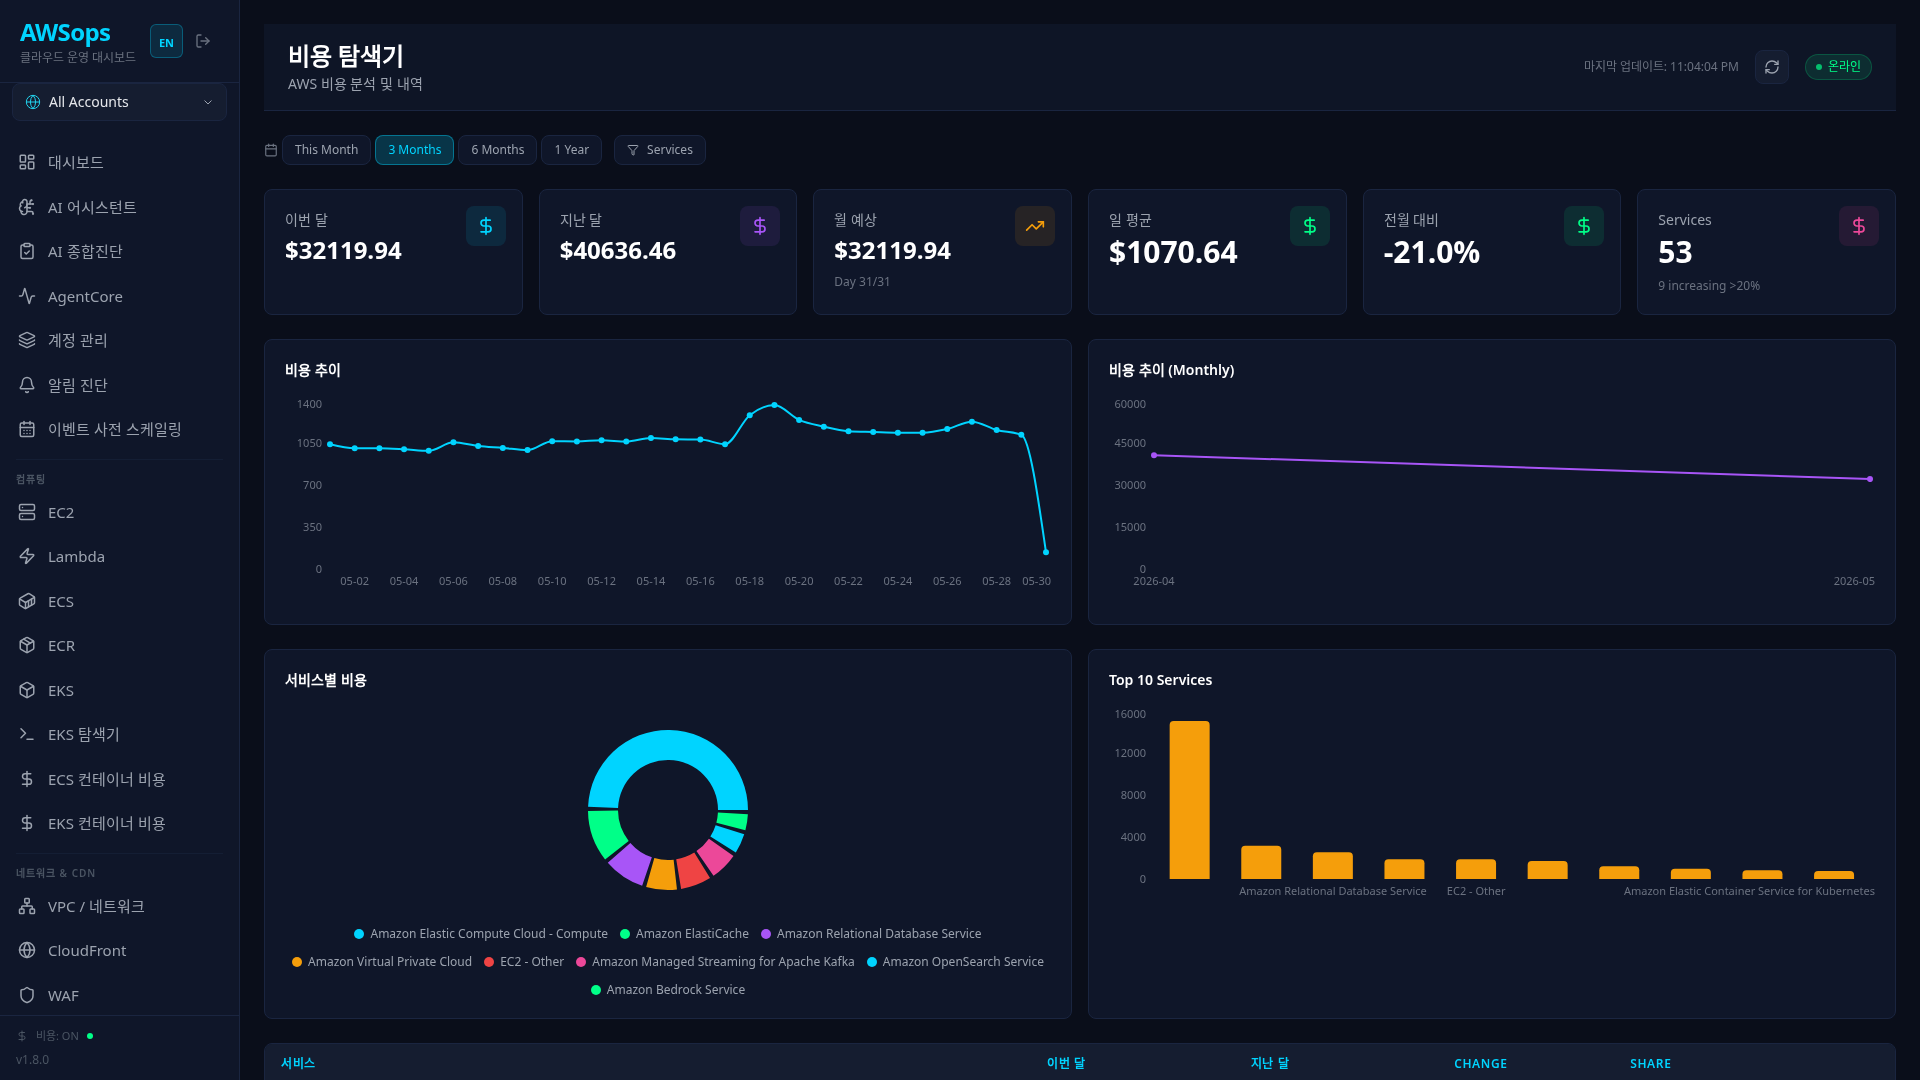
And the tool also reduces the customer's infrastructure cost — Cost Explorer analysis, idle-resource detection, and FinOps recommendations are included in the diagnosis report.
6. Multi-account (single pane)
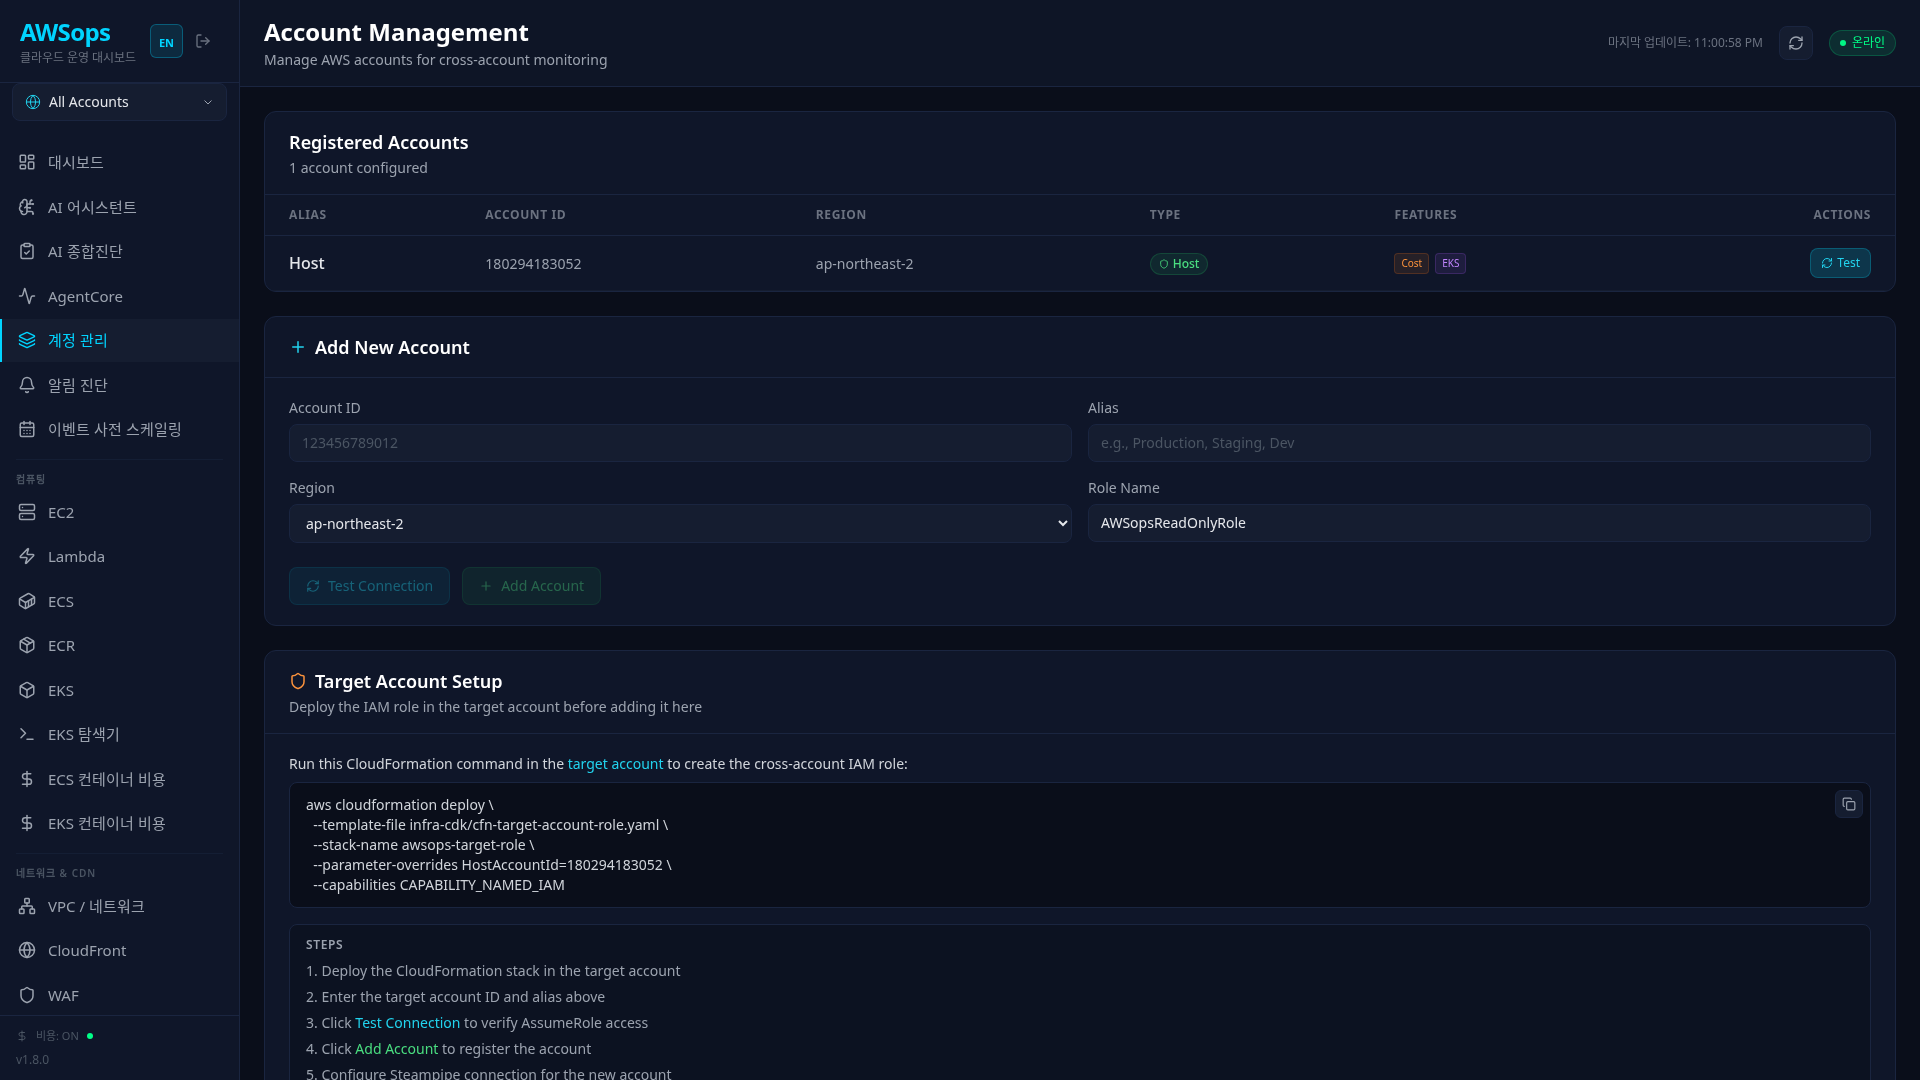
- Steampipe aggregator pattern —
aws= all accounts merged,aws_<id>= a single account. Switch accounts from the top bar or view everything merged. - Adding/removing accounts means editing only the
accounts[]array indata/config.json— no code changes (ADR-008). Cross-account via assume-role.
7. EKS container cost tracking (OpenCost-based)
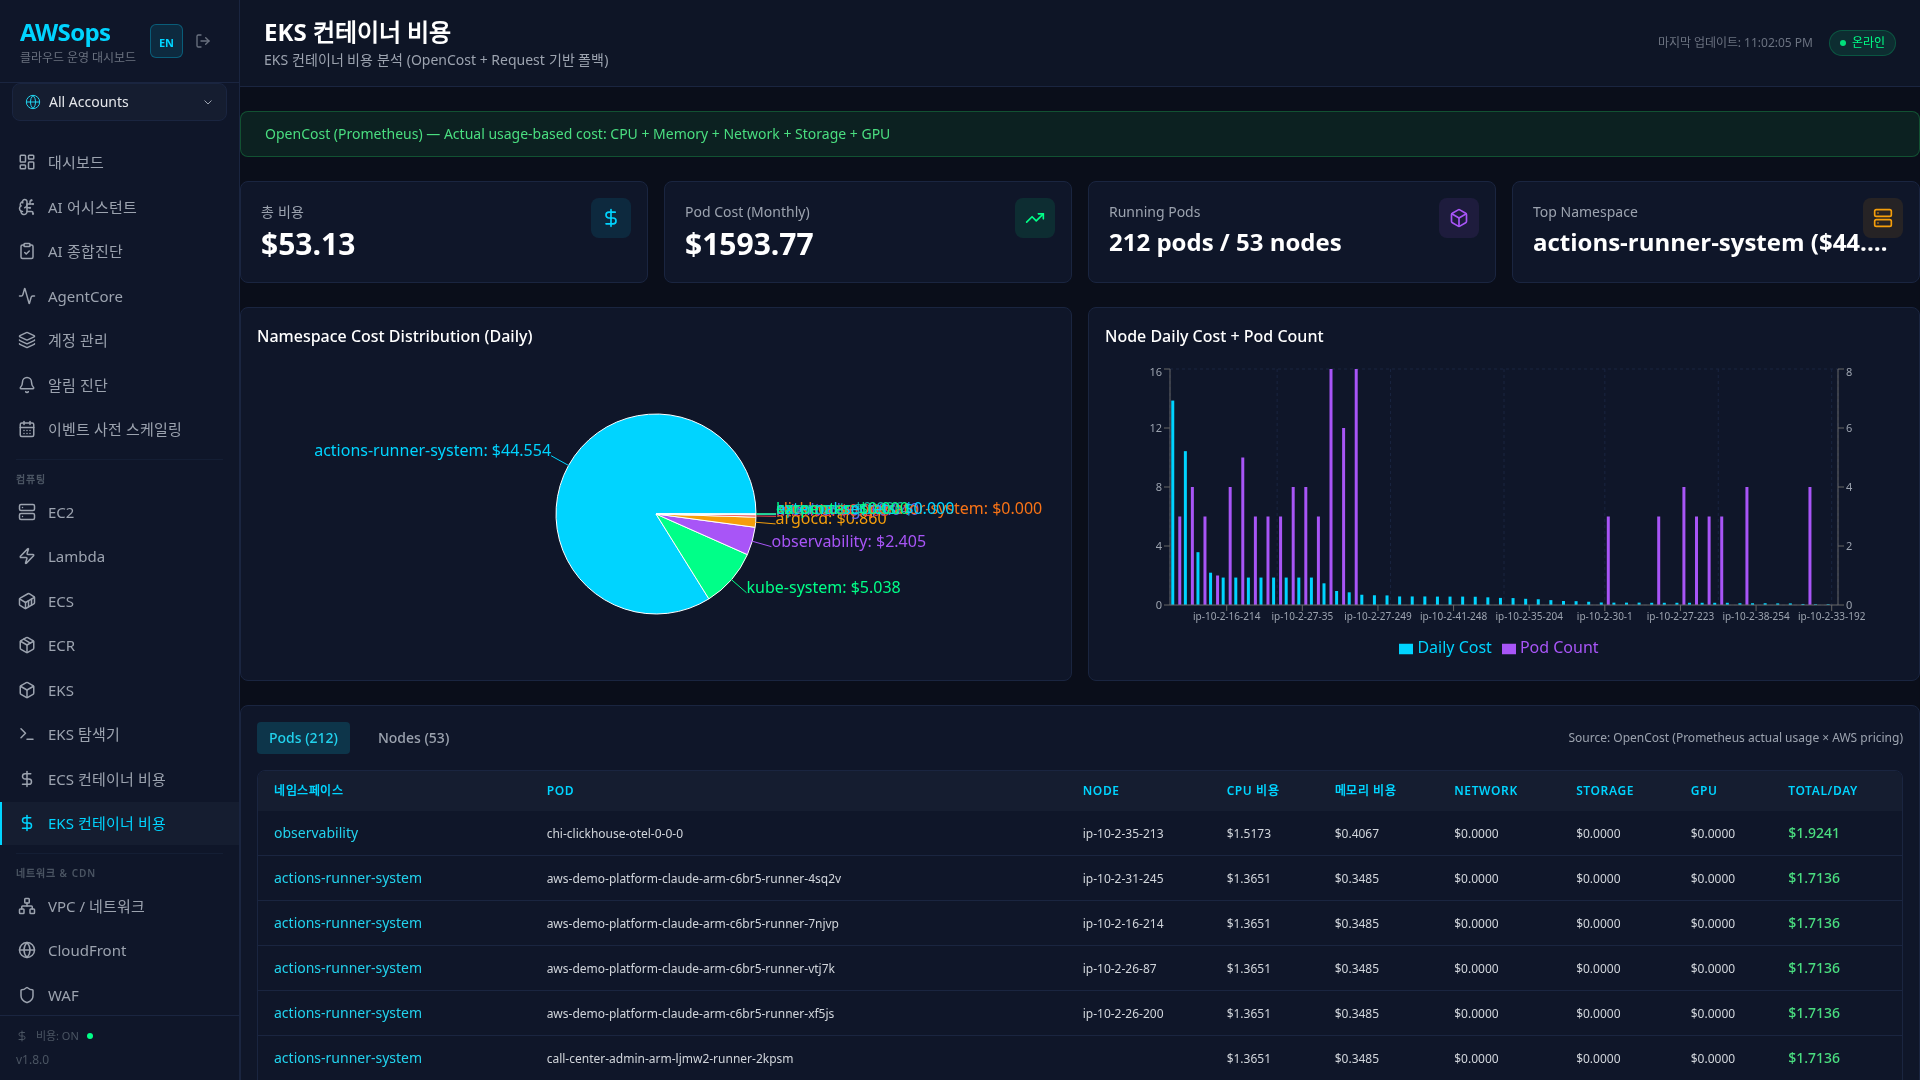
- OpenCost + Prometheus track actual usage-based cost (CPU/Memory/Storage/GPU) per namespace, Pod, and node.
- Without OpenCost, it falls back to request-based estimation.
- ECS is handled separately with CloudWatch Container Insights + Fargate pricing.
8. External observability integration (7 platforms) + 🆕 natural-language queries
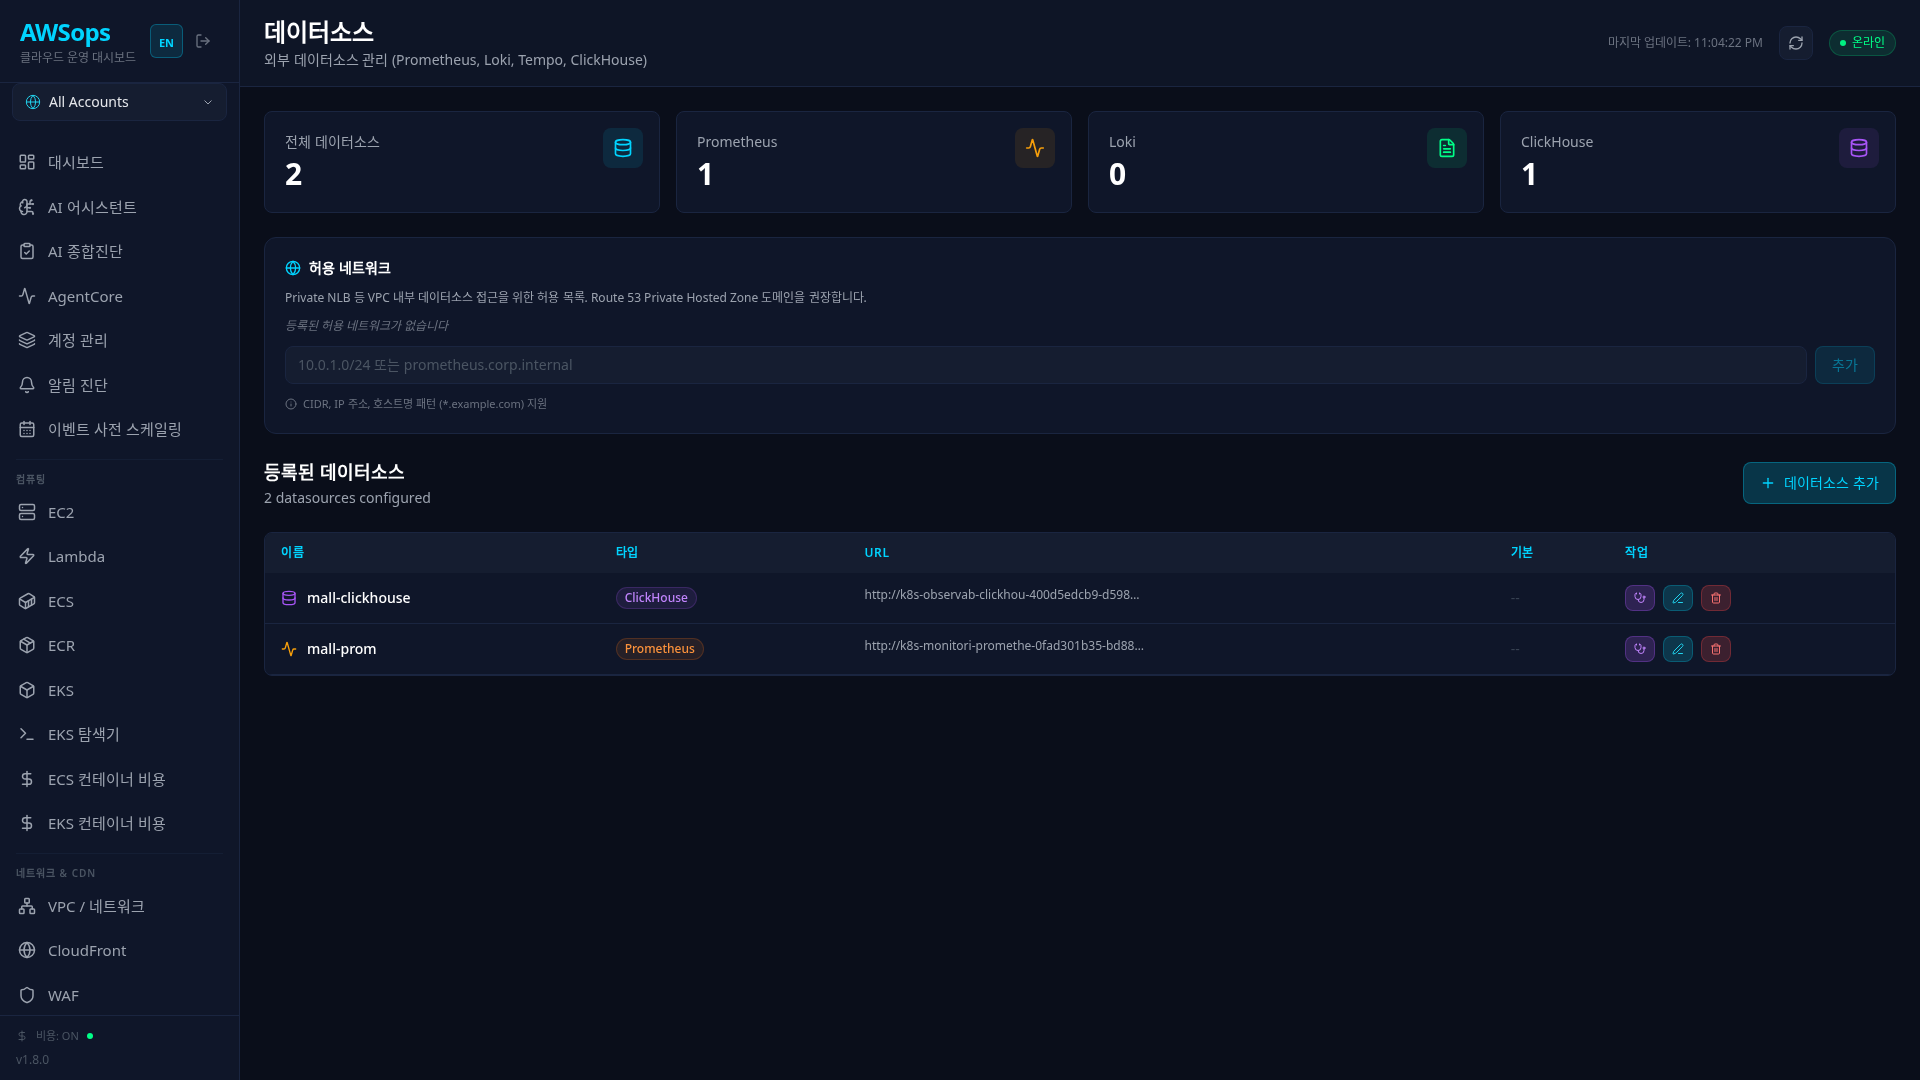
On top of AWS data, AWSops connects your existing observability stack as datasources (SSRF-protected allowlist, ADR-011):
| Type | Platform |
|---|---|
| Metrics | Prometheus · Dynatrace · Datadog |
| Logs | Loki · ClickHouse |
| Traces | Tempo · Jaeger |
Natural language → query generation — in /datasources/explore, type something like "show the 5xx trend for the payment service" and the AI converts it to PromQL / LogQL / TraceQL / SQL and runs it. The AI assistant's datasource route auto-classifies external-metric questions to the same engine.
No need to memorize a different query language per tool — one line of natural language queries Prometheus, Loki, or Jaeger, dramatically lowering the operator's barrier to entry.
Additional strengths visible in the code
| Strength | Detail |
|---|---|
| AI tool architecture | 8 role-based AgentCore gateways · 125 MCP tools · 19 Lambda |
| Multi-route synthesis | the classifier routes a question to 1–3 of 11 routes and calls them in parallel, then synthesizes (ADR-002/025) |
| Alert pipeline | webhook (CloudWatch SNS/Alertmanager/Grafana) → correlation → automatic AI diagnosis → Slack (ADR-009) |
| Event pre-scaling | historical-metric analysis → Bedrock generates multi-phase warm-up plans/scripts (ADR-010, review-then-run) |
| CIS compliance | Powerpipe benchmarks CIS v1.5–v4.0, 431 controls |
| Security design | SSRF allowlist on outbound calls, admin gate (adminEmails), mutating-action gate framework (ADR-029) |
| Design transparency | 32 ADRs — every major decision documented in Korean/English |
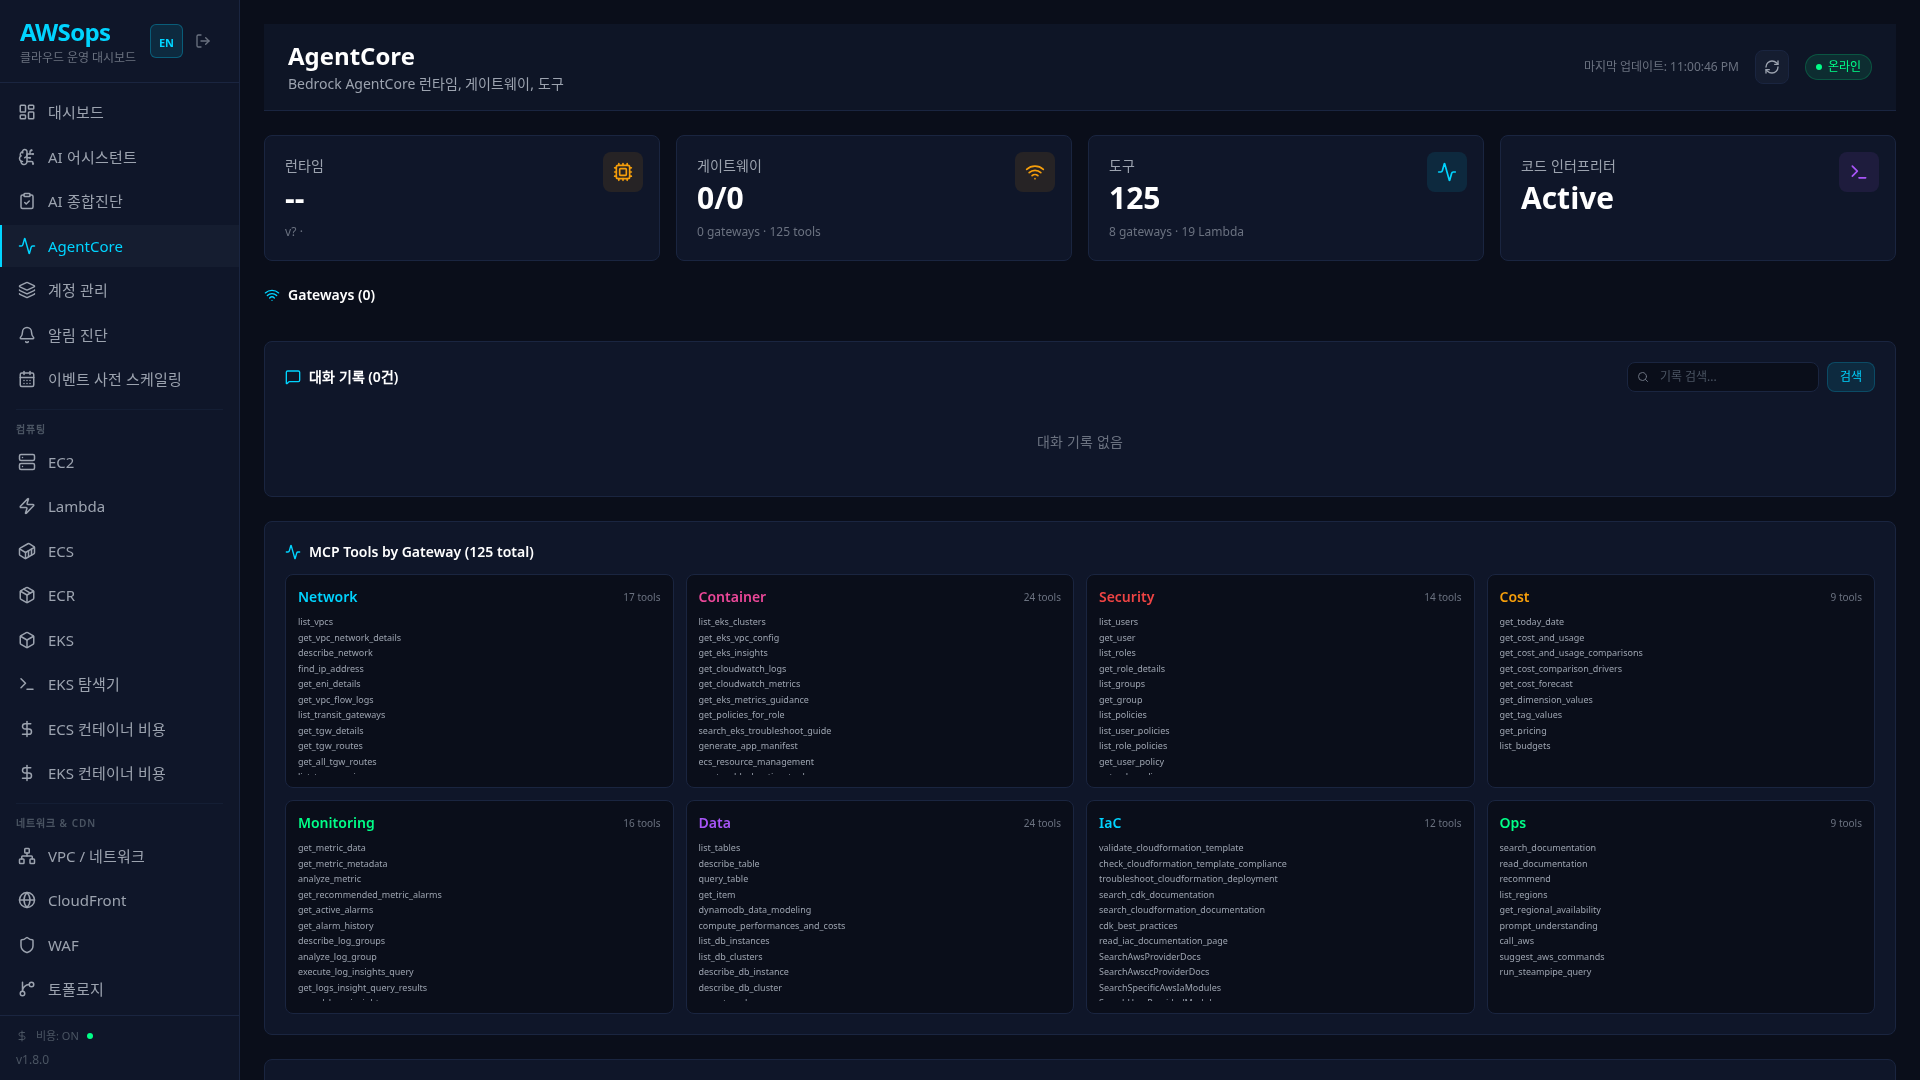
Recommended demo flow (customer session)
- Dashboard — all accounts/resources in one view (demo account switching)
- AI assistant — a natural-language query like "find security groups open to 0.0.0.0/0" → multi-route in action
- AI diagnosis — generate a Well-Architected report → export DOCX/PDF
- EKS container cost — OpenCost per-namespace cost
- Natural-language observability query — auto-generate PromQL in
/datasources/explore - Cost / inventory — trends and savings opportunities