AI Comprehensive Diagnosis
This page was written for the v1 diagnosis screen (fixed 15-section catalog, src/ paths).
Current v2 uses the Light / Mid / Deep (15+1 sections, 16 rendered) tier structure — see
FAQ · AI Assistant for current behavior.
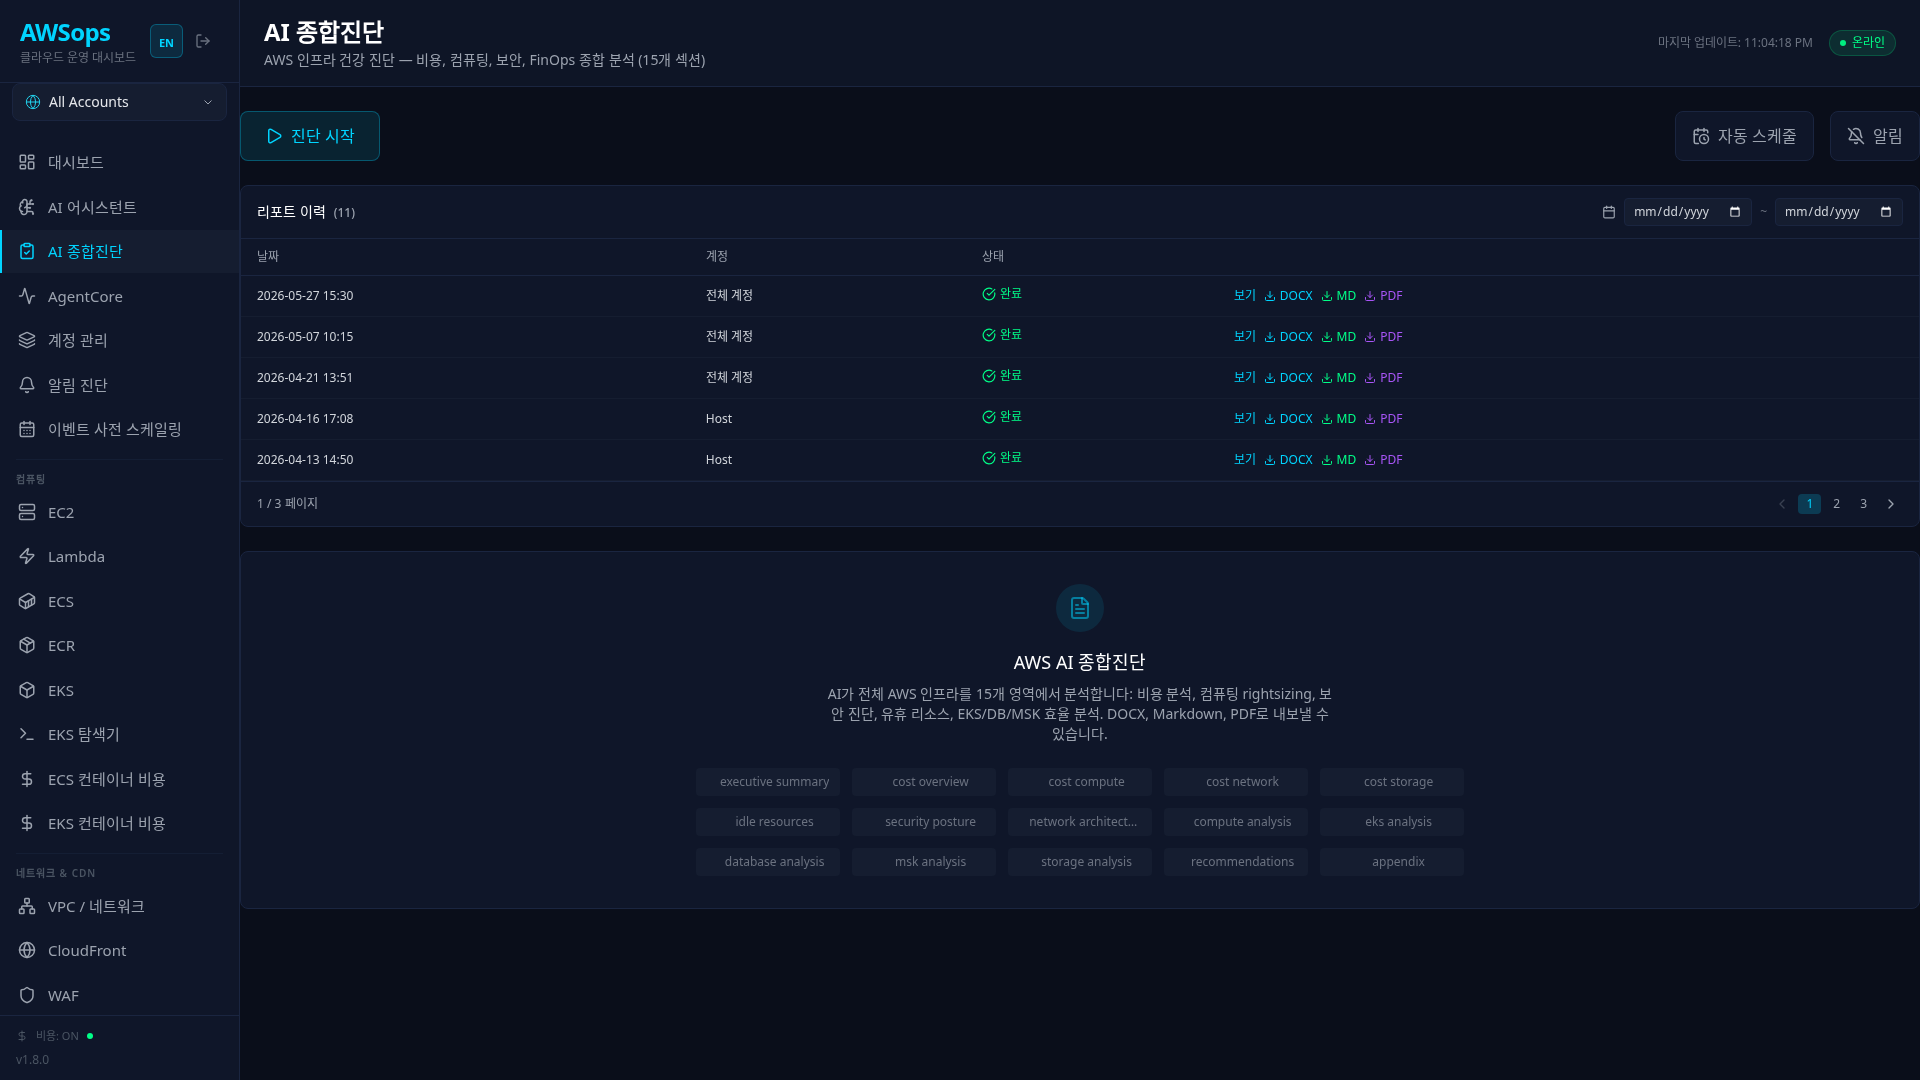
The /ai-diagnosis page generates a 15-section infrastructure analysis report using Amazon Bedrock Claude Opus 4.8.
Overview
| Item | Value |
|---|---|
| Model | global.anthropic.claude-opus-4-8 (fixed) |
| Sections | 15 (4 cost + 6 infra + 2 security/network + 3 summary) |
| Output formats | DOCX (A4 + TOC), Markdown, PDF (browser print) |
| Storage | S3 report bucket + data/reports/*.json cache |
| Progress polling | 5-second SSE |
| Auto schedule | disabled / weekly / biweekly / monthly (KST) |
| Email notifications | PDF attachment to registered recipients on completion |
Page Layout
1. Top Action Bar
- Run Diagnosis — start a full run (avg. 6–10 min for 15 sections)
- Schedule icon — open the auto-schedule panel (admin only)
- Notification icon — manage email recipients (admin only)
- DOCX Download — download the latest completed report immediately
2. Left TOC Sidebar
Expanding a completed report reveals the 15-section TOC; clicking scrolls to that section. Multiple sections can be expanded simultaneously for side-by-side comparison.
3. Report History Table
| Column | Description |
|---|---|
| Created | YYYY-MM-DD HH:MM (KST) |
| Account | Target account alias (in multi-account mode) |
| Status | completed / generating / failed |
| Download | DOCX · MD · PDF |
Pagination: 5 per page; narrow with the date-range filter.
The 15 Sections (Actual Order)
The order in src/lib/report-prompts.ts REPORT_SECTIONS:
| # | Section ID | Korean | English |
|---|---|---|---|
| 1 | cost-overview | 비용 현황 | Cost Overview |
| 2 | cost-compute | 컴퓨팅 비용 심층분석 | Compute Cost Deep Dive |
| 3 | cost-network | 네트워크 전송 비용 | Network & Data Transfer Cost |
| 4 | cost-storage | 스토리지 비용 심층분석 | Storage Cost Deep Dive |
| 5 | idle-resources | 유휴 리소스 & 낭비 | Idle Resources & Waste |
| 6 | security-posture | 보안 현황 | Security Posture |
| 7 | network-architecture | 네트워크 아키텍처 | Network Architecture |
| 8 | compute-analysis | 컴퓨팅 인프라 분석 | Compute Infrastructure |
| 9 | eks-analysis | EKS & 컨테이너 분석 | EKS & Container Analysis |
| 10 | database-analysis | 데이터베이스 분석 | Database Analysis |
| 11 | msk-analysis | MSK & 스트리밍 분석 | MSK & Streaming Analysis |
| 12 | storage-analysis | 스토리지 인프라 분석 | Storage Infrastructure |
| 13 | executive-summary | 종합 요약 | Executive Summary |
| 14 | recommendations | 권장사항 & 로드맵 | Recommendations & Roadmap |
| 15 | appendix | 부록: 리소스 인벤토리 | Appendix: Resource Inventory |
The prompts run starting from cost-overview, but Executive Summary (#13) is synthesized last so it can summarize the other sections. The TOC shows the definition order.
Report Generation Flow
- Click Run Diagnosis → POST
/awsops/api/report(action:generate) collectReportData()collects Steampipe + CloudWatch + Cost Explorer data- The 15
REPORT_SECTIONSare sent to Opus sequentially (~30–60s each) - The page polls GET
?action=status&id=<reportId>every 5s to update progress - On completion:
- DOCX is generated and uploaded to S3
- Markdown is immediately available
- PDF opens a print-friendly page that triggers the browser's Print dialog
- If email notifications are on, recipients receive an alert
Auto Scheduling
The schedule panel (admin only — checked against adminEmails) configures:
| Field | Value |
|---|---|
enabled | true/false |
frequency | weekly / biweekly / monthly |
dayOfWeek | 0 (Sun) – 6 (Sat) — for weekly/biweekly |
dayOfMonth | 1 – 28 — for monthly |
hour | 0 – 23 (KST, default 6 AM) |
accountId | restrict to a single account (blank = all) |
lang | ko / en |
The schedule is persisted to data/report-schedule.json. startScheduler() checks isDue() hourly and triggers as needed. nextRunAt is computed in KST.
For biweekly schedules, if less than 13 days passed since the last run and the next slot is under 7 days away, the scheduler adds +7 days to enforce the minimum spacing (report-scheduler.ts:85-93).
Email Notifications
The notification panel manages a recipient list. When a diagnosis completes:
- Subject:
[AWSops] AI Diagnosis Report — {YYYY-MM-DD} - Body: section count, top recommendations summary, download links
- Attachment: PDF (optional)
Recipients are stored alongside the schedule in data/report-schedule.json (notifEmails).
Export Format Details
| Format | Generation path | Notes |
|---|---|---|
| DOCX | lib/report-docx.ts → API download-docx | A4 light theme, TOC, header/footer/page numbers, markdown → paragraph/table/bullet conversion |
| Markdown | API download-md | Raw source (all 15 sections concatenated) |
/ai-diagnosis/report page + browser Print | White background, A4 page breaks, no extra PDF library (bundle-size hygiene) |
ADR-019: a separate PDF library (Puppeteer, etc.) significantly bloats the Next.js bundle and EC2 memory. Instead we render a print-friendly page and use the browser's Print-to-PDF — equivalent output quality, zero new dependencies.
Integration With the Alert Pipeline
When the alert pipeline (CloudWatch / Alertmanager / Grafana) escalates to critical, a partial diagnosis is triggered (alert-diagnosis.ts):
- Section selection is scoped to the affected services/resources (typically 3–5 sections)
- Completes within 1–2 minutes
- Result is replied into the Slack alert thread
See Alert Pipeline for the full flow.
Troubleshooting
| Symptom | Cause | Fix |
|---|---|---|
| Stuck for 10+ minutes | Steampipe query timeout | Check statement_timeout in next.js log, re-run the offending section only |
| DOCX download fails | S3 upload failure (IAM) | Verify EC2 instance profile has s3:PutObject on the bucket |
| Runs at midnight unexpectedly | dayOfMonth not set | For monthly mode, set explicitly within 1–28 |
| No email received | SNS topic subscription unconfirmed | Click the SNS confirm link in your inbox |
Direct API Usage
# Start a diagnosis
curl -X POST /awsops/api/report \
  -H 'Content-Type: application/json' \
  -d '{"action":"generate","lang":"en"}'

# Check progress
curl '/awsops/api/report?action=status&id=<reportId>'

# List reports (paginated)
curl '/awsops/api/report?action=list&page=1&pageSize=5'

# Update schedule
curl -X POST /awsops/api/report \
  -H 'Content-Type: application/json' \
  -d '{"action":"set-schedule","schedule":{"enabled":true,"frequency":"weekly","dayOfWeek":1,"hour":6,"lang":"en"}}'
Related Pages
- Alert Pipeline — partial diagnosis trigger
- Resource Inventory — Appendix section data source
- Compliance — Security Posture section source
- Cost Explorer — source for the 4 cost sections
References
- ADR-019: report format matrix
- ADR-014: report proxy download URLs
- ADR-016: Bedrock model selection (Opus 4.8 pinned)
src/lib/report-prompts.ts— 15-section prompt definitions (exact output structure)src/lib/report-scheduler.ts— schedule computation (KST)