Monitoring Overview
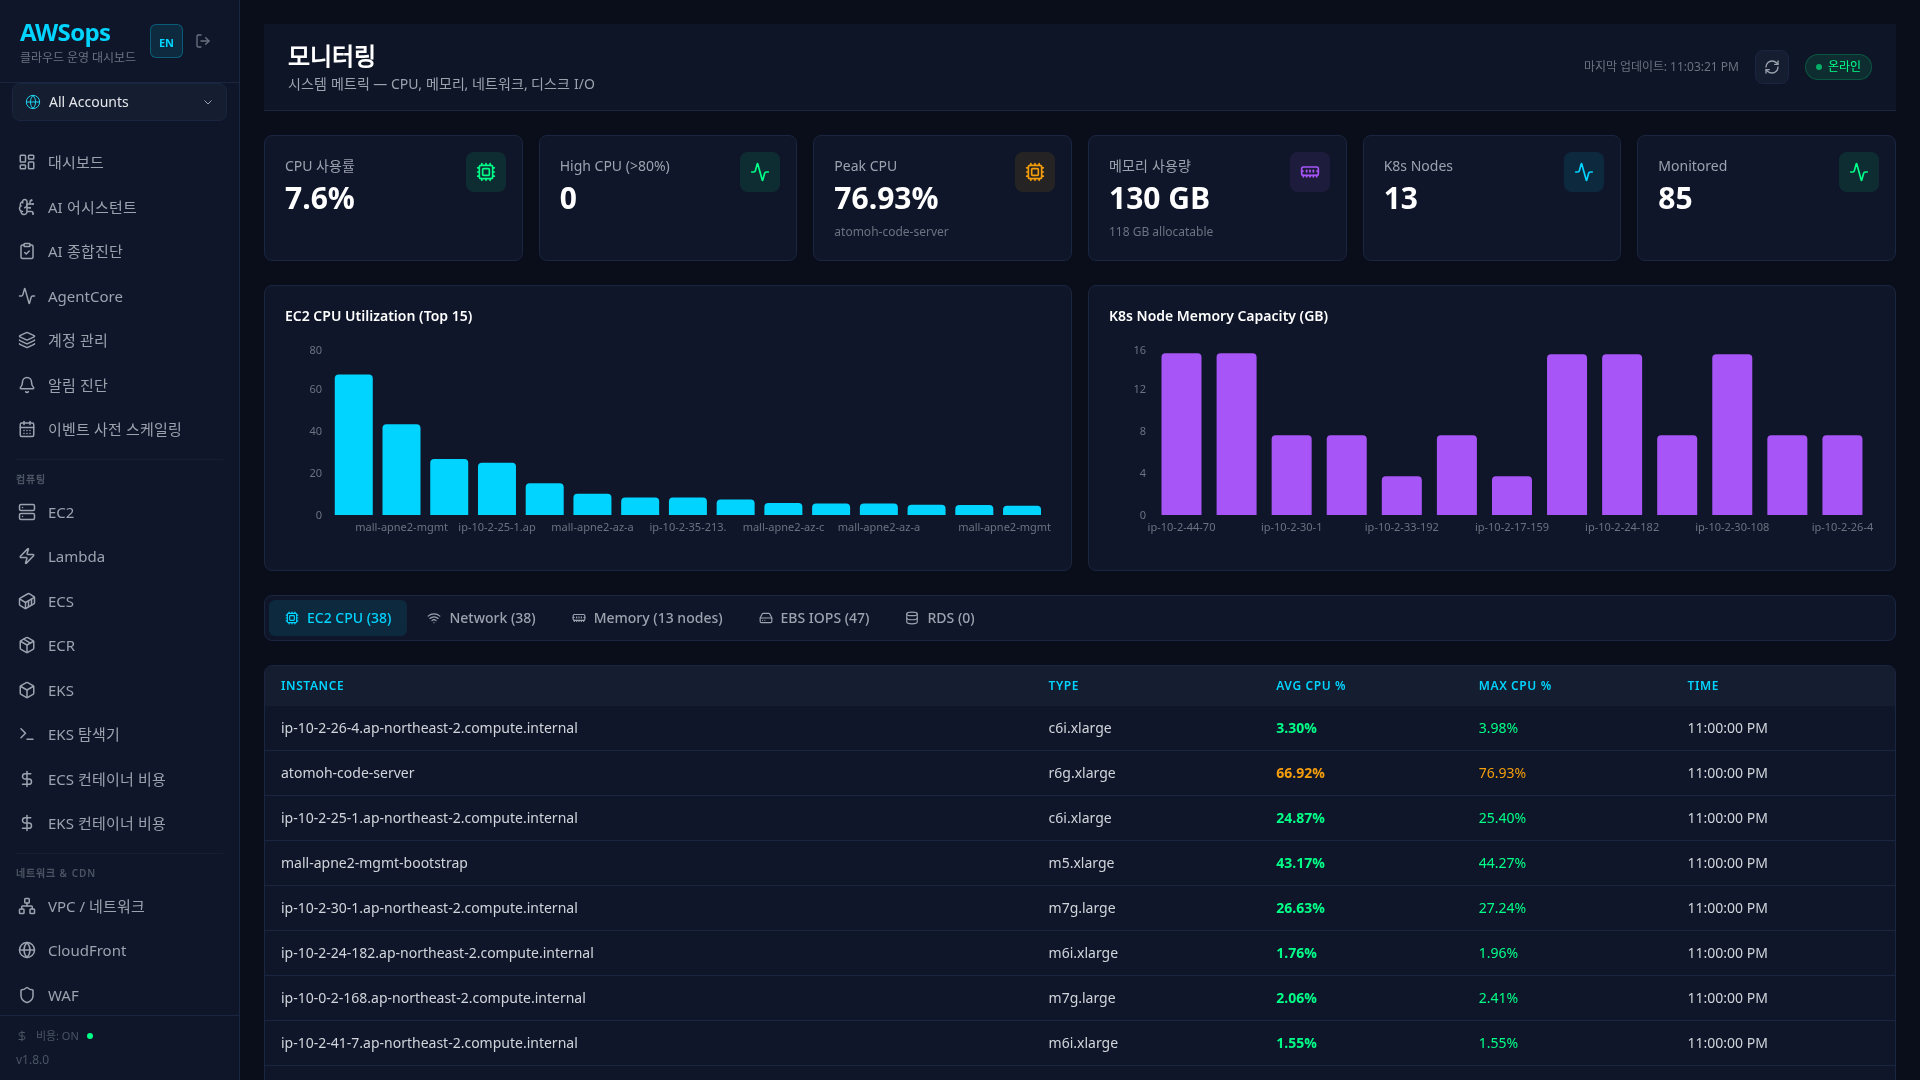
A comprehensive monitoring page that displays performance metrics across your AWS infrastructure in a single view.
Key Features
Unified Dashboard
- EC2 CPU: Average/maximum CPU utilization per instance
- Network I/O: Network In/Out traffic per instance (MB/h)
- K8s Memory: Memory capacity, allocation, and Pod count per node
- EBS IOPS: Read/Write IOPS per volume
- RDS: Database CPU, connections, FreeableMemory
Tab Views
| Tab | Content |
|---|---|
| EC2 CPU | CPU utilization table per instance, click for time-series chart |
| Network | Network In/Out traffic, 24-hour trend graph |
| Memory | K8s node resources + RDS FreeableMemory |
| EBS IOPS | Read IOPS per volume, hourly trend |
| RDS | CPU, connection count, daily trend |
Instance Detail Metrics
Click on an EC2 instance row to view detailed metrics:
- CPUUtilization, NetworkIn/Out, DiskReadOps, DiskWriteOps
- Time range filter: 1h, 6h, 24h, 7d, 30d
- Average/maximum values per metric
How to Use
- Select Tab: Choose the resource type to monitor (EC2 CPU, Network, Memory, EBS, RDS)
- Sort Table: Click column headers to sort
- View Details: Click a row to show slide panel or detail view
- Refresh: Click the refresh button in the top right to fetch latest data
- Green: Normal (CPU < 50%)
- Orange: Warning (CPU 50-80%)
- Red: Critical (CPU > 80%)
Usage Tips
Identifying High CPU Instances
Check the "High CPU (>80%)" StatsCard at the top for immediate visibility. Click the number to filter to those instances.
K8s Memory Reservation Check
In the Memory tab, check the Reserved % column for K8s nodes. Excessively high system reserved memory can affect Pod scheduling.
RDS Memory Monitoring
Click on an RDS row to view the FreeableMemory graph. Consistently low values may indicate the need for instance size upgrade.
EC2 detailed metrics provide 1-minute granularity data only for instances with CloudWatch detailed monitoring enabled. Basic monitoring provides 5-minute intervals.
AI Analysis Tips
Use the Monitoring Gateway (17 tools) in the AI Assistant for deeper analysis:
- "Analyze the cause of high CPU utilization on EC2 instances"
- "Analyze network traffic patterns over the last 7 days"
- "Find the cause of RDS connection spike"
- "Tell me when K8s nodes are expected to run out of memory"
Related Pages
- CloudWatch - Alarm management
- Cost Explorer - Cost analysis
- Resource Inventory - Resource count trends