Resource Inventory
A page for tracking daily changes in AWS resource counts and estimating cost impact.
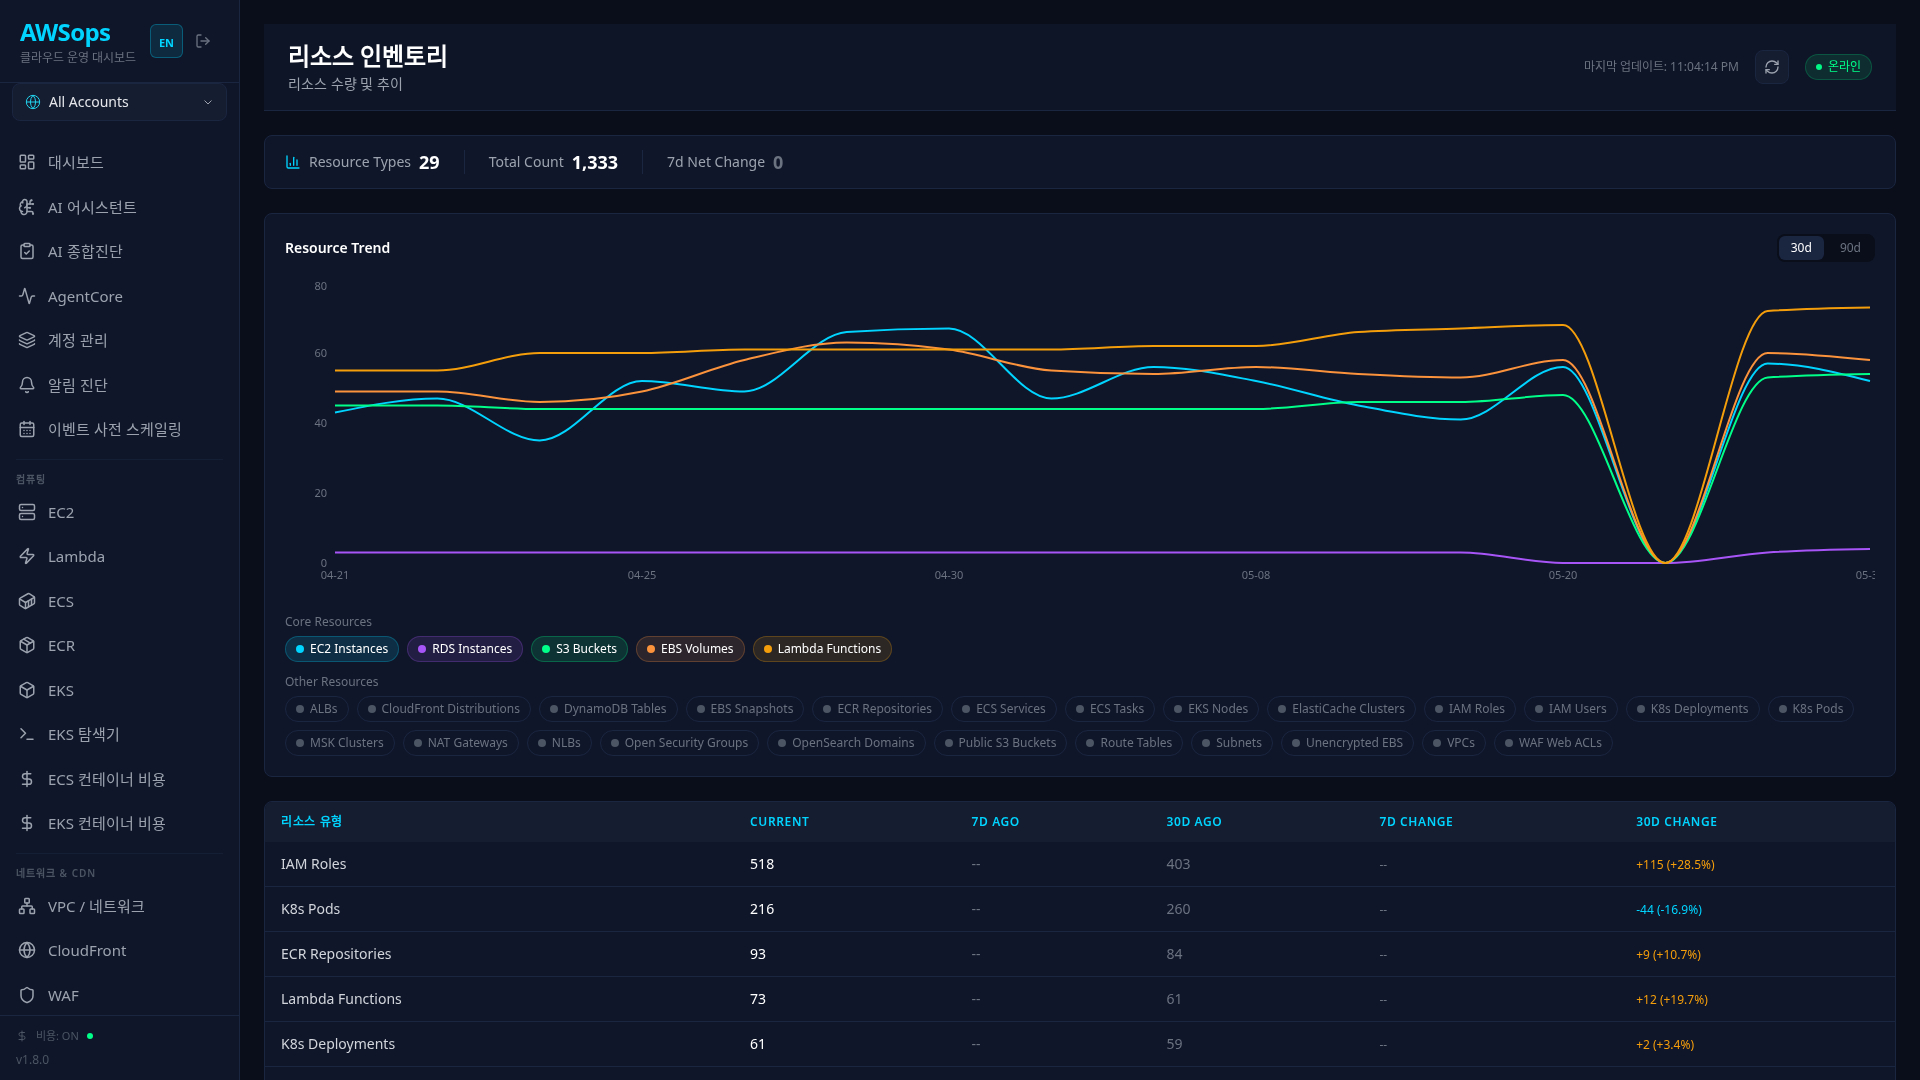
Key Features
Summary Statistics
- Resource Types: Number of resource types being tracked
- Total Count: Total resource count
- 7d Net Change: Net change over 7 days
Resource Trend Graph
- Multi-line chart visualizing resource count trends by type
- Time range toggle: 14 days (default) / 30 days / 90 days
- Resource type toggles to select which resources to display
- Scoped by the account selector at the top (per-account history accrues from when this feature was deployed; there is no region dimension). When the two compared days differ in per-type account coverage (an account silent for that type's sync), the net change / delta / cost impact render '—' instead of a fabricated number. Narrowing the REGION scope (snapshots have no region dimension) renders the net-change KPI as '—' and hides the cost-impact panel
- Derived security series (Public S3 Buckets / Open Security Groups / Unencrypted EBS) are recorded on every sync with the same criteria as the Security page, and are excluded from the overall total to avoid double-counting their underlying resources; the Public S3 Buckets series is host-account-only (the S3 public-access collection is a host SDK sweep — the same scope the Security page reads)
Series Toggle Groups
Chart series are ranked dynamically by the latest snapshot counts, not a fixed list:
- Core Resources: the top 5 real resource types by count — shown by default
- Other Resources: up to the next 3 types — hidden by default (click a chip to show)
- Remaining types don't chart, but all of them appear in the delta table below
Security Series (hidden by default, own toggle group)
- Public S3 Buckets, Open Security Groups, Unencrypted EBS — derived counts using the Security page's criteria, excluded from the overall total
Resource Table
| Column | Description |
|---|---|
| Resource | Resource type |
| Current | Current count |
| 7d Ago | Count 7 days ago |
| 30d Ago | Count 30 days ago |
| 7d Change | 7-day change amount and rate |
| 30d Change | 30-day change amount and rate |
Cost Impact Estimation
Estimates monthly cost impact based on resource count changes:
- RDS Instances: $200/month (estimated)
- ElastiCache Clusters: $100/month
- NAT Gateways: $45/month
- EC2 Instances: $80/month
- Weight factors applied for other resources
How to Use
- Check Trends: Review resource count change patterns in the graph
- Change Time Range: Toggle between 14d (default)/30d/90d for the analysis period
- Select Resources: Use toggle buttons to show only resources of interest
- Analyze Table: Review detailed numbers and change rates
- Cost Impact: Check the cost estimation section at the bottom
Snapshots are written per account to Aurora (inventory_snapshots) on every inventory sync run. A run with partial SDK collection writes no snapshots at all, while a run with some accounts unreachable still writes fresh rows for every reachable account and preserves only the unreachable account's prior row — which is why an individual (account, type) daily point can be missing — independent of dashboard loads, and reading them makes no additional AWS API calls.
Usage Tips
Tracking Resource Growth
Check resources highlighted in orange (increase) in the 7d Change or 30d Change columns. Unexpected increases may be causing cost spikes.
Security Resource Monitoring
Pay attention to changes in these resources:
- Public S3 Buckets: Increase may indicate data exposure risk
- Open Security Groups: Increase may indicate security vulnerabilities
- Unencrypted EBS: Compliance issues
Interpreting Cost Impact
In the Cost Impact Estimation section:
- Positive (+): Expected cost increase
- Negative (-): Expected cost decrease
Actual costs may vary depending on instance types, usage, etc.
Snapshot data is stored in the Aurora inventory_snapshots table. The trend query reads at most the last 90 days (older rows are simply not queried).
AI Analysis Tips
Example questions for AI Assistant:
- "Analyze which resources increased the most over the last 30 days"
- "If this resource growth trend continues, how much will the monthly cost be?"
- "Summarize security-related resource changes"
- "Recommend items that need resource cleanup"
Related Pages
- Cost Explorer - Actual cost analysis
- Security Overview - Security resource details
- Monitoring Overview - Performance monitoring