Cost Explorer
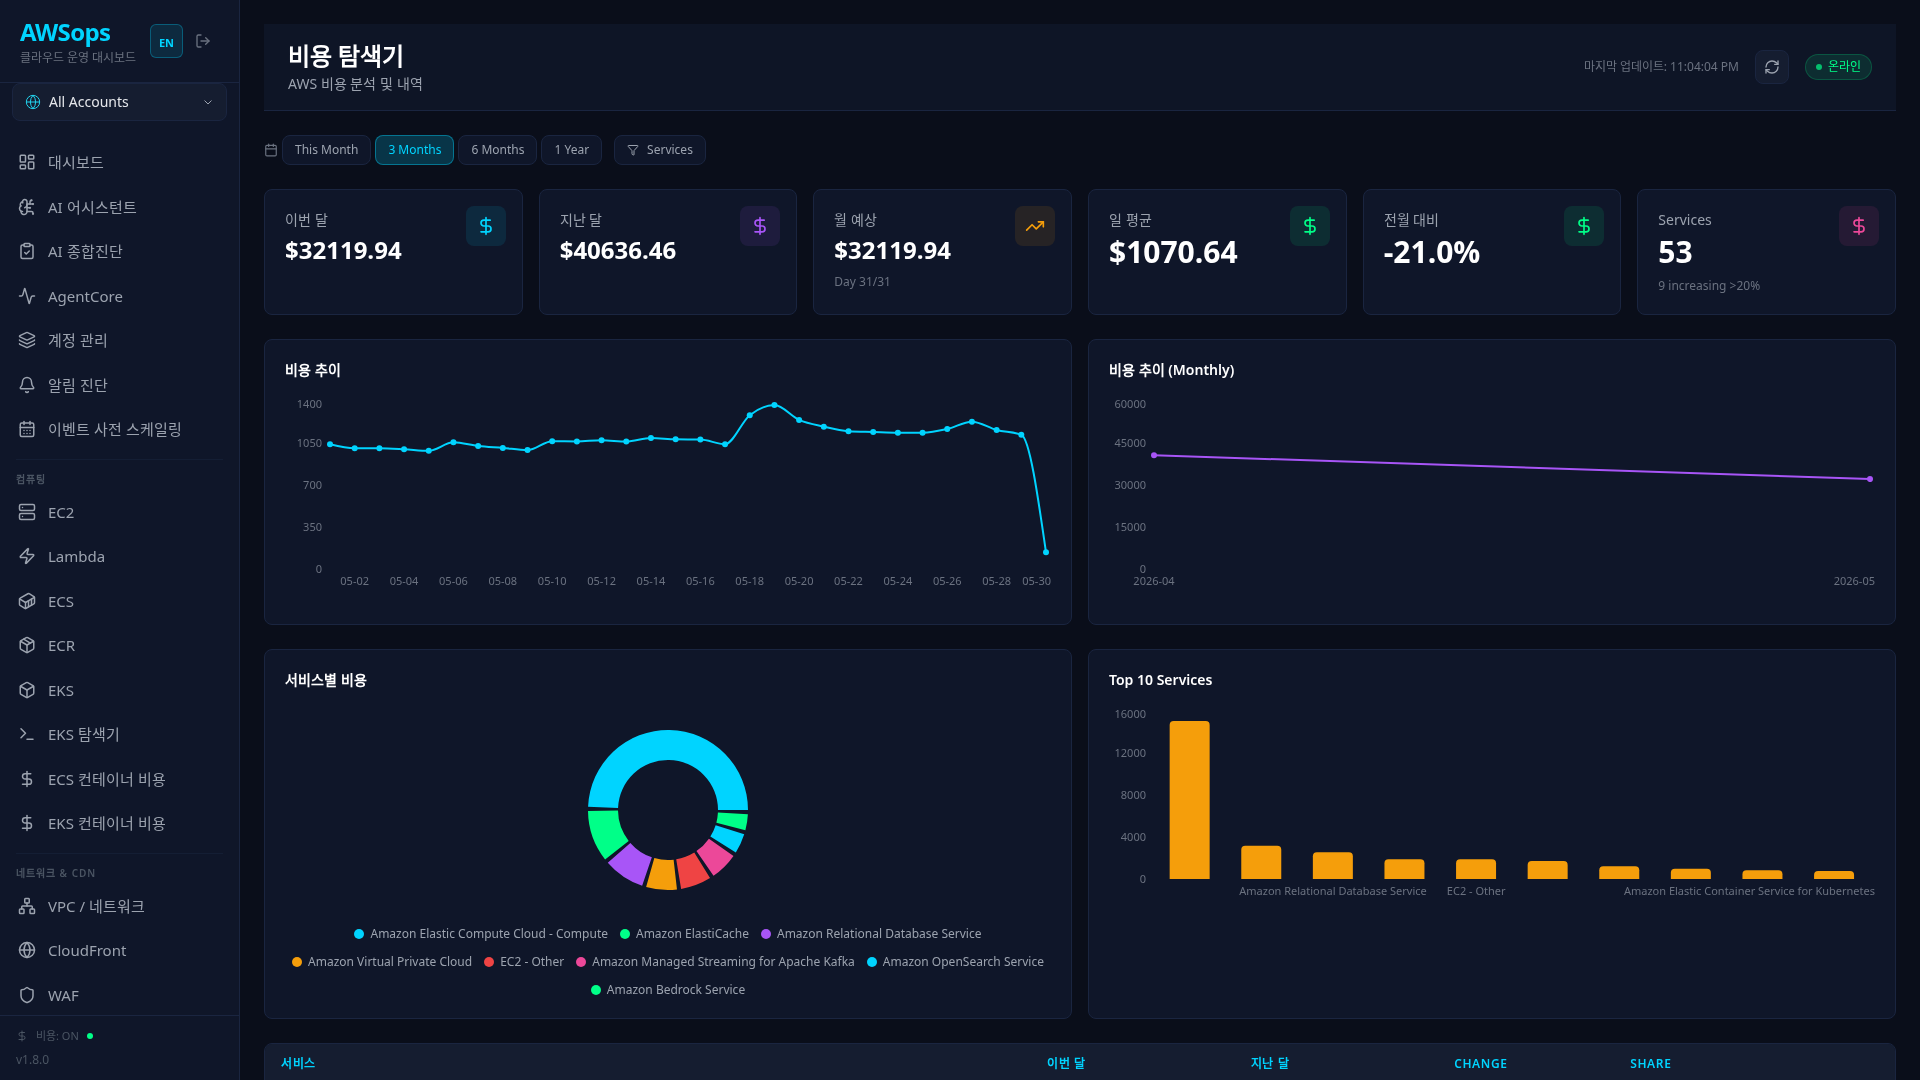
A page for analyzing and visualizing AWS cost data from various perspectives.
Key Features
Cost Summary
- This Month: Month-to-date accumulated cost
- Last Month: Total cost from previous month
- Projected: Projected end-of-month cost (estimated based on current date)
- Daily Avg: Daily average cost
- MoM Change: Month-over-month change rate
- Services: Number of services incurring costs
Time Range Filter
| Option | Description |
|---|---|
| This Month | Current month only |
| 3 Months | Last 3 months |
| 6 Months | Last 6 months |
| 1 Year | Last 1 year |
Service Filter
Select specific services to analyze. When multiple services are selected, the sum of those services is displayed.
Visualizations
- Daily Cost Trend: Daily cost trend for the last 30 days
- Monthly Cost Trend: Monthly cost trend
- Cost by Service (Top 8): Pie chart showing top 8 services by cost share
- Top 10 Services: Bar chart showing top 10 services
Service Details
Click on a service row to view in the slide panel:
- Total cost per service
- Monthly cost trend line chart
- Monthly breakdown details
How to Use
- Select Time Range: Choose the analysis period (1m, 3m, 6m, 12m)
- Service Filter: Click the Services button to filter specific services
- Check Charts: Review cost trends and service distribution
- Detailed Analysis: Click a service row for monthly breakdown
In Managed Service Provider (MSP) environments, Cost Explorer API access may be restricted. AWSops automatically detects this and displays alternative data.
Usage Tips
Identifying Cost Spike Causes
- If MoM Change is high (>10%), check the Change column in the service table
- Click services with Change >20% to view monthly trends
- If there was a spike in a specific month, check resource change history for that period
Budget Management
Check the Projected value for end-of-month cost estimate. If you're likely to exceed budget:
- Clean up unused resources
- Review Reserved Instances/Savings Plans
- Optimize resource sizing
Identifying Cost Optimization Targets
Review services with high cost share in the Share column as priority optimization candidates.
In environments where Cost Explorer is disabled, snapshot data is displayed. A "Showing cached data" banner appears along with the last cache timestamp.
costEnabled Toggle
Use the Cost toggle at the bottom of the sidebar to enable or disable Cost Explorer functionality. Disable it in MSP environments to reduce API calls.
AI Analysis Tips
Example questions using the Cost Gateway (11 tools) in AI Assistant:
- "Analyze why costs increased this month"
- "Recommend EC2 cost optimization strategies"
- "Calculate savings if we convert to Reserved Instances"
- "Show 3-month cost forecast by service"
- "Analyze costs by tag"
Related Pages
- Resource Inventory - Resource counts and cost impact
- ECS Container Cost - ECS container costs
- EKS Container Cost - EKS container costs