ECS (Elastic Container Service)
A page for monitoring the status of ECS clusters, services, and tasks.
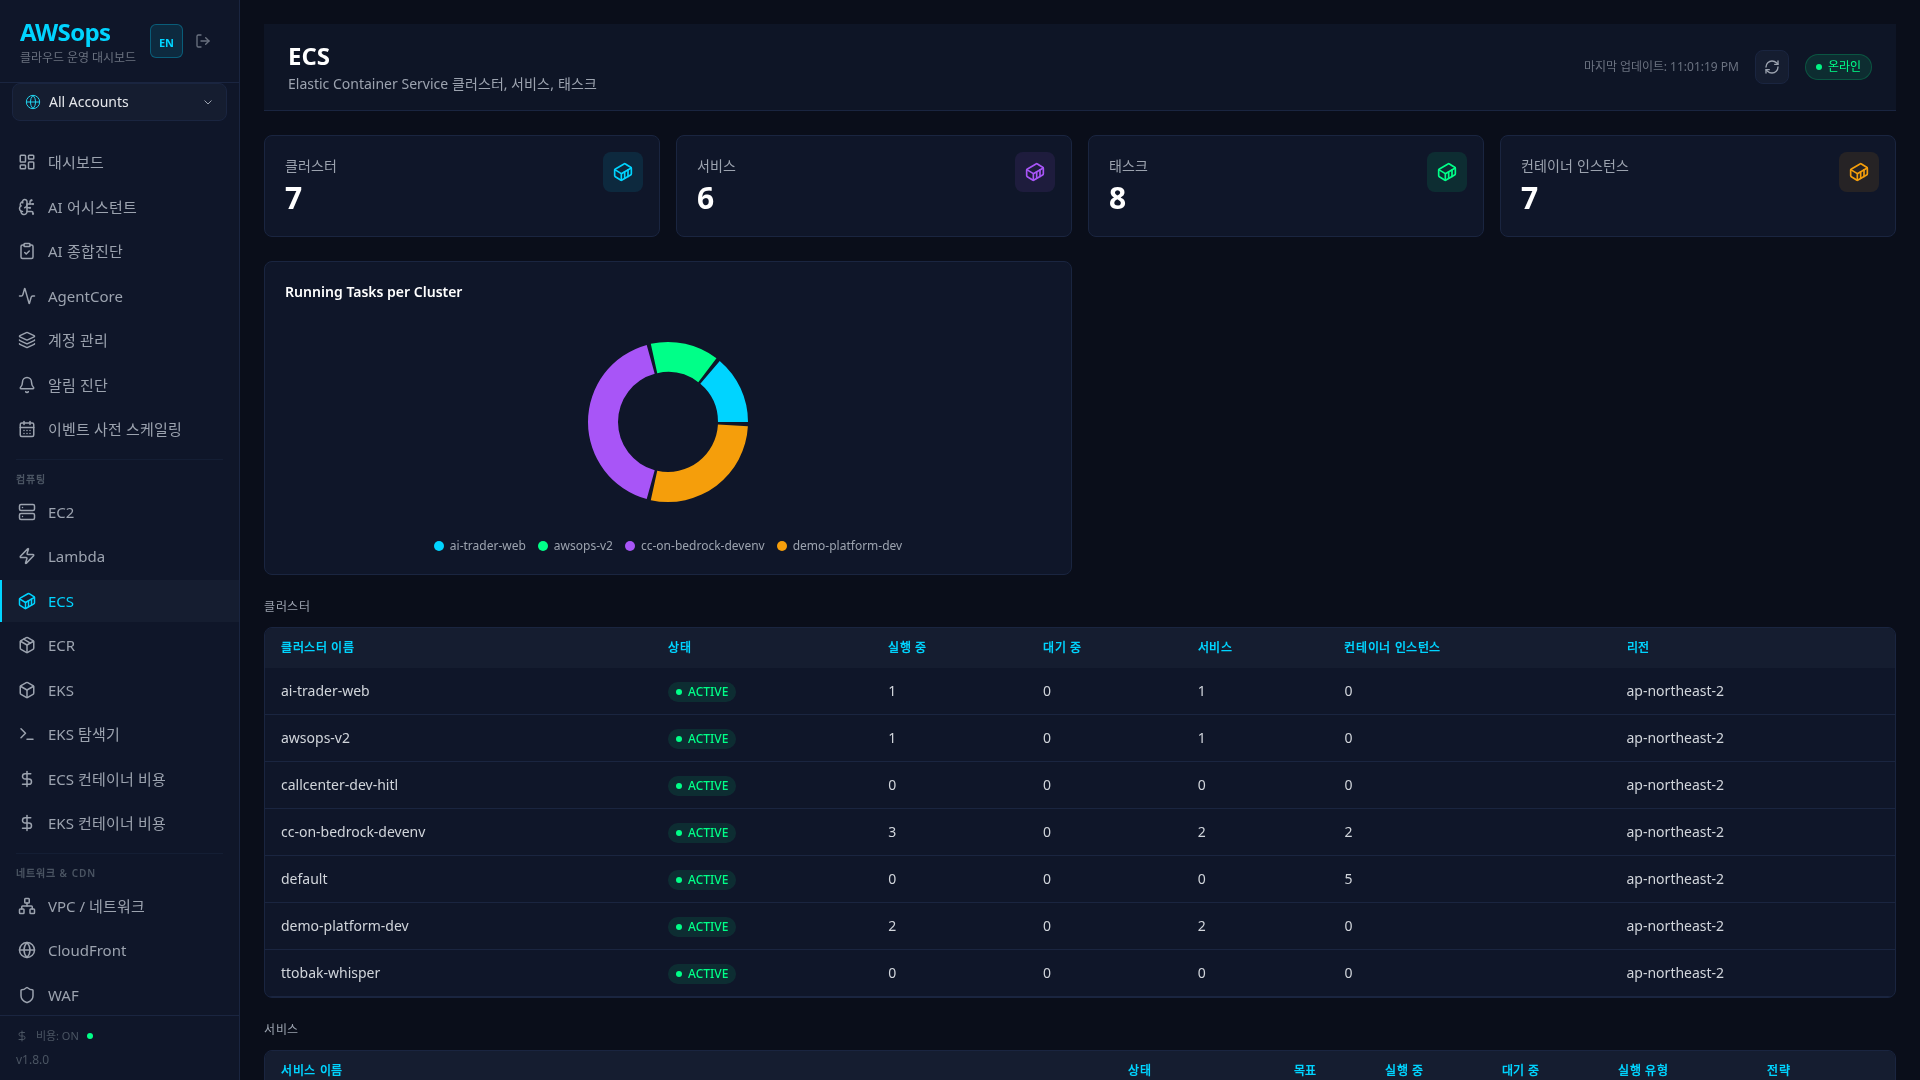
v1 monitored clusters/services/tasks together on one page. v2's primary structure is 3 separate inventory routes (/inventory/ecs_cluster, /inventory/ecs_service, /inventory/ecs_task — each with its own table, filters, and detail panel), now complemented by a unified overview page /inventory/ecs (sidebar 'ECS Overview') showing the summary KPI band (cluster/service/task counts + tasks below desired), the clusters table, and the services table on one screen. The overview is a read-only glance layer — search/facets/detail live on the three type pages, reachable via each table's 'View all' link. Pages at or over 500 rows are labeled as a sample (the service-derived running/desired/deficit rollup is withheld over a sample or whenever the service sync's last run is not succeeded; the Tasks KPI is a separate full summary aggregate, gated on the ecs_task sync-run status), a non-succeeded sync renders a state-specific caption (failed = stale-data note, partial, in-progress), and pre-sync data reads 'not collected yet'.
Key Features
ECS Clusters (/inventory/ecs_cluster)
Highlight cards show a dedicated KPI band — ACTIVE cluster count, total running tasks, total active services, total container instances — plus a Top-N bar chart ranked by running task count.
Table columns:
| Column | Description |
|---|---|
| Status | Status (ACTIVE, INACTIVE) |
| Running | Number of running tasks |
| Pending | Number of pending tasks |
| Services | Number of active services |
| Instances | Number of registered container instances |
| MTD Cost ($) | Month-to-date cost |
Detail panel: Identity (Name, Account, Region, ARN) / Tasks & Services / Config (Settings, Container Insights, etc.) / Tags sections — Settings render as per-item label–value rows (e.g. containerInsights disabled).
ECS Services (/inventory/ecs_service)
Highlight cards show Desired/Running/Pending totals and the distinct cluster count.
Table columns:
| Column | Description |
|---|---|
| Service | Service name |
| Status | Status (ACTIVE, DRAINING) |
| Desired | Desired task count |
| Running | Running task count |
| Pending | Pending task count |
| Launch | Launch type (FARGATE, EC2) |
| Strategy | Scheduling strategy |
| Cluster | Owning cluster |
| Task def | Task definition |
| Created | Creation date |
ECS Tasks (/inventory/ecs_task)
Highlight cards show the RUNNING count, Fargate task count, total daily cost (estimate), and distinct cluster count. Cost is a static estimate derived from the task definition's cpu/memory — see ECS Container Cost for the calculation details.
Table columns: Task, Cluster, Group, Status, Launch, CPU, Memory, Cost/Day, Cost/Mo, AZ, Started.
How to Use
- Click Compute > ECS Clusters / Services / Tasks in the sidebar for the route you need
- Review the overall status of that resource from the highlight cards at the top
- On the Services page, compare Desired vs Running; on the Clusters page, check per-cluster status
- Click a row to view detailed settings in the detail panel
Fargate vs EC2 Launch Type
| Aspect | Fargate | EC2 |
|---|---|---|
| Infrastructure Management | Serverless (AWS managed) | Self-managed |
| Cost | vCPU/Memory based | EC2 instance cost |
| Scaling | Automatic | Auto Scaling configuration required |
| Cost Analysis | Cost/Day, Cost/Mo columns on the ECS Tasks view (static estimate) | Not supported |
Tips
If Running is less than Desired in the Services table, there may be an issue with task deployment. Check the task failure cause.
If Pending Tasks persist for a long time, suspect resource shortage or scheduling issues.
You can analyze with the AI Assistant using queries like "ECS cluster list", "Show Fargate services", "Analyze task deployment failure cause", etc.
Related Pages
- ECR - Container image registry
- ECS Container Cost - ECS task cost analysis
- VPC - ECS network configuration