Canvas 애니메이션 데모
HTML5 Canvas 기반으로 AWS 서비스 아키텍처를 단계별 애니메이션으로 시각화하는 데모입니다. Remarp의 Canvas DSL로 선언적으로 다이어그램을 정의하면, 빌드 시 JavaScript 애니메이션 코드로 컴파일됩니다.
데모
스크린샷
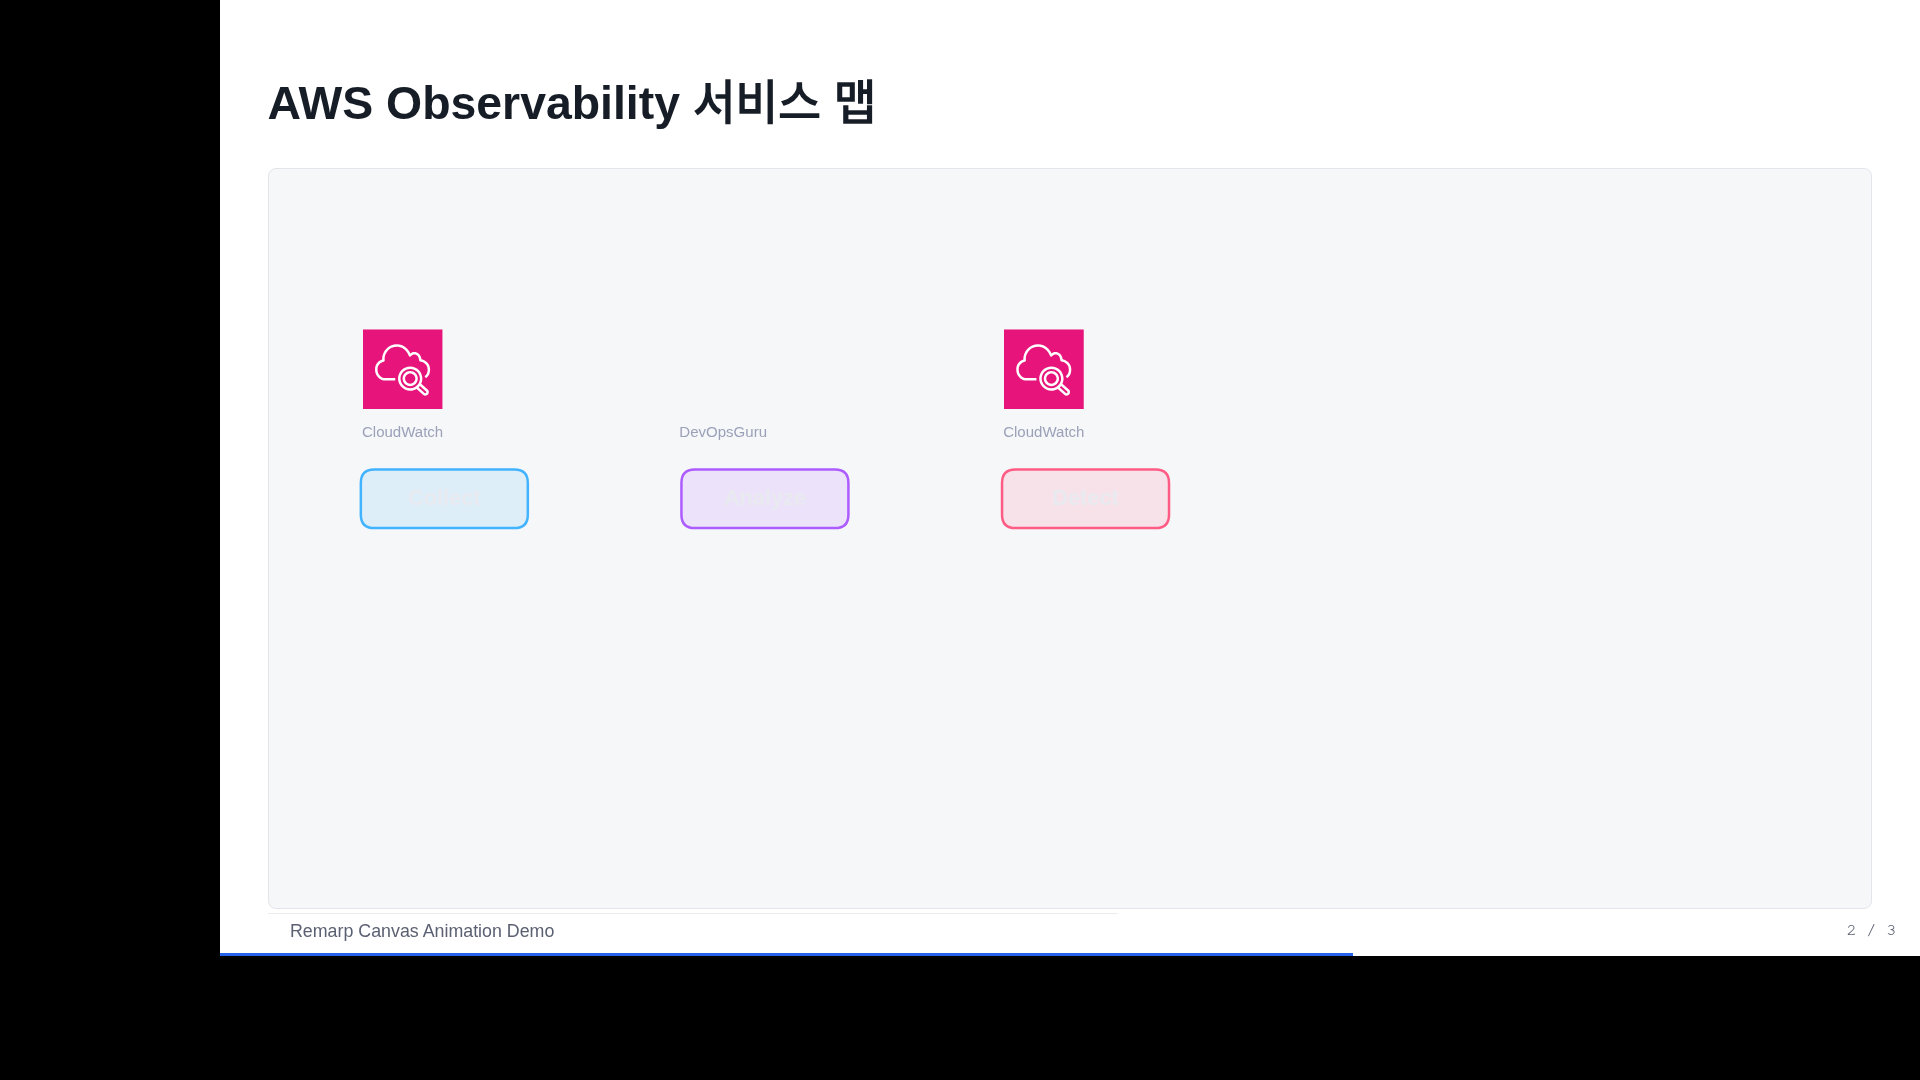
AWS Observability 서비스 맵
v1.9.0 토큰 디자인 시스템(light 기본 테마)으로 재빌드 — Canvas DSL이 role 토큰 색상에 자동 적응(↑↓ step으로 단계 공개).
AIOps 자동화 파이프라인 (Block 3)
Canvas Step 애니메이션
생성 프롬프트
"AWS AIOps 마스터클래스에서 AWS Observability 서비스 맵을
Canvas 애니메이션으로 보여줘. Collect → Analyze → Detect → Trace → Act
5단계 파이프라인을 step별로 나타내고, 각 단계에 AWS 아이콘 포함."
Remarp Canvas DSL 소스
@type: canvas

## AWS Observability 서비스 맵

:::canvas
# Collect Stage
icon cw "CloudWatch" at 80,120 size 48 step 1
box collect "Collect" at 55,180 size 100,35 color #41B3FF step 1

# Analyze Stage
icon guru "DevOpsGuru" at 272,120 size 48 step 2
box analyze "Analyze" at 247,180 size 100,35 color #AD5CFF step 2

# Detect Stage
icon anomaly "CloudWatch" at 464,120 size 48 step 3
box detect "Detect" at 439,180 size 100,35 color #FF5C85 step 3

# Trace Stage
icon xray "X-Ray" at 656,120 size 48 step 4
box trace "Trace" at 631,180 size 100,35 color #00E500 step 4

# Act Stage
icon eb "EventBridge" at 848,120 size 48 step 5
box act "Act" at 823,180 size 100,35 color #FF693C step 5

# Connections
arrow collect -> analyze "metrics" step 6
arrow analyze -> detect "insights" step 6
arrow detect -> trace "traces" step 7
arrow trace -> act "events" step 7
:::
Canvas DSL 핵심 요소
| 요소 | 문법 | 설명 |
|---|---|---|
icon | icon id "Service" at x,y size N step S | AWS 아이콘 배치 |
box | box id "Label" at x,y size w,h color C step S | 색상 박스 |
arrow | arrow from -> to "label" step S | 요소 간 연결선 |
text | text "Label" at x,y size S color C | 텍스트 요소 |
step | step S (각 요소 뒤) | 스페이스바로 순차 등장 |
동작 방식
- Remarp 빌드 시 Canvas DSL이 JavaScript 코드로 컴파일
animation-utils.js의drawBox(),drawArrow(),drawIcon()함수 사용step값에 따라 스페이스바 클릭 시 요소가 순차적으로 나타남- AWS 아이콘은
../common/aws-icons/경로에서 자동 매핑